

Abstract
Background
Type 2 diabetes (T2D) is associated with increased risk of dementia. The prospective longitudinal Israel Diabetes and Cognitive Decline study aims at identifying T2D-related characteristics associated with cognitive decline.
Methods
Subjects are population-based T2D 65+, initially cognitively intact. Medical conditions, blood examinations, and medication use data are since 1998; cognitive, functional, demographic, psychiatric, DNA, and inflammatory marker study assessments were conducted every 18 months. Because the duration of T2D reflects its chronicity and implications, we compared short (0–4.99 years), moderate (5–9.99), and long (10+) duration for the first 897 subjects.
Results
The long duration group used more T2D medications, had higher glucose, lower glomerular filtration rate, slower walking speed, and poorer cognitive functioning. Duration was not associated with most medical, blood, urine, and vital characteristics.
Conclusions
Tracking cognition, with face-to-face evaluations, exploiting 15 years of historical detailed computerized, easily accessible, and validated T2D-related characteristics may provide novel insights into T2D-related dementia.
Keywords: Cognitive decline, Dementia, Type 2 diabetes, Elderly, Cognitively normal, Risk factors, Study design
1. Introduction
Type 2 diabetes (T2D) has been consistently associated with increased risks for dementia [1–3], mild cognitive impairment (MCI) [4], and cognitive decline [5–7]. T2D or impaired fasting glucose might be present in up to 80% of patients with Alzheimer's disease (AD) [8]. The metabolic syndrome, which commonly precedes the development of frank T2D, has been associated with dementia, both AD and vascular dementia [9]. A systematic review of the effect of diabetes on dementia and cognitive decline concluded that these should be considered consequences and disabling manifestations of diabetes [10]. Despite the ever-growing prevalence of both diabetes and dementia, few studies have investigated more specific determinants of risk for cognitive decline in diabetic individuals [11]. T2D is a complex metabolic disorder that is closely associated with other risk factors for dementia, such as age and hypertension [12,13]. These risk factors, together with diabetes-specific characteristics (e.g. age of onset, glycemic control, use of specific antidiabetes medications), demographic and socio-economic factors, and genetic factors, might be important determinants of the increased risk of cognitive decline in individuals with T2D [14].
The objective of the prospective longitudinal Israel Diabetes and Cognitive Decline (IDCD) study is to identify specific modifiable (e.g. glycemic control) and nonmodifiable (e.g. genes) characteristics of T2D that increase the risk of cognitive decline and dementia. Current interventions to treat dementia and AD, and MCI, have been of limited effectiveness. The investigation of modifiable risk factors could provide primary prevention for individuals at risk. In addition, the identification of specific risk factors within T2D that increase the risk for cognitive compromise may help to focus on underlying mechanisms, and support better design of clinical trials, such as in the area of pharmacogenomics. Finally, in the light of relationships of insulin [15], glycemic control [16], hypertension [12], and other diabetes-related characteristics with dementia risk in non-T2D individuals, discoveries from the IDCD study may not only be pertinent to T2D per se, but may generalize to all elderly. The overall hypotheses of the IDCD study are that glycemic control is a key factor and that not only it will be associated with cognitive decline, it will also modulate relationships of several other risk factors (such as the duration of disease [17] and inflammation [18]) with cognition, such that relationships will be stronger with poorer levels of glycemic control. Because T2D is associated with both neurodegenerative and vascular brain abnormalities [19], we hypothesize that both episodic memory (affected early in the course of AD) and executive functions and working memory (affected by cerebrovascular disease) will be associated with the risk factors.
In this article, we describe the design of the IDCD study, and the baseline characteristics of the first 897 eligible subjects who have completed their baseline evaluation. The study has enrolled thus far 1288 subjects of whom 8.5% refused to continue after signing the informed consent form and 21.9% were excluded by eligibility criteria (see Figure 1). Because the duration of T2D reflects the chronicity of the disease and its implications, we compared short (0–4.99 years), moderate (5–9.99), and long (10+) duration on a rich trove of prospective historical risk factor data.
Fig. 1.

The Israel Diabetes and Cognitive Decline study- participants' recruitment catchment area.
2. Methods
2.1. Overview
The IDCD study is a collaboration between the Mount Sinai School of Medicine, NY, the Sheba Medical Center, Israel, and the Maccabi Healthcare Services (MHS), Israel. Medical care in Israel is provided by four Preferred-Provider Organizations (PPOs). Membership is compulsory for all Israeli citizens and therefore represents all sectors in the general population. Patients are free to move between the PPOs. Despite this, only 2% move per year. Copayment medication costs for patients are capped at ∼ $80 per month, whereas laboratory tests are without charge. All PPO physicians use a computerized medical record exclusively for medical charting, and comprehensive and complete clinical data have been collected in central databases since 1995. Each patient has a unique and permanent identifier which is linked to all clinical and administrative data including medication purchases and laboratory results. Payments to the PPOs are made through the social security system. There is minimal loss to contact and prompt death notification. The MHS is the second largest of these PPOs, and insures a representative cross-section of two million residents. All MHS data sets are regularly, automatically backed up in an external facility. Laboratory tests and pharmacy purchases are subject to strict quality assurance.
2.2. Study cohort
The study was approved by the Institutional Review Board of Mount Sinai and the Helsinki committees of Sheba and MHS. The MHS covers approximately two million clients, of whom 185,533 have T2D (45,099 from the Tel-Aviv area, see Figure 1). Of those, 52,003 are more than the age of 65 years (11,025 from the Tel-Aviv area). This demonstrates that the proportion of elderly T2D patients in the catchment area (24.4%) is very similar to its proportion in Israel as a whole (24.3%). Eligible participants were cognitively normal T2D patients, 65+ years old, from the approximately 11,000 T2D individuals in the MHS Diabetes Registry (described later) living in the area of Tel-Aviv, Israel (about 70 square miles; see Figure 1). Subjects were excluded if they had dementia or MCI, received cholinesterase inhibitors, or had major diseases that could affect cognitive performance. Only subjects with at least three HbA1c measurements were included. Finally, only subjects with an informant with substantial contact, and who spoke Hebrew well (to ensure valid cognitive testing) were eligible.
The MHS team screened the Diabetes Registry and the electronic patient record (EPR) to identify potential subjects, applying the exclusion criteria. After the identification of suitable subjects, letters were sent by MHS to the primary care physicians, asking for permission to contact each patient regarding the proposed study. If the doctors agreed, letters were sent to the patients briefly describing the study and saying they would be contacted by phone in the following 2 weeks. The study coordinator then called the patients and invited them to participate in the study, after determining that they were fluent in Hebrew and had a family member or caregiver whom they see at least 10 h per week who was willing to be a study informant. The social structure of Israel is such that most elderly individuals live with or near their extended family, so few were excluded for this reason. We attempted to identify a second informant to be a replacement if necessary. Figure 2 depicts the flow of the study procedures.
Fig. 2.
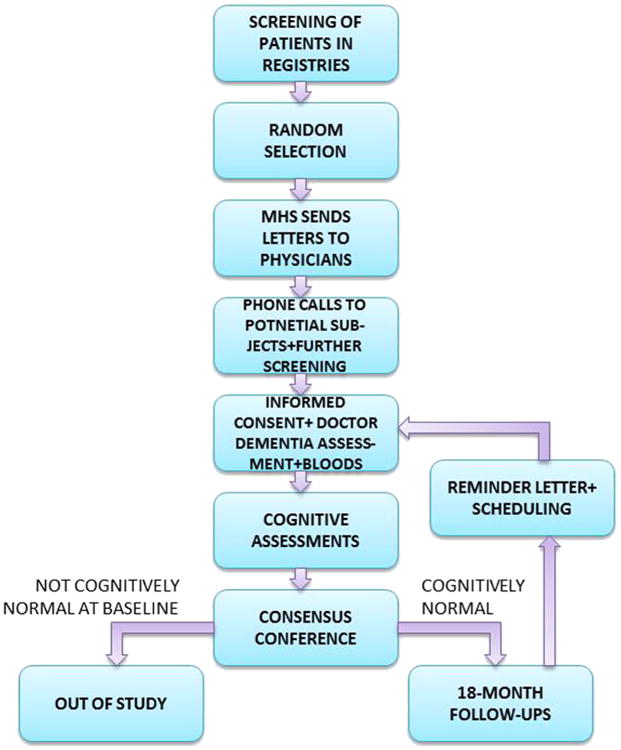
Flow chart of study procedures.
Except as noted, all baseline assessments are repeated at each follow-up. Informed consent at every baseline and follow-up is signed by all subjects, who are assessed at their residences (except for a few who choose to be assessed at the Sheba Medical Center). Israeli Helsinki committees require that a physician obtains the informed consent if blood is to be drawn so subjects are visited twice. At the first visit a physician obtains informed consent and then performs medical, neurological, and psychiatric exams, as well as the blood draw. At the second visit, a neuropsychologist assesses subjects with a broad neuropsychological battery, the neuropsychiatric inventory, and the Clinical Dementia Rating scale.
In the context of a low education level for a substantial proportion of the sample, a multidisciplinary diagnostic consensus conference assesses cognitive status at every baseline and follow-up. The conference includes neurologists, psychiatrists, neuropsychologists, and research coordinators, with at least two professions represented. In this conference all medical, psychiatric and neurological data are discussed to arrive at a diagnosis. Subjects who are not cognitively normal at baseline are excluded from the study. Subjects who are demented at follow-up are not eligible for any more follow-ups. All other subjects are scheduled for a follow-up assessment 18 months later.
2.3. The MHS Diabetes Registry
The MHS diabetes registry collects data from the MHS EPR, central laboratory, and pharmacies. The registry was established in 1998 to facilitate disease management and to improve treatment. Entry criteria to the registry are any of the following: (1) HbA1c >7.25%, (2) Glucose >200 mg/dl on two examinations more than 3 months apart, (3) purchase of diabetic medication twice within 3 months, (4) diagnosis of T2D (International Classification of Diseases [ICD9] code) by a general practitioner, internist, endocrinologist, ophthalmologist, or diabetes advisor, supported by a HbA1c>6.5% or glucose>125 mg/dl within half a year. These criteria were initially validated by 20 physicians in MHS against their own practice records. There is an ongoing process of validation by which the physicians are encouraged to report on patients that in their opinion do not have diabetes. The register is updated on a daily basis. Additionally, age-specific prevalence rates were similar to those of a diabetes registry of another large PPO in Israel [20].
2.4. Demographics
Age, gender, years of education, primary profession, and country of birth are collected at the baseline visit.
2.5. Medical characteristics
2.5.1. Dementia status
To be eligible for the study, subjects must be cognitively normal at baseline by consensus conference, including a Clinical Dementia Rating scale [21] of zero (nondemented). The diagnosis of MCI is based on Petersen's criteria [22], AD by the National Institute of Neurological and Communicative Diseases and Stroke/Alzheimer's Disease and Related Disorders Association (NINCDS-ADRDA) new criteria [23], vascular dementia by the National Institute of Neurological and Communicative Diseases and Stroke/Association Internationale pour la Recherche et l'Enseignement en Neurosciences (NINDS-AIREN) criteria [24], parkinsonism and Parkinson's disease by the CAPIT criteria [25], and the diagnosis of dementia of the Lewy Body type by the Report of the Consortium on Dementia with Lewy Bodies International Workshop [26].
2.5.2. Medical diagnoses
History of hypertension, hyperlipidemia, heart disease (myocardial infarction, angina pectoris), lung and eye disease, and hypothyroidism are extracted from the MHS EPR and the Maccabi Cardiovascular register [27]. For simplicity, we do not present diagnoses that have not been associated with cognitive compromise in the literature or that have a frequency less than 10% in this sample. Hypoglycemic episodes were self-reported; subjects were asked whether they have had such episodes, at what frequency, and whether they required hospitalization.
2.5.3. Blood and vital measurements
Longitudinal assessments from the MHS Diabetes Registry were averaged for each subject; vital signs included systolic and diastolic blood pressure measured on the left arm in a sitting position and oxygen saturation measured with a C202 Fingertip Pulse Oximeter. Blood measurements included glucose, HbA1c, total cholesterol, high density lipoprotein (HDL), low density lipoprotein (LDL), triglycerides, albumin, thyroid-stimulating hormone (TSH), free T4, creatinine, vitamin D, vitamin B12, and folic acid. Body mass index (BMI) is calculated by weight (kg)/[height (m)] [2], All measurements are obtained at baseline and each follow up.
2.6. Complications of diabetes
Macrovascular complications (heart disease including acute myocardial infarction and angina pectoris and peripheral vascular disease) are captured from the MHS cardiovascular register based on ICD9 codes; stroke was an exclusion criterion. Microvascular complications are best assessed by the rate of development of nephropathy. For this study we chose to assess nephropathy using laboratory data such as urinary microalbuminuria and glomerular filtration rate (calculated using the Modification of Diet in Renal Disease Study formula). Because the diagnosis of neuropathy in the community setting is usually made by subjective means, we did not include it in the present report. The diagnosis of retinopathy is based on ICD9 code.
2.7. Medications
Medication use data are also extracted from the EPR. For the sake of simplicity, we focus here on any recorded use of medications for T2D, which are classified as no medication, only noninsulin hypoglycemic medication, only insulin, and use of both insulin and hypoglycemic noninsulin medication. For the purposes of this report, subjects are categorized by having ever/never taken the medication. The medications included are insulin, metformin, rosiglitazone, glibenclamide, glyburide, exenatide, acarbose, liraglutide, and repaglinide.
2.8. Functional assessments
Activities of daily living (ADL) are self-reported using the Barthel scale (eating, bathing, personal hygiene, dressing, bowel control, bladder control, toilet, transfer, walking, climbing stairs; a score of 100 reflects full independence [28]). Instrumental ADL is reported using the Lawton scale (using the phone, going to places, shopping, preparing meals, doing house work, doing the laundry, taking medications, doing financial chores; a score of 18 reflects full independence [29]). Subjective perception of health is compared with other peers (1 very bad to 5 excellent). Gross motor activities (bending, lifting 5 kg, extending arms, walking 400 m, and doing house chores) are also rated in a standardized questionnaire [30]. We measured hand grip with a Sammons Preston Jamar plus dynamometer and the number of seconds taken to walk 3 m.
2.9. Cognitive and psychiatric measures
A broad neuropsychological assessment of 14 tests covers four domains: memory (Alzheimer's Disease Assessment Scale [ADAS] word list immediate recall, delayed recall, and recognition; Logical Memory immediate and delayed recall), attention/working memory (Diamond Cancellation, Digit Span forward and backward), executive functions (Trails Making Test A and B, Digit Symbol Substitution Test), and semantic categorization (Similarities, Letter and Animal Fluency). Composite measures of the four cognitive domains are calculated at baseline by converting each test score to a z-score and then summing the z-scores. For follow-up assessments, the baseline means and standard deviations will be used for conversion. An additional global cognition measure is calculated by summing the z-scores from all tests. The Mini-Mental State Examination (MMSE [31]) is also used to describe the sample. Depressive symptoms measured by the Geriatric Depression Scale [32]. Behavioral symptoms are assessed using the Neuropsychiatric inventory [33].
2.10. Biological specimens
At baseline and every follow-up blood samples are taken for DNA (for future genetic and epigenetic studies) and for inflammatory markers. DNA is extracted and frozen in −80°C and so far has been used for APOE, Haptoglobin, and TOMM40 genotyping according to established methods. The remainder is saved for future studies and collaborations. Serum is used to assess two inflammatory markers, C-reactive protein (CRP), and IL-6. Morning bloods are obtained after a 10-h fast, then centrifuged. Serum is stored at −80°C until determination. CRP levels are measured with a sandwich-type enzyme-linked immunosorbent assay in which polyclonal rabbit anti-CRP antibodies are used as capture antibodies and a biotinylated monoclonal antibody against CRP (CLB anti-CRP-2) is used as the detection antibody [34]. IL-6 is measured using a commercial solid phase immulite (Diagnostic Products Corporation, Los Angeles, CA, USA) [35].
2.11. Study timelines
The study began recruitment in January 2010. Baseline assessments were completed in 24 months. The neuropsychologist assessment was performed after—but within 2 weeks of—the physician assessment. The physician first administered the informed consent, then confirmed eligibility criteria, collected demographic information, and assessed oxygen saturation, dynamometer, and the time to walk 3 m. Then a log of the current medications was filled and a psychiatric questionnaire was completed as were questions about falls. Then a neurological examination was performed. Lastly, blood draws were performed. The neuropsychologist first administered the MMSE, CDR, and then the neuropsychological testing in the following order: Logical Memory immediate recall, digit span forward and backward, category fluency, trail making test A, trail making test B, digit symbol, Boston naming test, logical memory delayed recall, ADAS-cog word list immediate recall, diamond cancellation, similarities, letter fluency, praxis, ADAS-cog word list delayed recall and recognition, geriatric depression scale, and neuropsychiatric inventory.
2.12. Postmortem assessment
Because it is possible that subjects will die with a degree of cognitive impairment that is different than in the last assessment, we will perform a postmortem CDR [36] with the primary caregiver which will be used in ancillary analyses.
2.13. Statistical analyses
In this article we describe the first 897 subjects of the IDCD cohort, categorized by years in the Diabetes Registry. This exploits the extraordinary breadth of long-term diabetes-related data that will be used to predict cognitive decline and dementia in this prospective longitudinal study. Subjects were categorized into three groups reflecting their time in the registry serving as a surrogate for duration of T2D, short (0–4.9 years), moderate (5.0–9.9 years), and long (≥10 years). Comparisons among these groups for categorical variables used Pearson's chi-square or Fisher's exact test; comparisons for continuous variables measured once per subject used analysis of variance. Comparisons among the groups for continuous repeatedly measured variables that were normally distributed used linear mixed models with a compound symmetric correlation structure to account for the correlations among multiple measurements from a single subject [37]. For continuous repeatedly measured variables that were not normally distributed and that had large numbers of zeroes, representing a “floor” effect (e.g., TSH, folic acid), a Tobit mixed regression model was used to estimate geometric means and the within-subject and between-subject standard deviations [38]. Statistical analyses were performed using SAS Version 9.2 (SAS Institute Inc., Cary, NC, USA).
3. Results
Table 1 compares baseline characteristics of subjects categorized by the duration of T2D, based on years in the Diabetes Registry: short (N = 110; 12.3%), moderate (N = 353; 39.4%), and long (N = 434; 48.4%).
Table 1. Characteristics of the IDCD cohort by duration of T2D.
| Duration of disease (mean (SD) unless otherwise specified) | Short 0–4.99, N = 110 | Moderate 5–9.99, N = 353 | Long 10+, N = 434 | P-value* |
|---|---|---|---|---|
| Demographic characteristics | ||||
| Age, yr | 70.5 (4.5) | 71.6 (4.4) | 72.7 (5.0) | <.0005 |
| Sex, females (%) | 52 | 41 | 38 | .03† |
| Education, yr | 13.1 (3.7) | 13.3 (3.5) | 12.9 (3.5) | .38 |
| No. of blood assessments | 7.8 (4.5) | 15.0 (6.6) | 22.6 (9.6) | <.0005 |
| Medical characteristics and diagnoses | ||||
| Hypertension, % | 83.6 | 82.4 | 89.5 | .01 |
| Hyperlipidemia, % | 91.8 | 92.6 | 91.3 | .79 |
| Retinopathy, % | 29.1 | 32.3 | 51.0 | <.0005 |
| Cataract, % | 54.6 | 65.7 | 71.1 | .004 |
| Cardiac dysrhythmias, % | 17.3 | 19.0 | 21.6 | .48 |
| Peripheral vascular disease, % | 8.2 | 15.0 | 21.4 | .002 |
| Acute myocardial infarction, % | 7.3 | 11.3 | 10.9 | .47 |
| Angina pectoris, % | 8.2 | 11.3 | 16.7 | .02 |
| Chronic renal failure, % | 9.1 | 8.2 | 14.3 | .02 |
| Hypothyroidism, % | 14.5 | 14.2 | 14.5 | .99 |
| Hypoglycemia (w/hospitalization) % | 0.9 | 0.9 | 3.3 | .04† |
| Blood, urine, and vital measurements | ||||
| BMI, kg/m2 | 28.5 (4.2) | 29.3 (11.4) | 28.1 (4.3) | .07 |
| CRP, μg/ml | 1.4 (1.7) | 1.2 (1.9) | 1.3 (2.7) | .83 |
| IL-6, pg/ml | 2.9 (2.7) | 2.9 (2.6) | 3.0 (2.6) | .85 |
| GFR, ml/min/1.73 m2 | 81.8 (24.1) | 85.1 (27.0) | 76.8 (25.5) | <.0005 |
| HbA1c, % | 6.6 (0.4) | 6.6 (0.4) | 7.1 (0.6) | <.0005 |
| Oxygen saturation, mg/l | 97.29 (1.16) | 97.24 (1.30) | 97.47 (1.05) | .02 |
| Glucose, mg/dl | 124.1 (16.3) | 130.7 (17.8) | 143.0 (21.0) | <.0005 |
| Total cholesterol, mg/dl | 175.4 (27.9) | 176.7 (25.1) | 176.7 (21.3) | .90 |
| LDL, mg/dl | 92.3 (23.7) | 98.3 (18.8) | 98.3 (16.6) | .06 |
| HDL, mg/dl | 48.1 (10.1) | 47.8 (10.6) | 47.6 (11.1) | .88 |
| Triglycerides, mg/dl | 158.2 (55.6) | 153.8 (68.8) | 155.6 (54.5) | .81 |
| Albumin, g/dl | 4.29 (0.19) | 4.32 (0.19) | 4.30 (0.19) | .44 |
| Creatinine, mg/dl | 0.91 (0.25) | 0.98 (0.26) | 1.01 (0.24) | <.0005 |
| TSH, μIU/ml | 2.84 (0.99) | 2.35 (1.16) | 2.63 (1.63) | .01 |
| Vitamin D, ng/ml | 22.1 (6.5) | 21.5 (5.4) | 22.0 (6.1) | .69 |
| Vitamin B12, ng/ml | 401.7 (86.2) | 400.3 (95.8) | 403.5 (89.4) | .94 |
| Folic acid, μg/l | 3.8 (2.1) | 3.6 (1.7) | 3.9 (1.9) | .27 |
| Free T4, pmol/l | 15.1 (2.9) | 14.9 (2.5) | 15.0 (1.7) | .97 |
| APOE4 genotype carriers, % | 14.3 | 15.2 | 14.8 | .98† |
| Haptoglobin 22 genotype carriers, % | 46 | 47 | 50 | .23† |
| Microalbumin (in urine, at least one measure higher 30 mg/l) % | 5 | 12 | 25 | <.0005 |
| Total protein (in urine, at least one measure higher 140) mg/dl, % | 7 | 9 | 21 | <.0005 |
| Albumin/creatinine ratio (in urine, at least one measure higher 21 mg/mmol), % | 31 | 40 | 44 | .050 |
| SBP, mm Hg | 164.2 (8.5) | 166.3 (9.0) | 165.7 (9.7) | .08 |
| DBP, mm Hg | 82.5 (14.1) | 85.6 (15.6) | 82.3 (13.2) | .01 |
| Diabetes medications | ||||
| No medications, % | 23 | 17 | 5 | <.0005† |
| Noninsulin medications only, % | 73 | 80 | 79 | |
| Insulin only, % | 0 | 1 | 1 | |
| Noninsulin + insulin, % | 4 | 2 | 15 | |
| Functional measurements | ||||
| ADL, % nonperfect Barthel | 1.9 | 4.2 | 5.1 | .37 |
| IADL, % nonperfect Lawton | 18.1 | 22.8 | 25.2 | .28 |
| Motor activities (score from 1–5) | 1.5 (0.9) | 1.5 (0.9) | 1.5 (0.9) | .91 |
| Speed of 3-m walk, seconds | 4.2 (2.1) | 4.2 (2.0) | 4.8 (2.8) | .003 |
| Hand grip, kg | 26.7 (8.6) | 29.2 (10.5) | 27.9 (9.6) | .06 |
| Cognitive‡ and psychiatric measures | ||||
| MMSE | 28.4 (1.5) | 27.9 (1.9) | 27.9 (1.8) | .04 |
| Global cognition | 1.7 (0.71) | 0.87 (0.37) | −1.07 (0.37) | <.0005 |
| Memory | 0.42 (0.22) | 0.13 (0.11) | −0.20 (0.11) | .02 |
| Attention/working memory | 0.10 (0.18) | 0.22 (0.11) | −0.19 (0.10) | .03 |
| Executive functions | 0.73 (0.27) | 0.31 (0.15) | −0.44 (0.15) | <.0005 |
| Semantic categorization | 0.44 (0.23) | 0.19 (0.13) | −0.24 (0.12) | .01 |
| GDS | 2.4 (2.3) | 2.2 (2.3) | 2.2 (2.3) | .46 |
| Health quality | 3.6 (1.0) | 3.4 (1.1) | 3.5 (1.0) | .33 |
Abbreviations: BMI, body mass index; CRP, c-reactive protein; GFR, glomerular filtration rate; LDL, low-density lipoprotein; HDL, high-density lipoprotein; TSH, thyroid stimulating hormone; APOE, apolipoprotein E; SBP, systolic blood pressure; DBP, diastolic blood pressure; ADL, activities of daily living; IDL, instrumental activities of daily living; MMSE, Mini-Mental State Examination.
F-test P-value (analysis of variance), unless otherwise noted.
Chi [2] P-value.
The cognitive outcomes, except for the MMSE, are presented as means and standard error of the mean (rather than standard deviation).
3.1. Demographics
Subjects were approximately 72 years of age, they averaged 13 years of education (40% had less than 12 years of education), 18 laboratory visits, 9 years in the registry and 40% were women.
Not surprisingly, the longer the duration of T2D, the older the subjects, and the more laboratory examinations; the proportion of men also increased. However, no differences were found between the groups in education. Excluded subjects and refusers were younger, had longer T2D duration, and received more insulin than participants, but did not differ substantially on other demographic or clinical characteristics.
3.2. Selected medical characteristics
Overall, patients with a longer duration of disease had higher rates of most medical diagnoses, especially for the group with a long duration of diabetes.
The groups did not differ significantly on hyperlipidemia, cardiac dysrhythmias, and acute myocardial infarction. The 10+ duration of disease group had significantly higher rates of severe hypoglycemic episodes requiring hospitalization.
3.3. Blood, urine, and vital measurements
The three groups of duration of disease did not differ in BMI, serum levels of inflammatory markers (CRP and IL-6), systolic blood pressure, total, HDL, LDL cholesterol, triglycerides, albumin, vitamin D, vitamin B12, folic acid, or free T4.
There were no differences in presence of the APOE4 allele or Haptoglobin22 genotype.
The groups differed in GFR and TSH levels with the moderate duration group having better (higher GFR and lower TSH) results than the other two groups; similarly, DBP was also higher in the moderate duration group. Glucose and creatinine levels, and urine microalbumin and albumin/creatinine ratio increased with the increasing duration of disease. Oxygen saturation levels and high total protein were higher in the long duration group.
3.4. MedicationsThe groups differed significantly in their diabetes-related medications
The percentage of subjects ever receiving both a hypoglycemic medication and insulin (not necessarily concomitantly) more than tripled in the 10+ duration group, whereas the percentage of those controlling diabetes through diet only, decreased from 23% in the 0 to 5 years of duration group to 5% on the 10+ group.
3.5. Functional measurements
Speed of walking 3 m was slower in the long duration group.
The groups did not differ significantly in motor activities, ADL, instrumental activities of daily living, and hand grip.
3.6. Cognitive and psychiatric measures
The overall cognitive composite and three of the four cognitive domain composites deteriorated with the longer duration of disease; attention/working memory was worse for long duration than the other groups.
The MMSE was higher in the short duration group, but the groups did not differ in the number of depressive symptoms and in the subjective perception of health quality.
Because most characteristics described previously are affected by age, and because age increased with the increasing duration of T2D, we repeated all comparisons adjusting for age. Results were essentially unchanged (data not shown).
4. Discussion
The IDCD study has recruited a cohort of T2D nondemented elderly, living in the central area of Israel, who have agreed to evaluations every 18 months. This article exploited the MHS computerized data to describe demographic, medical, laboratory, genetic, functional, cognitive, and psychiatric characteristics by duration of diabetes. The random recruitment of subjects is illustrated by a broad range of years of education, with 40% of the sample having 12 years of education or less. Not surprisingly, the long duration group was older and had higher rates of several diagnoses (primarily diagnoses related to heart and renal disease and hypoglycemic episodes requiring hospitalization). These may reflect the growing severity of T2D with the longer duration of disease. Consistent with that, the long duration group had more subjects with the history of both insulin and noninsulin diabetes medications and less reliance on diet alone and had higher levels of glucose and lower levels of GFR. However, the longer duration of disease was not associated with most medical, blood, urine, and vital characteristics including lipid and vitamin profiles, possibly due to statin use and vitamin supplementation. In addition, functional measurements did not differ by the duration of disease except for the speed of walking. In contrast, cognitive functioning in specific domains and in an overall measure of cognition was consistently poorer with increasing length of disease.
We chose to present the raw results to facilitate comparability with other samples of T2D and non-T2D participants around the world. This was reinforced by finding that the adjustment for age did not affect the results whatsoever, suggesting that the characteristics that worsened with longer duration of disease were due to T2D per se rather than older age. Typically, macro (stroke, MI) and microvascular (nephropathy) complications of diabetes are considered the primary signals of increasing severity of T2D. Our results suggest that although the chronicity of T2D does not affect all medical and functional life of diabetic individuals, it is associated with the deterioration of a broader range of characteristics, beyond the classical complications of T2D, and seems to include quite consistently, cognitive compromise.
Several centers are conducting longitudinal studies of T2D subjects, but most have not focused on cognitive compromise as their primary outcome. For example, the Pima Indian Study [39] includes only Indian subjects, who have an especially low prevalence of cigarette smoking and a high prevalence of heavy alcohol use. The Wisconsin Epidemiologic Study of Cardiovascular Disease in Diabetes [40] included originally both type 1 and type 2 diabetic subjects, but recently continues to follow only type 1 diabetic subjects, few of whom are elderly. Both studies do not have cognitive outcomes. The Nurses Health Study [41] has a large number of women with diabetes but the study collects data exclusively via postal surveys and subjects are geographically dispersed hindering face-to-face assessments. The Kaiser Permanente database infrastructure permits powerful investigations of an enormous number of T2D patients, but the cognitive outcomes are based on physicians' entered ICD codes of the dementias [42]; face-to-face examinations are not available. The Edinburgh type 2 diabetes study [43] has many similarities with the IDCD study, including cognitive decline as one of the a priori defined outcome measures, providing an opportunity for future collaborations and comparisons. However, many of the diabetes-related characteristics were assessed only beginning at baseline, whereas the IDCD study provides historical diabetes characterization since 1998. In addition, the Edinburgh sample does not have the ethnic heterogeneity that is the consequence of a sample from Israel, with immigration from over 50 countries.
The primary aim of the Action to Control Cardiovascular Risk in Diabetes (ACCORD) Memory in Diabetes Study was to test whether there was a difference in the rate of cognitive decline and structural brain change in patients with T2D treated with standard-care guidelines compared with those treated with intensive-care guidelines. Data from this ACCORD substudy on the possible beneficial or adverse effects of intensive treatment on cognitive function were obtained from a 30-min test battery, administered at baseline, 20-month, and 40-month visits. In addition, full-brain magnetic resonance imaging was performed on a subsample at baseline, and at 40 months, to assess the relation between the ACCORD treatments and structural brain changes. Although significant differences in total brain volume favored the intensive treatment subjects, cognitive outcomes were not different. Combined with the nonsignificant effects on other ACCORD outcomes, and increased mortality in participants in the intensive treatment group [44], the ACCORD findings do not support the use of intensive therapy to reduce the adverse effects of T2D on the brain in patients with similar characteristics to those of ACCORD participants, who had a high HbA1c and a high risk for cardiovascular events [45]. The historical data on HbA1c of the IDCD study will permit examination in a broad range of T2D severities, of relationships of long-term variations in glycemic control—distinct from the average level of glycemic control—with cognitive outcomes.
The ability to track, with face-to-face evaluations, a sample of Israelis through the socialized medical service database provided by MHS (including centralized laboratories and pharmacies providing great consistency of procedures) is exceptional. Additionally, the availability of about 15 years of detailed computerized, easily accessible information on diabetes-related characteristics provided by the MHS diabetes registry is a rare asset. The availability of an average of 18 blood assessments permits examining patterns of biomarker changes over many years in relation to cognitive outcomes, providing an opportunity to investigate “real life” relationships of cognitive decline with patterns of change in long-term biomarkers.
The IDCD study has several limitations. The Registry does not provide specific age of onset and thus we rely on years in the Registry as a surrogate to duration of disease. Most characteristics of the sample are consistent with the overall characteristics of the elderly in the Diabetes Registry. However, women have tended to refuse to participate more frequently than men and the sample has 40% women rather than the expected 47%. Israel has a strong family oriented culture, so a major role in grandparenting has been the primary reason of refusal of women to participate in the study. Another limitation is the lack of neuroimaging, which could provide valuable information about the involvement of neurodegenerative and cerebrovascular factors in the relationships of interest. Of note, subjects are to be referred to their physician at the MHS if they develop symptoms of dementia at follow-up, with neuroimaging studies to be performed by the MHS as clinically warranted. With subject permission, MHS will provide the study team with the neuroimaging results.
Results from the IDCD study may have a broad public health impact because its implications may be relevant to conditions preceding T2D, such as the metabolic syndrome. The IDCD study has a data sharing plan for all data, including DNA and serum, and wishes to broaden its collaborations. We see the IDCD study as a core on which several other studies can build upon. Epigenetic and nutritional studies building on this resource have begun.
Research In Context.
Systematic review: We searched PUBMED for literature, starting from the last 5 years. “Type 2 diabetes”, “longitudinal”, “cognition/cognitive decline/Alzheimer's disease/dementia” were the primary keywords.
Interpretation: Type 2 diabetes (T2D) is increasing epidemically in the Western world. T2D has been consistently associated with cognitive decline and dementia, contributing to the accelerating prevalence of dementia in the elderly. However, it is unclear what factors within T2D propel this enhanced risk. Studies using the Israel Diabetes and Cognitive Decline Study infrastructure investigate specific T2D-related characteristics and their patterns over time—reflecting deleterious processes of T2D on the brain—that may affect cognitive decline and dementia.
Future directions: Identification of how T2D-related characteristics and their patterns over time affect cognitive outcomes may lead to interventions manipulating these characteristics to maintain healthy cognition in T2D individuals. Mechanisms underlying these relationships may pertain to cognitive decline in all elerly.
Acknowledgments
This study was supported by National Institute on Aging grants R01 AG034087 (Beeri), P50 AG05138 (Sano), the Ira T. Hirschl Award (Beeri), and by awards from the Helen Bader Foundation (Beeri) and The Leroy Schecter Foundation (Beeri).
References
- 1.Schnaider Beeri M, Goldbourt U, Silverman JM, Noy S, Schmeidler J, Ravona-Springer R, et al. Diabetes mellitus in midlife and the risk of dementia three decades later. Neurology. 2004;63:1902–7. doi: 10.1212/01.wnl.0000144278.79488.dd. [DOI] [PubMed] [Google Scholar]
- 2.Luchsinger JA, Tang MX, Stern Y, Shea S, Mayeux R. Diabetes mellitus and risk of Alzheimer's disease and dementia with stroke in a multiethnic cohort. Am J Epidemiol. 2001;154:635–41. doi: 10.1093/aje/154.7.635. [DOI] [PubMed] [Google Scholar]
- 3.Ott A, Stolk RP, van HF, Pols HA, Hofman A, Breteler MM. Diabetes mellitus and the risk of dementia: The Rotterdam Study. Neurology. 1999;53:1937–42. doi: 10.1212/wnl.53.9.1937. [DOI] [PubMed] [Google Scholar]
- 4.Luchsinger JA, Reitz C, Patel B, Tang MX, Manly JJ, Mayeux R. Relation of diabetes to mild cognitive impairment. Arch Neurol. 2007;64:570–5. doi: 10.1001/archneur.64.4.570. [DOI] [PubMed] [Google Scholar]
- 5.Ravona-Springer R, Luo X, Schmeidler J, Wysocki M, Lesser G, Rapp M, et al. Diabetes is associated with increased rate of cognitive decline in questionably demented elderly. Dement Geriatr Cogn Disord. 2010;29:68–74. doi: 10.1159/000265552. [DOI] [PMC free article] [PubMed] [Google Scholar]
- 6.Hassing LB, Grant MD, Hofer SM, Pedersen NL, Nilsson SE, Berg S, et al. Type 2 diabetes mellitus contributes to cognitive decline in old age: a longitudinal population-based study. J Int Neuropsychol Soc. 2004;10:599–607. doi: 10.1017/S1355617704104165. [DOI] [PubMed] [Google Scholar]
- 7.Arvanitakis Z, Wilson RS, Bienias JL, Evans DA, Bennett DA. Diabetes mellitus and risk of Alzheimer disease and decline in cognitive function. Arch Neurol. 2004;61:661–6. doi: 10.1001/archneur.61.5.661. [DOI] [PubMed] [Google Scholar]
- 8.Janson J, Laedtke T, Parisi JE, O'Brien P, Petersen RC, Butler PC. Increased risk of type 2 diabetes in Alzheimer disease. Diabetes. 2004;53:474–81. doi: 10.2337/diabetes.53.2.474. [DOI] [PubMed] [Google Scholar]
- 9.Panza F, Solfrizzi V, Logroscino G, Maggi S, Santamato A, Seripa D, et al. Current epidemiological approaches to the metabolic-cognitive syndrome. J Alzheimers Dis. 2012;30(Suppl 2):S31–75. doi: 10.3233/JAD-2012-111496. [DOI] [PubMed] [Google Scholar]
- 10.Cukierman T, Gerstein HC, Williamson JD. Cognitive decline and dementia in diabetes-systematic overview of prospective observational studies. Diabetologia. 2005;48:2460–9. doi: 10.1007/s00125-005-0023-4. [DOI] [PubMed] [Google Scholar]
- 11.Allen KV, Frier BM, Strachan MW. The relationship between type 2 diabetes and cognitive dysfunction: longitudinal studies and their methodological limitations. Eur J Pharmacol. 2004;490:169–75. doi: 10.1016/j.ejphar.2004.02.054. [DOI] [PubMed] [Google Scholar]
- 12.Skoog I, Gustafson D. Hypertension, hypertension-clustering factors and Alzheimer's disease. Neurol Res. 2003;25:675–80. doi: 10.1179/016164103101201986. [DOI] [PubMed] [Google Scholar]
- 13.Kalofoutis C, Piperi C, Zisaki A, Singh J, Harris F, Phoenix D, et al. Differences in expression of cardiovascular risk factors among type 2 diabetes mellitus patients of different age. Ann N Y Acad Sci. 2006;1084:166–77. doi: 10.1196/annals.1372.001. [DOI] [PubMed] [Google Scholar]
- 14.Strachan MW, Deary IJ, Ewing FM, Frier BM. Is type II diabetes associated with an increased risk of cognitive dysfunction? A critical review of published studies. Diabetes Care. 1997;20:438–45. doi: 10.2337/diacare.20.3.438. [DOI] [PubMed] [Google Scholar]
- 15.Craft S, Asthana S, Cook DG, Baker LD, Cherrier M, Purganan K, et al. Insulin dose-response effects on memory and plasma amyloid precursor protein in Alzheimer's disease: interactions with apolipoprotein E genotype. Psychoneuroendocrinology. 2003;28:809–22. doi: 10.1016/s0306-4530(02)00087-2. [DOI] [PubMed] [Google Scholar]
- 16.Ravona-Springer R, Moshier E, Schmeidler J, Godbold J, Akrivos J, Rapp M, et al. Changes in glycemic control are associated with changes in cognition in non-diabetic elderly. J Alzheimers Dis. 2012;30:299–309. doi: 10.3233/JAD-2012-120106. [DOI] [PMC free article] [PubMed] [Google Scholar]
- 17.West RK, Ravona-Springer R, Schmeidler J, Leroith D, Koifman K, Guerrero-Berroa E, et al. The association of duration of type 2 diabetes with cognitive performance is modulated by long-term glycemic control. Am J Geriatr Psychiatry. doi: 10.1016/j.jagp.2014.01.010. Epub ahead of print. [DOI] [PMC free article] [PubMed] [Google Scholar]
- 18.Yaffe K, Kanaya A, Lindquist K, Simonsick EM, Harris T, Shorr RI, et al. The metabolic syndrome, inflammation, and risk of cognitive decline. JAMA. 2004;292:2237–42. doi: 10.1001/jama.292.18.2237. [DOI] [PubMed] [Google Scholar]
- 19.deBresser J, Reijmer YD, van den Berg E, Breedijk MA, Kappelle LJ, Viergever MA, et al. Microvascular determinants of cognitive decline and brain volume change in elderly patients with type 2 diabetes. Dement Geriatr Cogn Disord. 2010;30:381–6. doi: 10.1159/000321354. [DOI] [PubMed] [Google Scholar]
- 20.Chodick G, Heymann AD, Shalev V, Kookia E. The epidemiology of diabetes in a large Israeli HMO. Eur J Epidemiol. 2003;18:1143–6. doi: 10.1023/b:ejep.0000006635.36802.c8. [DOI] [PubMed] [Google Scholar]
- 21.Morris JC, Ernesto C, Schafer K, Coats M, Leon S, Sano M, et al. Clinical dementia rating training and reliability in multicenter studies: the Alzheimer's Disease Cooperative Study experience. Neurology. 1997;48:1508–10. doi: 10.1212/wnl.48.6.1508. [DOI] [PubMed] [Google Scholar]
- 22.Winblad B, Palmer K, Kivipelto M, Jelic V, Fratiglioni L, Wahlund LO, et al. Mild cognitive impairment–beyond controversies, towards a consensus: report of the International Working Group on Mild Cognitive Impairment. J Intern Med. 2004;256:240–6. doi: 10.1111/j.1365-2796.2004.01380.x. [DOI] [PubMed] [Google Scholar]
- 23.McKhann G, Drachman D, Folstein M, Katzman R, Price D, Stadlan EM. Clinical diagnosis of Alzheimer's disease: report of the NINCDS-ADRDA Work Group under the auspices of Department of Health and Human Services Task Force on Alzheimer's Disease. Neurology. 1984;34:939–44. doi: 10.1212/wnl.34.7.939. [DOI] [PubMed] [Google Scholar]
- 24.Román GC, Tatemichi TK, Erkinjuntti T, Cummings JL, Masdeu JC, Garcia JH, et al. Vascular dementia: diagnostic criteria for research studies. Report of the NINDS-AIREN International Workshop. Neurology. 1993;43:250–60. doi: 10.1212/wnl.43.2.250. [DOI] [PubMed] [Google Scholar]
- 25.Langston JW, Widner H, Goetz CG, Brooks D, Fahn S, Freeman T, et al. Core assessment program for intracerebral transplantations (CAPIT) Mov Disord. 1992;7:2–13. doi: 10.1002/mds.870070103. [DOI] [PubMed] [Google Scholar]
- 26.McKeith IG, Galasko D, Kosaka K, Perry EK, Dickson DW, Hansen LA, et al. Consensus guidelines for the clinical and pathologic diagnosis of dementia with Lewy bodies (DLB): report of the consortium on DLB international workshop. Neurology. 1996;47:1113–24. doi: 10.1212/wnl.47.5.1113. [DOI] [PubMed] [Google Scholar]
- 27.Shalev V, Chodick G, Goren I, Silber H, Kokia E, Heymann AD. The use of an automated patient registry to manage and monitor cardiovascular conditions and related outcomes in a large health organization. Int J Cardiol. 2011;152:345–9. doi: 10.1016/j.ijcard.2010.08.002. [DOI] [PubMed] [Google Scholar]
- 28.Shinar D, Gross CR, Bronstein KS, Licata-Gehr EE, Eden DT, Cabrera AR, et al. Reliability of the activities of daily living scale and its use in telephone interview. Arch Phys Med Rehabil. 1987;68:723–8. [PubMed] [Google Scholar]
- 29.Graf C. The Lawton instrumental activities of daily living scale. Am J Nurs. 2008;108:52–62. doi: 10.1097/01.NAJ.0000314810.46029.74. [DOI] [PubMed] [Google Scholar]
- 30.Fried LP, Tangen CM, Walston J, Newman AB, Hirsch C, Gottdiener J, et al. Frailty in older adults: evidence for a phenotype. J Gerontol A Biol Sci Med Sci. 2001;56:M146–56. doi: 10.1093/gerona/56.3.m146. [DOI] [PubMed] [Google Scholar]
- 31.Folstein MF, Folstein SE, McHugh PR. “Mini-mental state”. A practical method for grading the cognitive state of patients for the clinician. J Psychiatr Res. 1975;12:189–98. doi: 10.1016/0022-3956(75)90026-6. [DOI] [PubMed] [Google Scholar]
- 32.Yesavage JA. Geriatric Depression Scale. Psychopharmacol Bull. 1988;24:709–11. [PubMed] [Google Scholar]
- 33.Cummings JL, Mega M, Gray K, Rosenberg-Thompson S, Carusi DA, Gornbein J. The Neuropsychiatric Inventory: comprehensive assessment of psychopathology in dementia. Neurology. 1994;44:2308–14. doi: 10.1212/wnl.44.12.2308. [DOI] [PubMed] [Google Scholar]
- 34.Bruins P, te Velthuis H, Yazdanbakhsh AP, Jansen PG, van Hardevelt FW, de Beaumont EM, et al. Activation of the complement system during and after cardiopulmonary bypass surgery: postsurgery activation involves C-reactive protein and is associated with postoperative arrhythmia. Circulation. 1997;96:3542–8. doi: 10.1161/01.cir.96.10.3542. [DOI] [PubMed] [Google Scholar]
- 35.Cohen SB, Wattiez A, Stockheim D, Seidman DS, Lidor AL, Mashiach S, et al. The accuracy of serum interleukin-6 and tumour necrosis factor as markers for ovarian torsion. Hum Reprod. 2001;16:2195–7. doi: 10.1093/humrep/16.10.2195. [DOI] [PubMed] [Google Scholar]
- 36.Marin DB, Flynn S, Mare M, Lantz M, Hsu MA, Laurans M, et al. Reliability and validity of a chronic care facility adaptation of the Clinical Dementia Rating scale. Int J Geriatr Psychiatry. 2001;16:745–50. doi: 10.1002/gps.385. [DOI] [PubMed] [Google Scholar]
- 37.Fitzmaurice GM, Laird NM, Ware JH. Applied longitudinal analysis. New York: Wiley Interscience; 2004. [Google Scholar]
- 38.Twisk J, Rijmen F. Longitudinal TOBIT regression: a new approach to analyze outcome variables with floor or ceiling effects. J Clin Epidemiol. 2009;62:953–8. doi: 10.1016/j.jclinepi.2008.10.003. [DOI] [PubMed] [Google Scholar]
- 39.Schulz LO, Bennett PH, Ravussin E, Kidd JR, Kidd KK, Esparza J, et al. Effects of traditional and western environments on prevalence of type 2 diabetes in Pima Indians in Mexico and the U.S. Diabetes Care. 2006;29:1866–71. doi: 10.2337/dc06-0138. [DOI] [PubMed] [Google Scholar]
- 40.Klein BE, Klein R, Moss SE. Self-rated health and diabetes of long duration. The Wisconsin Epidemiologic Study of Diabetic Retinopathy. Diabetes Care. 1998;21:236–40. doi: 10.2337/diacare.21.2.236. [DOI] [PubMed] [Google Scholar]
- 41.Carey VJ, Walters EE, Colditz GA, Solomon CG, Willett WC, Rosner BA, et al. Body fat distribution and risk of non-insulin-dependent diabetes mellitus in women. The Nurses' Health Study. Am J Epidemiol. 1997;145:614–9. doi: 10.1093/oxfordjournals.aje.a009158. [DOI] [PubMed] [Google Scholar]
- 42.Whitmer RA, Karter AJ, Yaffe K, Quesenberry CP, Jr, Selby JV. Hypoglycemic episodes and risk of dementia in older patients with type 2 diabetes mellitus. JAMA. 2009;301:1565–72. doi: 10.1001/jama.2009.460. [DOI] [PMC free article] [PubMed] [Google Scholar]
- 43.Aung PP, Strachan MW, Frier BM, Butcher I, Deary IJ, Price JF. Severe hypoglycaemia and late-life cognitive ability in older people with Type 2 diabetes: the Edinburgh Type 2 Diabetes Study. Diabet Med. 2012;29:328–36. doi: 10.1111/j.1464-5491.2011.03505.x. [DOI] [PubMed] [Google Scholar]
- 44.ACCORD Study Group. Gerstein HC, Miller ME, Genuth S, Ismail-Beigi F, Buse JB, et al. Long-term effects of intensive glucose lowering on cardiovascular outcomes. N Engl J Med. 2011;364:818–28. doi: 10.1056/NEJMoa1006524. [DOI] [PMC free article] [PubMed] [Google Scholar]
- 45.Launer LJ, Miller ME, Williamson JD, Lazar RM, Gerstein HC, Murray AM, et al. Effects of intensive glucose lowering on brain structure and function in people with type 2 diabetes (ACCORD MIND): a randomised open-label substudy. Lancet Neurol. 2011;10:969–77. doi: 10.1016/S1474-4422(11)70188-0. [DOI] [PMC free article] [PubMed] [Google Scholar]