

Abstract
Eribulin mesylate was developed as a potent microtubule-targeting cytotoxic agent to treat taxane-resistant cancers, but recent clinical trials have shown that it eventually fails in many patient sub-populations for unclear reasons. To investigate its resistance mechanisms, we developed a fluorescent analog of eribulin with pharmacokinetic (PK) properties and cytotoxic activity across a human cell line panel that are sufficiently similar to the parent drug to study its cellular PK and tissue distribution. Using intravital imaging and automated tracking of cellular dynamics, we found that resistance to eribulin and the fluorescent analog depended directly on the multidrug resistance protein 1 (MDR1). Intravital imaging allowed for real-time analysis of in vivo pharmacokinetics in tumors that were engineered to be spatially heterogeneous for taxane resistance, whereby an MDR1-mApple fusion protein distinguished resistant cells fluorescently. In vivo, MDR1-mediated drug efflux and the three-dimensional tumor vascular architecture were discovered to be critical determinants of drug accumulation in tumor cells. We furthermore show that standard intravenous administration of a third-generation MDR1 inhibitor, HM30181, failed to rescue drug accumulation; however, the same MDR1 inhibitor encapsulated within a nanoparticle delivery system reversed the multidrug-resistant phenotype and potentiated the eribulin effect in vitro and in vivo in mice. Our work demonstrates that in vivo assessment of cellular PK of an anticancer drug is a powerful strategy for elucidating mechanisms of drug resistance in heterogeneous tumors and evaluating strategies to overcome this resistance.
Introduction
Paclitaxel (taxol, abraxane) and docetaxel (taxotere) have become front-line therapies for a variety of metastatic cancers especially of breast, ovarian, and prostate cancer origin. Unfortunately, many patients eventually develop resistance, and simple dose escalation is not an option given ensuing toxicities. Interestingly, these cancers become refractory to a broad spectrum of structurally unrelated compounds. Resistance to such microtubule inhibitors is complex, and likely involves both pharmacokinetic (PK) effects and down-regulation of apoptosis pathways. The best characterized resistance mechanism in cell culture is increased drug efflux mediated by the multidrug resistant 1 protein (MDR1), also known as p-glycoprotein (P-gp), although the clinical relevance of this mechanism has yet to be firmly established (1–6).
Eribulin mesylate (Halaven) is an emerging microtubule inhibitor that is FDA-approved for advanced metastatic breast cancers that have been heavily pre-treated with at least a taxane and anthracycline (7). Treatment with eribulin led to increased median overall survival in certain patient subgroups compared to the physician's treatment of choice in Phase III clinical trials (13.1 vs. 10.6 months) (8), including a subset of patients who had been on a drug holiday for six months or longer (9). However, when assessed by independent review, the median progression-free survival was not significant, and sustained disease control was marginal (10). There are insufficient data about which patient subgroups might preferentially benefit from eribulin and common resistance mechanisms that might be shared between eribulin and prior therapies. This paucity of information stems in part from an inability to interrogate the in vivo distribution, cellular accumulation, and efflux of eribulin in cancer cells, either those untreated or those previously treated with taxanes. Furthermore, there is limited mechanistic in vivo knowledge regarding the optimal scenarios for eribulin treatment and how its efficacy could be potentiated.
To better understand the role of MDR1 in the clinical presentation of multidrug resistance, particularly to microtubule modulators, we set out to investigate the in vivo cellular accumulation of eribulin in heterogeneous tumors. We used a fluorescent eribulin analog to quantitate its tissue distribution and tumoral kinetics at the single cell and population levels. We reasoned that such data could be used to elucidate the mechanism of clinical failure in certain patients. Eribulin features a free amino group at the C35 position, which can be synthetically modified without abrogating its microtubule-binding and destabilizing activity (11). We took advantage of this fact and synthesized a fluorescent derivative based on covalent modification of the eribulin scaffold with a boron-dipyrromethene (BODIPY FL; BFL), to directly analyze its cellular pharmacokinetics in multiple cancer types in vitro and in naïve and taxane-resistant tumors in vivo, distinguished by fluorescent expression of the MDR1-mApple fusion protein. In this study we show that the bioactivity and PK properties of eribulin-BFL are relevant to the parent compound, and MDR1 over-expression confers resistance to both. We hypothesized that mathematical analysis of image data sets would further shed light on key sources of heterogeneity in cellular-level drug dynamics and thus allow for investigation of other efficacy parameters, such as distance to micro-vessels, expression of efflux transporters, or co-administration with other drugs.
One strategy for modulating taxane resistance is co-treatment with inhibitors of the MDR1 drug efflux pump. Early clinical shortcomings of MDR1 inhibitors have largely been attributed to non-specific action and/or non-selective distribution of inhibitor to target organs, leading to unacceptable systemic side effects (12). Consequently, second-generation MDR1 inhibitors with lower toxicity were developed; however, most showed limited efficacy in human trials (13). Hence, we investigated preclinically a third-generation MDR1 inhibitor, HM30181, currently in Phase I clinical trials (14–16). This compound is a structural analog of tariquidar and had demonstrated favorable potency (17). When we tested this compound in vivo we observed modest effects, which were subsequently shown to be related to inefficient tumor delivery. To overcome this, we designed a nanoparticle delivery system for enhanced tumoral delivery of the MDR1inhibitor.
These quantitative, imaging-based studies elucidate not only the cellular kinetics of an investigational microtubule stabilizer, eribulin, in vitro and in vivo, but also demonstrate how lessons learned at the single-cell level can reveal bioengineering strategies to potentiate drug effects. This platform approach to studying drug effects at the single-cell level may have broad application in understanding drug actions and mechanisms of resistance in vivo and, in turn, for designing better drugs and smarter trials.
Results
Eribulin uptake and relationship to MDR1 in human cancer cells in vitro
Synthesis and characterization of the eribulin-BFL conjugate are detailed in figs. S1 and S2, respectively. This analog (Fig. 1A) retained its anticancer efficacy in vitro (Fig. 1B) and the fluorescent BFL tag did not impede cellular uptake (Fig. 1C). Imaging studies showed that eribulin-BFL, like its parent molecule, arrested human tumor cells in mitosis and variably disassembled microtubules (fig. S3), consistent with prior literature data using the unmodified drug (18, 19). Strikingly, when the same cells express the MDR1-Apple fusion protein, the microtubule networks and cell division are protected (fig. S3). Furthermore, treatment with both eribulin and eribulin-BFL led to the phenotype whereby microtubule disassembly was observed in wild type cells, but not in MDR1-expressing cells. Thus, the cellular mechanism of action of eribulin-BFL reflected that of the parent eribulin.
Fig. 1. Eribulin-BFL accumulation phenotype observed in native and taxol-resistant cells.
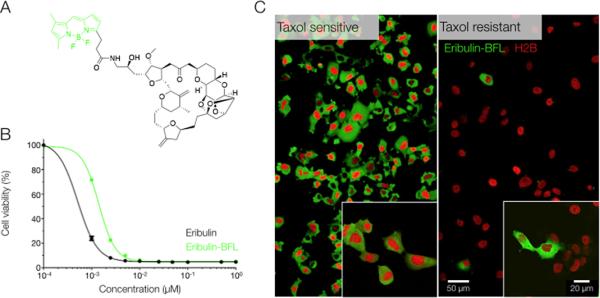
(A) Structure of fluorescent eribulin-BFL (green shows BODIPY fluorescent tag). Synthesis is described in fig. S1. (B) The fluorescent eribulin analog, eribulin-BFL, retained an anticancer efficacy in HT1080 cells in vitro, comparable to the unlabeled compound. Data were measured in triplicate at escalating drug concentrations. (C) The fluorescent BODIPY tag did not impede drug uptake in wild type (taxane-sensitive) HT1080 cells in vitro. In contrast, sporadic accumulation of eribulin-BFL was observed in taxol-resistant HT1080 cells. Images were acquired at identical exposure settings.
Initially, we characterized drug uptake in wild type and resistant cell populations when incubated with 50 nM of eribulin-BFL. The resistant population was derived to mimic the clinical presentation of taxane-refractory tumors by over-expressing the MDR1 protein and selecting cells for survival in increasing concentrations of taxol. Disparate phenotypes in drug accumulation were observed between these subgroups: a uniform and cytoplasmic distribution of eribulin-BFL was observed in wild type cells, but negligible to sporadic accumulation was observed in the taxane-refractory population (Fig. 1C). Substrate accumulation after eribulin-BFL incubation was subsequently quantified in thousands of single cells to verify that eribulin-BFL was indeed an avid substrate of MDR1, while the BFL fluorophore alone was not (fig. S4).
To test whether these observations held true in other cancer cell lines, we analyzed variability in eribulin cytotoxicity (unlabeled parent compound) and eribulin-BFL accumulation across several human cancer types, including breast (two derived from metastases to the lungs), ovarian, pancreatic, and fibrosarcoma tumor cell lines (Fig. 2, A and B), that differed in their sensitivities to taxanes and eribulin. Toxicity profiles were assayed by determining population cell viability in response to a 12-h pulse of eribulin and assayed at 72 h. Drug accumulation in 12 human cancer cell types was measured by flow cytometry and demonstrated a correlation between relative eribulin-BFL accumulation and cytotoxic efficacy [defined as the inverse of the half maximal efficacy concentration (IC50) of unlabeled eribulin] (Fig. 2C). IC50 values for eribulin ranged from sub-nanomolar to micromolar across the cell types (Fig. 2D). Furthermore, there was a correlation between variability in the surviving fraction of cells following eribulin treatment (Fig. 2E) and MDR1 expression levels (Fig. 2F).
Fig. 2. Heterogeneous eribulin uptake and toxicity across human cancer cell lines.
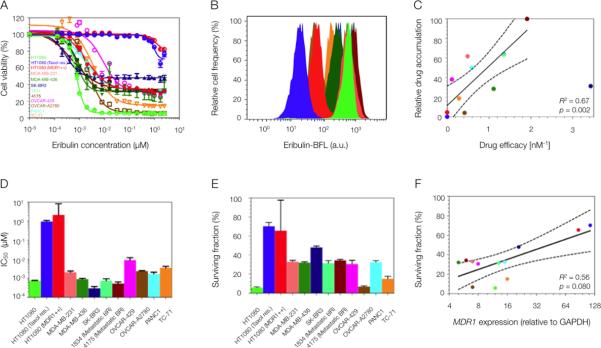
(A and B) Variable eribulin (unlabeled parent compound) cytotoxicity (A) and eribulin-BFL uptake (B) profiles across a human cell line panel, including breast (MDA-MB-231, MDA-MB-436, SK-BR3, 1834, 4175), ovarian (OVCAR-429 and A2780), pancreatic (PANC1), Ewing's scaroma (TC-71) and fibrosarcoma (HT1080: wild type, taxol resistant, and MDR1-expressing). Two human breast cancer lines were derived from metastases to the lung, 1834 and 4175. (C) Linear regression of eribulin-BFL accumulation (min-max normalized) and unlabeled eribulin efficacy, here defined as the inverse of its cellular IC50. Solid lines represent regression best-fit lines and dotted lines represent associated 95% confidence bands. Each data point represents the average of triplicate experiments; where mean drug accumulation was analyzed in 10,000 cells per experiment. (D and E) Heterogeneity in half maximal inhibitory concentration, IC50 (D), and in the surviving fraction of cells (E) in response to eribulin treatment. Data are means ± SEM (n=3). (F) Nonlinear regression of MDR1 protein expression and surviving cell fraction. MDR1 protein expression was normalized to GAPDH. Each data point represents the average of triplicate experiments. Solid lines represent regression best-fit lines and dotted lines represent associated 95% confidence bands. P values for the regression analyses in (C and F) were determined by the Student's t distribution.
System to quantify eribulin PK in wild type and resistant subpopulations in vivo
We engineered a mosaic, resistant human cancer xenograft model with heterogeneous expression of the MDR1-mApple fusion protein. Expression of this fusion protein was validated by Western blot (fig. S5). Patterning resistant cells in this way enabled quantification of cellular drug accumulation in wild type and resistant MDR1-expressing cells in parallel in the same tumor environment (Fig. 3A). This paradigm mimicked the genetic and epigenetic heterogeneity of real tumors and allowed for comparison of uptake into resistant and sensitive cells matched exactly for drug exposure. However, it exluded differential analysis of other transporters, such as MRP7/ABCC10, which does not play a role for eribulin (fig. S6). All human cells were also stably transfected with a histone fused to a near-infrared fluorescent protein (H2B-iRFP) to facilitate automated cell tracking by in vivo imaging. Using this system, we demonstrated that MDR1 expression alone is sufficient to impede cellular eribulin accumulation (Fig. 3A). Furthermore, MDR1-expressing cells were highly proliferative in the presence of the microtubule-modulating drug (fig. S7A) and its fluorescent derivative (fig. S7B) in vitro, demonstrating that MDR1 over-expression confers resistance to both.
Fig. 3. System to quantify the in vivo pharmacokinetics of eribulin resistance using a fluorescent analog.
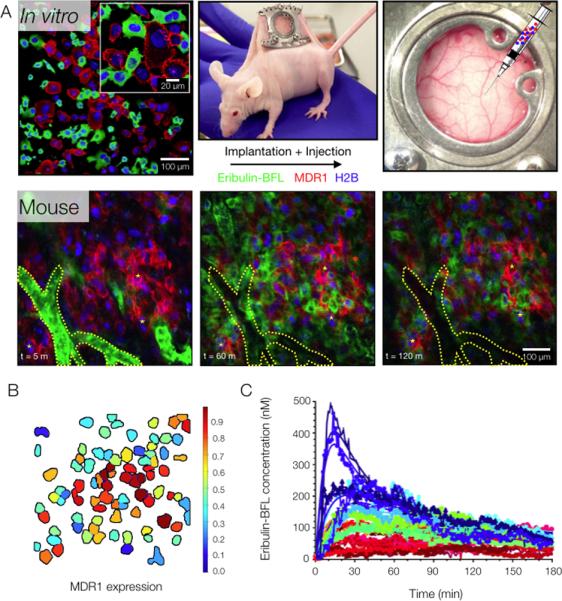
(A) The partially (mosaic) taxane-resistant HT1080 tumor model engineered to heterogeneously express the MDR1-mApple fusion protein and uniformly express the fluorescent histone fusion protein (H2B-iRFP), was implanted subcutaneously in a mouse window chamber. The kinetics of eribulin-BFL tumor cell uptake were imaged intravitally, typically over the course of 2 hours. A segmented vessel and fiducial markers are outlined in yellow for visual co-registration between frames. Images are representative of 3 mice. (B) Unique cell objects identified by the automated segmentation algorithm are outlined and labeled with a color indicating their relative expression of the MDR1 protein. (C) Drug accumulation and efflux curves for 32 cells produced by the automated tracking algorithm, reporting mean cellular drug accumulation (single cells indicated by color) as a function of time. Curves indicated best-fit lines when fitting data to analytical model of drug diffusion and efflux.
The in vivo tumoral kinetics of the eribulin analog were then quantified in wild type and taxane-refractory human cancer cells by longitudinally tracing its distribution in the mosaic tumor model grown in a mouse window chamber (Fig. 3A). Time-lapse intravital microscopy was initiated prior to intravenous administration of the eribulin analog to capture its early dissemination from the vascular compartment. The segmentation system developed to track individual cells in vivo facilitated quantification of relative MDR1 protein expression (Fig. 3B) and drug accumulation dynamics in single cells over the course of 3 hours (Fig. 3C). This allowed direct comparison of eribulin-BFL PKs in wild type and resistant human cancer cells, both at the single cell (Fig. 4, A and B) and cell population (Fig. 4C) levels.
Fig. 4. Single cell and population pharmacokinetics of wild type and resistant tumor subpopulations in vivo.
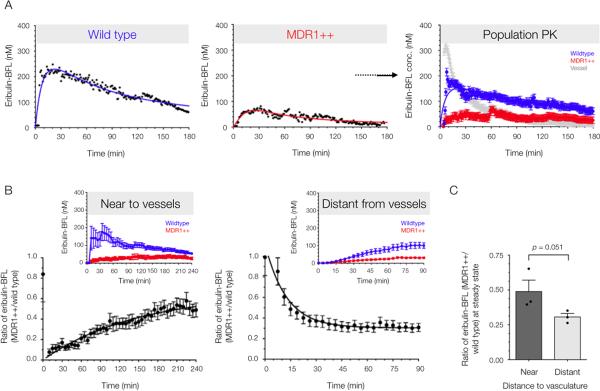
(A) Experimental data and analytical modeling of eribulin-BFL PK in wild-type and resistant (MDR1++) single cells, and in mixed populations of both wild-type and resistant cells. Resistant cells are defined as those fluorescently expressing MDR1-mApple. The vascular concentration shows drug concentration increase and loss within a segmented tumor vessel. Data are means ± SEM (n = 37 cells, trace from 1 mouse) with solid lines representing best-fit curves. Images were analyzed using automated cell segmentation and tracking algorithms. All cells were identified by the histone H2B-iRFP fusion protein, and the resistant subpopulation was identified by MDR1-mApple fluorescence. (B) The relative drug accumulation in resistant cells as compared to their wild type counterparts (ratio of means ± SEM, n = 3 mice) in a highly vascularized tumor, with a vessel in the imaging field and distant from detectable tumor vasculature, as determined by 3-dimensional imaging stack. Population pharmacokinetics near (< 200 μm) and far (> 200 μm) from vessels are displayed in the image insets from representative mice. (C) Relative eribulin-BFL accumulation in MDR1-expressing cells at steady state was quantified by the fit plateau of a one phase association (near to vessels) or decay (far from vessels). Data are mean ratios ± SEM, as well as individual animals (n = 6 independent time lapse z-stacks acquired in three mice). P value determined by a one-tailed t-test assuming equal SD.
At the systemic level, intravenously administered eribulin-BFL was characterized by a 52% re-distribution within a 4 min half-life, and a 48% clearance phase of 30 min, from normal vasculature into surrounding tissue (fig. S7). In vivo cellular PKs in wild type and resistant single cells were fit using non-linear regression to an analytical model describing bi-directional diffusion and site specific efflux out of the cell (fig. S9A). The single-cell efflux coefficient increased with a power dependence on MDR1 expression; an inverse relationship was observed between maximum cellular drug concentration and MDR1 expression level, measured fluorescently by the MDR1-mApple fusion protein (fig. S9B). Drug accumulation is not completely negligible in MDR1-expressing cells in part due to in vivo imaging artifacts (weak tissue autofluorescence), and in part owing to other unidentified mechanisms of resistance.
Relative eribulin-BFL accumulation in resistant versus wild type human cancer cells (ratio of the cell population means ± SEM) was quantified in a highly perfused tumor with a vessel in the imaging field (Fig. 4D), and distant from detectable tumor vasculature, as determined by 3-dimensional imaging stacks (Fig. 4E). Immediately after its administration, cellular drug accumulation differed between wild type and resistant cells near to vessels, but after non-specific washout of the unbound drug, resistant cells eventually accumulated nearly 50% less drug relative to wild type cells in the same microenvironment. A one-phase association was used to describe the time-dependent ratio measure of resistant drug kinetics.
Conversely, in an imaging field with no detectable vessels in its proximity, eribulin-BFL accumulation in both cell populations at early time points was limited by the diffusion barrier to drug delivery. In this scenario, a one-phase decay described the ratio measure of resistant drug accumulation. The ratio measure normalizes for cellular distance from the drug source. Interestingly, the mean relative drug accumulation in resistant cells near to tumor vessels was greater than that far from tumor vessels at steady state (~20% enhanced drug loss far from vessel) (P = 0.051 according to a one-sided unpaired t-test, assuming equal SD), suggesting that MDR1-expressing cells have an efflux advantage away from vessels. Relative eribulin-BFL concentrations at steady state were parameterized by the asymptote of the one-phase association or decay, analyzed in 6 independent z-stacks that were longitudinally monitored in three mice.
Cellular inhibition of MDR1: in vitro and in vivo disparity
Up-regulation of MDR1 is a common cause of chemotherapy resistance, at least in animal models. Unfortunately, clinical trials examining the efficacy of MDR1 inhibitors have largely yielded negligible outcomes. To address this discrepancy, we assayed eribulin-BFL uptake and cytotoxicity when co-administered with potential MDR1 inhibitors using our mosaic, resistant cancer model (fig. S10). We chose to further test a third-generation MDR1 inhibitor, HM30181 (Hanmi Pharm. Co.), because of promising Phase 1 data (16). Independently, HM30181 did not affect viability of the wild type tumor cell line in vitro (fig. S11A). However, co-administration of HM30181 with unlabeled eribulin restored eribulin's bioactivity in MDR1-expressing, resistant HT1080 cells (Fig. 5, A and C) and negligibly affected proliferation in wild type tumor cell lines (Fig. 5, B). Likewise, accumulation of the eribulin-BFL analog in MDR1-expressing cells increased with HM30181 co-administration in a dose-dependent manner (Fig. 5D). MDR1-expressing cells incubated with 50 nM eribulin-BFL for one hour did not accumulate drug in the absence of HM30181 (Fig. 5E). However, co-incubation with 250 nM HM30181 allowed for drug uptake (Fig. 5F).
Fig. 5. Reversal of MDR1-mediated drug resistance in vitro using the experimental MDR1 inhibitor, HM30181.

(A) A third-generation MDR1 inhibitor, HM30181 (16), restored sensitivity to eribulin in a dose-dependent manner in vitro in HT1080 cells over-expressing MDR1. (B) HM30181 does not alter the cytotoxicity of eribulin in the drug-sensitive parent cell line, HT1080 (human fibrosarcoma). (C) Sensitivity of resistant and wild-type HT1080 cells to eribulin in the presence of HM30181. Data in (A to C) are reported as averages of triplicate experiments. (D) Cellular eribulin-BFL uptake in resistant (MDR1++) and wild-type cells in response to increasing concentrations of HM30181. Single-cell levels of fluorescence drug were determined by confocal microscopy, where all images were analyzed at same exposure settings. Per-cell count was determined using the DRAQ5 nuclear label. Data are means ± SEM (an average of n = 38 cells evaluated per condition). (E) Eribulin-BFL is not taken up by MDR1-expressing cells (white arrows) in a mixed population of HT1080 cells. However, incubating resistant cells with HM30181 allowed eribulin influx (white arrows). (For the effects of other MDR1 inhibitors, see fig. S10.) Images were acquired at identical exposure settings. The nuclear stain is DRAQ5. Images are representative of n = 5 FOV.
The resistant tumor model was then subcutaneously implanted in the dorsal skinfold window chamber of nu/nu mice to assess reversal of MDR1-mediated drug efflux (i.e., eribulin-BFL accumulation) by the inhibitor in vivo.To directly test the pharmacological effects of the inhibitor itself, HM30181 was topically applied to the tumor surface by removing the window chamber coverslip. Topical delivery of HM30181 restored eribulin-BFL accumulation in resistant cells (Fig. 6A) and significantly increased relative drug accumulation in the resistant subpopulation of single cells (Fig. 6B). A 3-fold increase in eribulin-BFL accumulation was observed in resistant cell subpopulations expressing MDR1 with topical co-administration of HM30181, evaluated in three mice (Fig. 6C). This was less than the absolute fold increase observed in resistant subpopulations in vitro (Fig. 5D), in part owing to the detection limits and low levels of tissue auto-fluorescence observed in vivo, but nonetheless indicating that inhibitor activity in vivo was not a limiting factor.
Fig. 6. Reversal of MDR1-mediated drug efflux in vivo with topical application of the MDR1 inhibitor, HM30181, to heterogeneous tumors.
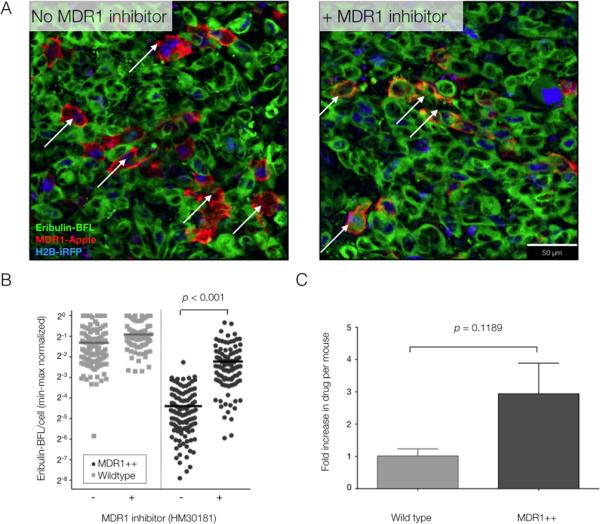
(A) Eribulin-BFL accumulation in heterogeneous tumors containing MDR1-expressing cells (arrows), with and without topical administration of HM30181 directly to the tumor site. Images are representative of 3 mice. (B) Single-cell quantification of eribulin-BFL accumulation in wild type and resistant single cells, with or without HM30181 (min-max normalized per frame). Horizontal lines indicate median uptake per unit area and all individual data points are shown; an average of 103 cells were analyzed per group. (C) Relative drug increase in wild type and MDR1-expressing (resistant) cells with topical application of HM30181. Data are the ratio of median drug accumulation per cell type before and after topical application of HM30181 in n = 3 mice. All P values determined according to a two-sided unpaired t-test, assuming equal SD.
Subsequently, inhibitor efficacy was assayed when intravenously (IV) co-administered with drug. HM30181 was not very water-soluble at physiological pH (7.4) and repeat dosing at 10 mg/kg (using different co-solvent formulations such as solutol and PEG400) we observed to be poorly tolerated in mice (sickly looking animals). Despite repeated injection of the solubilized HM30181, no reversal of MDR1-mediated drug efflux were detectable by imaging (IV delivery of inhibitor, Fig. 7), which was discordant with its activity observed in vitro (Fig. 5; fig. S10). Therefore, delivery was likely the factor limiting MDR1 inhibitor efficacy.
Fig. 7. Nanotherapeutic strategy for reversing MDR1-mediated drug resistance in vivo.

(A) Schematic and characterization of the PLGA-PEG-BODIPY-630 nanoparticles used to encapsulate the MDR1 inhibitor, HM30181. The particles were 76 ± 7 nm (average weighted by volume ± SD across 6 synthesis batches). (B) Release of inhibitor from nanoparticles in saline at 37°C. Data are means ± 95% confidence intervals for duplicate measurements. (C) Vascular half-life (t1/2) following rapid clearance from the tumor vasculature into surrounding tissue. Data are means +/− SEM (n = 5 vessels). (D) Eribulin-BFL accumulation in MDR1-expressing HT1080 cells in vivo without HM30181 or with daily pre-injections of HM30181, in standard solution phase vehicles or nano-encapsulated. Images are representative of 3 mice. (E) Inhibitor efficacy was a function of delivery method. The fraction of wild-type (blue) or resistant (red) cells accumulating drug was quantified for each delivery method according to the cellular frequency of eribulin-BFL concentration in MDR1-expressing cells within 1.96 SD of the mean native drug accumulation. Data are mean cellular frequencies ± SEM per imaging frame (an average of n = 300 MDR1-expressing cells evaluated per delivery method). P values were determined by one-way ANOVA using Tukey's multiple comparison test.
Therapeutic strategy for reversing MDR1-mediated drug resistance in vivo
To solve delivery issues and to slowly release MDR1 inhibitor into tumors over time, we encapsulated HM30181 into 76 ± 7 nm (average particle size weighted by volume ± SD across 6 synthesis batches) poly(D,L-lactic-co-glycolic acid)-b-poly(ethylene glycol) (PLGA-PEG) copolymer nanoparticles with a polydispersity index (PDI) of 0.28 ± 0.05 (SD across 6 synthesis batches) (Fig. 7A). A similar approach has been established for other drugs and we therefore followed the published protocols for nanoparticle precipitation, filtering, concentration and characterization (20, 21). The particles were labeled with a BODIPY dye that emits in the near infrared channel (PLGA-B630). The MDR1 inhibitor was nano-encapsulated with an average efficiency of ~30% and for each batch, drug loading was characterized by absorbance using a standard curve.
The half-life of MDR1 inhibitor release in saline at 37°C was between 9-10 hours; the majority of inhibitor was released after 48 h (Fig. 7B). No toxicity was observed for the carrier itself (fig. S11A) and enhanced killing was observed in resistant cells when the inhibitor was delivered via nanoparticles as compared to standard solution-phase vehicles (fig. S11B). The circulatory half-life of the nano-encapsulated MDR1 inhibitor in mice was nearly 2 hours, as determined by PLGA-B630 fluorescence in multiple tumor vessels in vivo (Fig. 7C). However, the nanoparticles maintained localization in host cells (endothelial cells, tumor-associated macrophages) and tumor cells at 24 and 48 hours (fig. S11C).
Nanoparticles were intravenously administered daily for one week (11 mg/kg of HM30181) subsequent to a single intravenous dose of eribulin-BFL (3.8 mg/mL) in nu/nu mice (n = 3). Using this strategy, eribulin-BFL accumulation was restored in >60% of resistant cells in vivo (Fig. 7, D and E). For comparison, <10% of resistant cells accumulated eribulin-BFL when pretreated with non-encapsulated inhibitor or no inhibitor (Fig. 7, D and E). Single-cell variability in inhibitor response likely reflects heterogeneity in the tissue distribution of nanoparticles and the tumor microenvironment (distance from micro-vasculature).
Discussion
Eribulin mesylate is a potent microtubule-targeting agent, but has demonstrated limited efficacy in subgroups of patients with metastatic cancer. Although it was developed to treat taxane-refractory disease, it shares a potential resistance mechanism with taxanes via MDR1-mediated drug efflux. However, the role of MDR1 in eribulin resistance has not been systematically evaluated in the context of heterogeneous tumors. Here, we synthesized a fluorescent eribulin analog (eribulin-BFL) with anticancer efficacy and PK properties comparable to its parent compound to quantitatively investigate its in vivo pharmacokinetics, at the single cell level, in a resistant human cancer model characterized by heterogeneous expression of the MDR1 protein. Single-cell resolution is fundamental to understanding altered pharmacokinetics in multidrug resistant tumors, which are hypothesized to clonally expand from a rare subset of cells selected under therapeutic pressure because of some fitness advantage (22).
Intravital imaging of eribulin-BFL transport in mice enabled PK comparison between these functionally divergent subpopulations matched exactly for drug exposure. Drug uptake, efflux, and retention were analyzed in individual cells as a function of MDR1 expression and position relative to the vasculature. MDR1-expressing cells demonstrated reduced eribulin accumulation and a survival advantage over their wild-type counterparts. When this analysis was extended in vivo, MDR1-mediated drug efflux was enhanced at a distance from the tumor vasculature. This finding supports the body of evidence suggesting that the MDR1 gene is hypoxia-responsive (23–29) and suggests that anti-angiogenic therapies may intensify the resistance phenotype conferred by MDR1.
The failure of many MDR1 inhibitors to clinically translate (30) has not yet been systematically evaluated in vivo at the single-cell level. Here, mathematical modeling of imaging data was used to explore the modulation of MDR1-mediated efflux dynamics, with the purpose of not only understanding PK variability, but also for investigating new therapeutic strategies in resistant cancer cells. We show that delivery was the main factor limiting efficacy of an MDR1 inhibitor, HM30181, in vivo, which may help explain its current limitations in the clinic, as well as the clinical failure of many of its structural analogs (30).
To solve the in vivo delivery issue and potentiate eribulin efficacy in resistant tumors, we engineered a nanoparticle system to encapsulate the MDR1 inhibitor. Particles demonstrated sustained localization in both host and tumor cells, enhancing tissue retention and biodegradation of nanoparticles. The nanoparticles enhanced the efficacy of the MDR1 inhibitor, conceivably by reducing off-target toxicities, such as dose-limiting toxicity at blood-brain barrier (31), while increasing inhibitor loading concentrations in the tumor. Owing to poor aqueous solubility, most MDR1 inhibitors have been administered orally as salts. This strategy has been shown to increase the systemic bioavailability, but not tumor-specific accumulation of drug (16), likely owing to high endogenous P-glycoprotein expression in the gut. Our nanoparticle-based delivery system was administered intravenously to bypass MDR1 inhibitor build-up in the gut, in order to improve its systemic availability and, consequently, overall tumor exposure. The developed particle size (< 100 nm) has demonstrated a pharmacokinetic advantage, exploiting vessel permeability while avoiding rapid renal clearance and immune cell phagocytosis (32, 33). This nano-encapsulation strategy is one example of improving P-glycoprotein inhibitor bioavailability and tumor-specific uptake, which may readily translate to co-administered with other common therapies that are know to be P-glycoprotein substrates (taxanes, anthracyclines). Clinical translation of the encapsulated inhibitor to human applications will require advanced tolerability studies in mice and subsequently humans.
Our studies highlight two alternative approaches for imaging drug-PK and the power of orthogonally visualizing the therapeutic activity co-administered agents. Eribulin was detected using a fluorescent analog, eribulin-BFL, which is a direct drug-fluorophore conjugate. It is important for this strategy that the analog match the parent as closely as possible in terms of bioactivity and PK properties. An advantage of this strategy, which was critical for our study, is that the drug itself can be visualized within single cells, thereby allowing quantitation of cellular retention in different sites in the tumor. A disadvantage is that the analog is not itself the clinical molecule, so critical comparison to the real drug is essential in all assays where that is possible. In our case, the critical property of MDR1 substrate efflux was common to the analog and the parent. With this analog we demonstrate microtubule disassembly and mitotic arrest consistent with prior literature on unmodified eribulin (18, 19).
Alternatively, the nano-encapsulated MDR1 inhibitor was visualized using a different color fluorophore (BODIPY630) that was co-assembled into the nanoparticle delivery system. This has the advantage that the effect of the clinical molecule was tested directly and the disadvantage that cellular binding and accumulation could not be assayed explicitly. However, tagging the particle was sufficient to quantify tumor uptake and location, and will be valuable for rational design of nanoparticle size and chemistry in ongoing studies. Concurrent analysis of the tumoral distribution of both the nano-encapsulated inhibitor and therapeutic substrate whose cellular retention it was promoting further enhanced PK optimization of the dual-administered therapies.
Multiple pathways have been implicated in cellular multidrug resistance, including altered drug metabolism, down-regulation of apoptotic pathways, and transformed DNA-damage repair; our study was limited to just one critical pathway in the development of multidrug resistance: drug efflux. As a primary model system, we employed two nearly isogenic human cell lines, differing only by fluorescent MDR1-expression. The strength of this design is that observed differences in drug interactions between the cell populations is predominantly attributable to MDR1 expression, independent of other transporters that may be expressed in all cell populations. Its limitation is that it excludes other transporters that may be relevant to clinical multidrug resistance. Overall, the system enabled specific analysis of MDR1-mediated effects in the context of an uncontrolled and heterogeneous tumor microenvironment. A valuable extension of this work will be systematic quantification of transformed cell pharmacodynamics in response to the altered pharmacokinetics observed in multidrug resistance using fluorescent reporters for apoptosis and DNA-damage repair.
These quantitative PK studies provoked development of a nanoparticle delivery platform for controlling multidrug resistance that could also be applied to other primary cytotoxic therapies where emerging resistance is the ultimate cause of drug failure. This mechanistic strategy has the potential to control intrinsic or acquired multidrug resistance observed in late-stage refractory patients, particularly after persistent exposure to well established cytotoxic therapies like taxanes. Its discovery, through systematic analysis of fluorescent drug retention in functionally divergent cell populations, underscores the utility of this quantitative method for investigating cellular drug resistance and evaluating new strategies to overcome such resistance, particularly when pharmacokinetic mechanisms are implicated.
Materials and Methods
Study design
The objective of this study was to investigate and quantify the cellular PK of a fluorescent eribulin analog (eribulin-BFL) in a tumor model that is spatially heterogeneous for taxane-resistance. This model enabled direct comparison of eribulin-BFL transport in functionally divergent subpopulations in vivo, matched for drug and environmental exposures. We systematically analyzed its PK at both the single-cell and cell population levels with a focus on understanding mechanisms of its resistance and for evaluating strategies to overcome that resistance. All in vitro studies were performed in triplicate, unless otherwise specified. All in vivo mouse imaging experiments were performed with 3 mice per treatment group, unless otherwise specified, and hundreds of single cells were analyzed per mouse (unblinded). In each mouse, multiple areas of tumors were imaged as 3D stacks and as a function of time allowing analysis of thousands of cells per experiment. The study endpoints (drug distribution over 5 T1/2 or intracellular drug concentration) were predetermined by the scientific questions. Female mice were randomly chosen for tumor implantations. All data are shown and outliers were not excluded.
Synthesis of eribulin-BFL
Synthesis of eribulin-BFL was carried out as described in fig. S1A and the Supplementary methods.
Synthesis of HM30181
HM30181, N-{2-(2-{4-(2-{6,7-dimethoxy-3,4-dihydroisoquinolin-2(1H)-yl}ethyl)phenyl}-2H-tetrazol-5-yl)-4,5-dimethoxyphenyl}-4-oxo-4H-chromene-2-carboxamide, was synthesized as described previously (40, 41). Characterization data are in agreement those reported in the literature (40): 1H NMR (400 MHz, CDCl3) 12.52 (s, 1 H), 8.66 (s, 1 H), 8.28−8.26 (m, 1 H), 8.16 (d, J = 8.5 Hz, 2 H), 7.82−7.76 (m, 3 H), 7.53−7.47 (m, 3 H), 7.30 (s, 1 H), 6.63 (s, 1 H), 6.56 (s, 1 H), 4.06 (s, 3 H), 4.04 (s, 3 H), 3.87 (s, 3 H), 3.86 (s, 3 H), 3.69 (s, 2 H), 3.07−3.03 (m, 2 H), 2.90−2.82 (m, 6 H); LRMS (ESI) m/z calc for C38H37N6O7 {M+H}+ 689.27, found 689.17.
Human cell lines
All cell lines were from ATCC, unless otherwise stated. MDA-MB-231 and MDA-MB-436 (human triple-negative breast adenocarcinomas), A2780 and OVCAR429 (human ovarian cancers, kind gifts from M. Birrer, Massachusetts General Hospital), and TC-71 (human Ewing's sarcoma) cells were maintained at 37°C, 5% CO2 and 100% relative humidity in RPMI medium supplemented with 10% fetal bovine serum, 100 IU penicillin, 100 μg/ml streptomycin, and 2 mM L-glutamine. SK-BR-3 (human breast adenocarcinoma), 1834 and 4175 (human breast metastases to the lung, kind gift from J. Massagué, Memorial Sloan Kettering Cancer Center), PANC-1 (human pancreatic cancer), and HT1080 (human fibrosarcoma) cells were maintained at 37°C, 5% CO2 and 100% relative humidity in minimum essential medium supplemented with 10% fetal bovine serum, 100 IU penicillin, 100 μg/ml streptomycin, and 2 mM L-glutamine. To specifically visualize MDR1-mediated PK effects, an HT1080 cell line expressing an MDR1-mApple fluorescent fusion protein was constructed using components of the MDR1 expression plasmid [Addgene, Plasmid # 10957: pHaMDRwt (34)] and a lentiviral vector pLVX (Clontech) expressing H2B-mApple (35) as described in the Supplementary Methods. HT1080 cells, including those expressing MDR1-mApple, were further labeled with a histone H2B-iRFP fusion protein for in vivo nuclear tracking. MRP7/ABCC10-transfected and vehicle-transfected HEK293 cells were kindly provided by E. Hopper to assay the relevance of this transporter to eribulin-BFL PK (36)]. MRP7/ABCC10 expression was validated by Western blot (fig. S11A).
Window chamber model
All animal experiments were carried out in accordance with guidelines from the Institutional Subcommittee on Research Animal Care. Female nude mice aged 6-8 weeks (Cox7, Massachusetts General Hospital) were implanted with a dorsal skin window chamber (Fig. 3A). Approximately 1 × 10⁶ HT1080 cells with mixed expression of MDR1-mApple (1:1) were harvested in up to 50 μl PBS and injected under the fascia. Tumors were grown for 2-4 weeks prior to imaging, such that they became vascularized and reached several mm in size.
In vitro cytotoxicity assays
Cell viability assays were performed in a 96-well format; cells were seeded at 2500 cells/well in 200 μl Dulbecco's Modified Eagle Medium without antibiotic selection 24 hrs prior to application of eribulin, different MDR1 inhibitors, HM30181, verapamil (Sigma-Aldrich, V4629), sulfinpyrazone (Sigma-Aldrich, S9509), imatinib (Selleck Chem, S1026), ponatinib (Selleck Chem, S1490), or the nanoparticle delivery platform. The next day, increasing concentrations of unlabeled and labeled eribulin were dissolved in DMSO and added to each well, while maintaining a final DMSO concentration less than 0.25%. When investigating whether MDR1 inhibitors can be used to potentiate eribulin's cytotoxic effects, serial dilutions of inhibitor were also added to the cells. The drug/inhibitor-containing media was washed out of the cells after a 16-24 h exposure and cell viability was assayed 72 h later. When comparing non-encapsulated and nano-encapsulated HM30181 profiles, the inhibitor (10 mM HM30181 stock in DMSO) and nano-encapsulated inhibitor (6.4 mM HM30181 in dl-H2O; determined by the method described above) were diluted to 1.3 μM in media and then serially diluted 1:2 until reaching a final concentration of 5 nM. In the case of the non-encapsulated inhibitor, the DMSO content was normalized to a final concentration of 0.013%. The cells were incubated with the varying concentrations of inhibitor (100 nM to 5 μM) for 6 h, and then eribulin (10 mM stock in DMSO) was applied to designated wells (at a final assay concentration of 25 nM); wells designated for treatment with inhibitor only were normalized with additional DMSO. After incubating for 24 h, the media was replaced with media without drug/inhibitor, and the cells were incubated for an additional 48 h. Cell viability was quantified using the PrestoBlue cell viability reagent (Life Technologies) and using a TECAN Safire2 plate reader.
Fluorescence measurements were normalized to cells exposed to a DMSO control (no drug/inhibitor), drug concentrations were log-transformed, and parameters were estimated by nonlinear regression of the normalized fluorescence measures to the Hill equation or a sigmoidal dose response (for assays investigating inhibitory effects of HM30181) using Prism 6.0. All measurements were repeated in triplicate and are presented as means ± S.E.M.
Nano-formulation of HM30181
Fresh nanoparticle batches were prepared in overnight reactions for experiments the following day. HM30181 (3.6 mg) and PLGA-B630 (4 mg) were added to PLGA-PEG (20 mg) in a final solution of 50:50 acetonitrile:N,N-dimethylformamide. After mixing, the solution was slowly added drop-wise to deionized H2O (40 mL) being stirred at 800 rpm. After overnight stirring, the solution was filtered through a 0.45-μm pore-size cellulose acetate syringe filter (Fisher Scientific) and washed with deionized H2O using Amicon-ultra (Millipore) 100-kDa MWCO centrifuge filters spun at 3000 × g. Nanoparticle size distributions were immediately characterized by dynamic light scattering (Zetasizer APS; Malvern). For each batch, drug loading was characterized by absorbance at 400 nm, with a 5-point standard curve (R2>0.99) using purified HM30181, while compensating for BODIPY-630 absorbance using a standard curve that measured both fluorescence (ex/em 630/690 nm) and absorbance (400 nm) of purified PLGA-BODIPY-630.
For measurement of HM30181 release from PLGA-PEG NP encapsulation, NPs were re-suspended in PBS (300 μL) at 37°C. At each time point measurement, the solution was filtered using 100-kDa MWCO centrifuge filters (Millipore) and spun at 3000 × g for 15 min. Concentrated NPs were resuspended in fresh PBS to a volume of 300 μl and kept at 37°C until the next time point measurement. The filtrate was resuspended to a final volume of 200 μl PBS, and the drug concentration was measured by absorbance as described above.
For independent analysis of NP circulation, a separate batch of nanoparticles labeled with a BODIPY emitting in the green channel were prepared by conjugating 10-(2-aminoethyl)-5,5-difluoro-1,3,7,9-tetramethyl-5H-dipyrrolo{1,2-c:2’,1’-f}{1,3,2}diazaborinin-4-ium-5-uide hydrochloride [synthesized by adapting a known method (37)] to PLGA using the methods described for the case of the PLGA-BODIPY630. Loadings were determined as described above (ex/em 483/525 nm).
Intravital microscopic imaging
All imaging experiments were carried out in accordance with guidelines from the Institutional Subcommittee on Research Animal Care. When tumors became vascularized and reached several mm in size intravital imaging was performed (38, 39). Mice were anesthetized with 2% isofluorane in 2 l min-1 oxygen on a heated microscope stage and the lateral tail vein was cannulated for intravenous administration of eribulin-BFL, the MDR1 inhibitor, and/or a 500-kDa amino-dextran labeled with Pacific Blue N-hydoxysuccinimide ester (Invitrogen), according to the manufacturer's instructions. The dextran was first used to identify vascularized regions within the tumor, while fluorescent reporters of wild type and resistant cancer cells were used to identify regions of interest (all cells were identified by the H2B-iRFP fusion protein, while the resistant subset identified by the MDR1-mApple fusion protein). Serial images and z-stacks were acquired in representative areas of the tumor and eribulin-BFL was injected during acquisition of the time-lapse imaging series. The drug was formulated by dissolving 7.5 μl of 10 mM solution in DMSO along with 30 μl of of 1:1 N,N-dimethylacetamide:solutol solution. PBS (112.5 μl) was then slowly added with sonication to obtain a final injection volume of 150 μl. When evaluating the cellular effect of intravenously administering the MDR1 inhibitor, a 10 mg/kg solution of inhibitor in N,N-dimethylacetamide:solutol solution was either co-injected with eribulin or pre-injected within 24 h and up to 3x before eribulin administration. For topical application of drug and inhibitor, 16 μl of 10 mM HM30181 was dissolved in 800 μl of PBS along with 0.5 μl of 10 mM eribulin-BFL solution in DMSO and applied directly to the tumor surface. For topical application of drug alone, 16 μl of DMSO was dissolved in 800 μl of PBS along with 0.5 μl of 10 mM eribulin-BFL solution in DMSO and applied directly to the tumor surface. For nanoparticle delivery of the MDR1 inhibitor, particles were intravenously injected daily for one week (~11 mg/kg, 1:1 in PBS), with a secondary dose administered on the first and last day (days 1 and 5). After inhibitor loading, the eribulin-BFL solution (previously described) was intravenously injected and imaged in the mosaic tumor model at steady state (> 20 min after administration).
Static and time series images were collected using a customized Olympus FV1000 confocal microscope (Olympus America). A XLUMPLFLN 20× water immersion objective (NA 1.0, Olympus America) was used for data collection typically with 2-4× zoom, thereby assessing 30-200 cells per imaging field of view (FOV). The vascular probes, eribulin-BFL, MDR1-mApple, H2B-iRFP, and at times HM30181-NP, were scanned and excited sequentially using a 405-nm, a 473-nm, a 559-nm, and a 633-nm diode laser respectively. Emitted fluorescence was separated using dichroic beam splitters SDM473, SDM560 and SDM640 in combination with bandpass filters BA430-455, BA490-540, BA575-620 and/or BA655-755 (Olympus America). Confocal imaging settings were optimized for each fluorophore to prevent photo bleaching, photo toxicity, and crosstalk between channels.
Image analysis
To account for depth fluctuations in the imaging plane, frames from sequential z-stacks were co-registered by maximizing the mutual information between consecutive imaging stacks. In order to scale up our single-cell observations to the population level, algorithms for automated segmentation and tracking of in vivo cellular dynamics were then developed based on a coupled active contours model (40). Individual cells were seeded in this algorithm according to the centroid of each histone, semi-automatically identified by a local maxima finder. Each contour was iteratively updated according to the histone region curvature, gradient, energy and repulsion from adjacent contours, enabling segmentation of densely clustered nuclei. The segmented nuclei were then morphologically dilated to encompass the cell cytoplasmic compartment. We used phantom data to directly correlate the fluorescence signal with drug concentrations, as described previously (41). Thereby, the cellular concentration of eribulin was mapped over time as a function of MDR1 expression level. Drug concentration curves were background subtracted. If necessary when evaluating static images, manual segmentation algorithms were implemented to precisely segment individual cells at lower magnification settings. When evaluating the percentage of MDR1-expressing cells accumulating drug as a function of MDR1 inhibitor delivery method, the cellular frequency of MDR1-expressing cells with a drug concentration within 1.96 standard deviations of the mean native cell drug concentration imaged simultaneously was reported. All image analysis was performed using MATLAB (MATLAB and Statistics Toolbox Release 2013b, The MathWorks, Inc.).
Mathematical model of cellular drug efflux
Time-dependent cellular drug concentration profiles were exported from MATLAB into Prism 6.0 (GraphPad) for nonlinear determination of optimized PK parameters. The weighted imaging half-life of the eribulin-BFL was measured in normal vessels of the mouse ear and was fit to a two-phase exponential decay. Cellular eribulin-BFL PKs were fit using non-linear regression to an analytical model describing bi-directional diffusion and site-specific efflux out of the cell.
Statistical analysis
Distributions were analyzed using Prism 6.0 software and are presented as means ± SEM. Comparisons of two groups were performed using unpaired t tests, or for more than two groups, by applying one-way analysis of variance (ANOVA) using the Tukey multiple comparison test. Differences were considered significant at P < 0.05. Two-sided P values were uniformly calculated unless otherwise specified.
Supplementary Material
One Sentence Summary.
Single-cell pharmacokinetic analysis of a fluorescent eribulin derivative in vivo revealed drug resistance mediated by MDR1-driven efflux, which was overcome by a nano-encapsulated MDR1 inhibitor.
Acknowledgements
We thank S. Bakhoum for thoughtful discussions and feedback on the manuscript; G. Wojtkiewicz, D. Pirovich and P. Waterman for help with animal experiments. Funding: This work was funded in part by R01CA164448, PO1-CA139980 and U54-CA151884. A.M.L., M.S.S., M.A.M. and K.S.Y. were sponsored by NIH-NCI 5T32CA079443. Data and materials availability: Reagents, stable cell lines, and anonymized data are available via a materials transfer agreement.
Footnotes
Author Contributions: A.M.L. designed and performed experiments, analyzed the data, and wrote versions of the manuscript. E.K synthesized and characterized the fluorescent eribulin conjugate. M.M.S. synthesized the MDR1 inhibitor, HM30181, as well as the PLGA-PEG polymers used for nanoparticle assembly. M.A.M. synthesized and characterized nanoparticles encapsulating HM30181. M.M.S. and M.A.M. contributed to the in vitro characterization of nanoparticles. K.S.Y. assisted in cell line development and characterization. R.H.K. assisted with intravital microscopy. J.D.O. constructed the HT1080 MDR1-expressing cell line selected for survival in taxol. T.J.M and R.W. supervised the study, contributed to experimental design and data interpretation and co-wrote the manuscript. All authors have read and edited the final manuscript.
Competing interests: The authors declare they have no competing interests.
References and Notes
- 1.Arao S, et al. Expression of multidrug resistance gene and localization of P-glycoprotein in human primary ovarian cancer. Cancer Res. 1994;54:1355–1359. [PubMed] [Google Scholar]
- 2.Arceci RJ. Clinical significance of P-glycoprotein in multidrug resistance malignancies. Blood. 1993;81:2215–2222. [PubMed] [Google Scholar]
- 3.Bell DR, Gerlach JH, Kartner N, Buick RN, Ling V. Detection of P-glycoprotein in ovarian cancer: a molecular marker associated with multidrug resistance. J Clin Oncol. 1985;3:311–315. doi: 10.1200/JCO.1985.3.3.311. [DOI] [PubMed] [Google Scholar]
- 4.Dalton WS, et al. Immunohistochemical detection and quantitation of P-glycoprotein in multiple drug-resistant human myeloma cells: association with level of drug resistance and drug accumulation. Blood. 1989;73:747–752. [PubMed] [Google Scholar]
- 5.Pirker R, et al. MDR1 gene expression and treatment outcome in acute myeloid leukemia. J Natl Cancer Inst. 1991;83:708–712. doi: 10.1093/jnci/83.10.708. [DOI] [PubMed] [Google Scholar]
- 6.Sato H, et al. MDR1 transcript levels as an indication of resistant disease in acute myelogenous leukaemia. Br J Haematol. 1990;75:340–345. doi: 10.1111/j.1365-2141.1990.tb04346.x. [DOI] [PubMed] [Google Scholar]
- 7.Administration US. F. A. D. FDA approves new treatment option for late-stage breast cancer. 2010 [Google Scholar]
- 8.Cortes J, et al. Eribulin monotherapy versus treatment of physician’s choice in patients with metastatic breast cancer (EMBRACE): a phase 3 open-label randomised study. Lancet. 2011;377:914–923. doi: 10.1016/S0140-6736(11)60070-6. [DOI] [PubMed] [Google Scholar]
- 9.Kaufman P. Study Finds Greater Potential Benefit in Overall Survival for Eribulin Compared with Capecitabine. 2013 [Google Scholar]
- 10.Saji S. Evolving approaches to metastatic breast cancer patients pre-treated with anthracycline and taxane. BioDrugs. 2013;27:469–478. doi: 10.1007/s40259-013-0038-1. [DOI] [PMC free article] [PubMed] [Google Scholar]
- 11.Towle MJ, et al. In vitro and in vivo anticancer activities of synthetic macrocyclic ketone analogues of halichondrin B. Cancer Res. 2001;61:1013–1021. [PubMed] [Google Scholar]
- 12.Binkhathlan Z, Lavasanifar A. P-glycoprotein inhibition as a therapeutic approach for overcoming multidrug resistance in cancer: current status and future perspectives. Curr Cancer Drug Targets. 2013;13:326–346. doi: 10.2174/15680096113139990076. [DOI] [PubMed] [Google Scholar]
- 13.Krishna R, de Jong G, Mayer LD. Pulsed exposure of SDZ PSC 833 to multidrug resistant P388/ADR and MCF7/ADR cells in the absence of anticancer drugs can fully restore sensitivity to doxorubicin. Anticancer Res. 1997;17:3329–3334. [PubMed] [Google Scholar]
- 14.Cha YJ, et al. Sustained Increase in the Oral Bioavailability of Loperamide after a Single Oral Dose of HM30181, a P-glycoprotein Inhibitor, in Healthy Male Participants. Basic Clin Pharmacol Toxicol. 2013 doi: 10.1111/bcpt.12108. [DOI] [PubMed] [Google Scholar]
- 15.Kim TE, et al. Tolerability and pharmacokinetics of a new P-glycoprotein inhibitor, HM30181, in healthy Korean male volunteers: single- and multiple-dose randomized, placebo-controlled studies. Clin Ther. 2012;34:482–494. doi: 10.1016/j.clinthera.2012.01.003. [DOI] [PubMed] [Google Scholar]
- 16.Kwak JO, et al. Selective inhibition of MDR1 (ABCB1) by HM30181 increases oral bioavailability and therapeutic efficacy of paclitaxel. Eur J Pharmacol. 2010;627:92–98. doi: 10.1016/j.ejphar.2009.11.008. [DOI] [PubMed] [Google Scholar]
- 17.Pusztai L, et al. Phase II study of tariquidar, a selective P-glycoprotein inhibitor, in patients with chemotherapy-resistant, advanced breast carcinoma. Cancer. 2005;104:682–691. doi: 10.1002/cncr.21227. [DOI] [PubMed] [Google Scholar]
- 18.Jordan MA, et al. The primary antimitotic mechanism of action of the synthetic halichondrin E7389 is suppression of microtubule growth. Mol Cancer Ther. 2005;4:1086–1095. doi: 10.1158/1535-7163.MCT-04-0345. [DOI] [PubMed] [Google Scholar]
- 19.Okouneva T, Azarenko O, Wilson L, Littlefield BA, Jordan MA. Inhibition of centromere dynamics by eribulin (E7389) during mitotic metaphase. Mol Cancer Ther. 2008;7:2003–2011. doi: 10.1158/1535-7163.MCT-08-0095. [DOI] [PMC free article] [PubMed] [Google Scholar]
- 20.Dhar S, Gu FX, Langer R, Farokhzad OC, Lippard SJ. Targeted delivery of cisplatin to prostate cancer cells by aptamer functionalized Pt(IV) prodrug-PLGA-PEG nanoparticles. Proc Natl Acad Sci U S A. 2008;105:17356–17361. doi: 10.1073/pnas.0809154105. [DOI] [PMC free article] [PubMed] [Google Scholar]
- 21.Kamaly N, et al. Development and in vivo efficacy of targeted polymeric inflammation-resolving nanoparticles. Proc Natl Acad Sci U S A. 2013;110:6506–6511. doi: 10.1073/pnas.1303377110. [DOI] [PMC free article] [PubMed] [Google Scholar]
- 22.Diaz LAJ, et al. The molecular evolution of acquired resistance to targeted EGFR blockade in colorectal cancers. Nature. 2012;486:537–540. doi: 10.1038/nature11219. [DOI] [PMC free article] [PubMed] [Google Scholar]
- 23.Chen J, et al. HIF-1alpha Inhibition Reverses Multidrug Resistance in Colon Cancer Cells via Downregulation of MDR1/P-Glycoprotein. PLoS One. 2014;9:e98882. doi: 10.1371/journal.pone.0098882. [DOI] [PMC free article] [PubMed] [Google Scholar]
- 24.Comerford KM, et al. Hypoxia-inducible factor-1-dependent regulation of the multidrug resistance (MDR1) gene. Cancer Res. 2002;62:3387–3394. [PubMed] [Google Scholar]
- 25.Ding Z, et al. Expression and significance of hypoxia-inducible factor-1 alpha and MDR1/P-glycoprotein in human colon carcinoma tissue and cells. J Cancer Res Clin Oncol. 2010;136:1697–1707. doi: 10.1007/s00432-010-0828-5. [DOI] [PMC free article] [PubMed] [Google Scholar]
- 26.Nardinocchi L, Puca R, Sacchi A, D'Orazi G. Inhibition of HIF-1alpha activity by homeodomain-interacting protein kinase-2 correlates with sensitization of chemoresistant cells to undergo apoptosis. Mol Cancer. 2009;8:1. doi: 10.1186/1476-4598-8-1. [DOI] [PMC free article] [PubMed] [Google Scholar]
- 27.Song X, et al. Hypoxia-induced resistance to cisplatin and doxorubicin in non-small cell lung cancer is inhibited by silencing of HIF-1alpha gene. Cancer Chemother Pharmacol. 2006;58:776–784. doi: 10.1007/s00280-006-0224-7. [DOI] [PubMed] [Google Scholar]
- 28.Xie J, Li DW, Chen XW, Wang F, Dong P. Expression and significance of hypoxia-inducible factor-1alpha and MDR1/P-glycoprotein in laryngeal carcinoma tissue and hypoxic Hep-2 cells. Oncol Lett. 2013;6:232–238. doi: 10.3892/ol.2013.1321. [DOI] [PMC free article] [PubMed] [Google Scholar]
- 29.Zhu H, et al. Involvement of hypoxia-inducible factor-1-alpha in multidrug resistance induced by hypoxia in HepG2 cells. J Exp Clin Cancer Res. 2005;24:565–574. [PubMed] [Google Scholar]
- 30.Raderer M, Scheithauer W. Clinical trials of agents that reverse multidrug resistance. A literature review. Cancer. 1993;72:3553–3563. doi: 10.1002/1097-0142(19931215)72:12<3553::aid-cncr2820721203>3.0.co;2-b. [DOI] [PubMed] [Google Scholar]
- 31.Krishna R, Mayer LD. Multidrug resistance (MDR) in cancer. Mechanisms, reversal using modulators of MDR and the role of MDR modulators in influencing the pharmacokinetics of anticancer drugs. Eur J Pharm Sci. 2000;11:265–283. doi: 10.1016/s0928-0987(00)00114-7. [DOI] [PubMed] [Google Scholar]
- 32.Kamaly N, Xiao Z, Valencia PM, Radovic-Moreno AF, Farokhzad OC. Targeted polymeric therapeutic nanoparticles: design, development and clinical translation. Chem Soc Rev. 2012;41:2971–3010. doi: 10.1039/c2cs15344k. [DOI] [PMC free article] [PubMed] [Google Scholar]
- 33.Yan Y, Such GK, Johnston AP, Best JP, Caruso F. Engineering particles for therapeutic delivery: prospects and challenges. ACS Nano. 2012;6:3663–3669. doi: 10.1021/nn3016162. [DOI] [PubMed] [Google Scholar]
- 34.Pastan I, et al. A retrovirus carrying an MDR1 cDNA confers multidrug resistance and polarized expression of P-glycoprotein in MDCK cells. Proc Natl Acad Sci U S A. 1988;85:4486–4490. doi: 10.1073/pnas.85.12.4486. [DOI] [PMC free article] [PubMed] [Google Scholar]
- 35.Reiner T, et al. Imaging therapeutic PARP inhibition in vivo through bioorthogonally developed companion imaging agents. Neoplasia. 2012;14:169–177. doi: 10.1593/neo.12414. [DOI] [PMC free article] [PubMed] [Google Scholar]
- 36.Hopper E, et al. Analysis of the structure and expression pattern of MRP7 (ABCC10), a new member of the MRP subfamily. Cancer Lett. 2001;162:181–191. doi: 10.1016/s0304-3835(00)00646-7. [DOI] [PubMed] [Google Scholar]
- 37.Vendrell M, et al. Solid-phase synthesis of BODIPY dyes and development of an immunoglobulin fluorescent sensor. Chem Commun (Camb) 2011;47:8424–8426. doi: 10.1039/c1cc11774b. [DOI] [PubMed] [Google Scholar]
- 38.Condeelis J, Weissleder R. In vivo imaging in cancer. Cold Spring Harb Perspect Biol. 2010;2:a003848. doi: 10.1101/cshperspect.a003848. [DOI] [PMC free article] [PubMed] [Google Scholar]
- 39.Pittet MJ, Weissleder R. Intravital imaging. Cell. 2011;147:983–991. doi: 10.1016/j.cell.2011.11.004. [DOI] [PMC free article] [PubMed] [Google Scholar]
- 40.Yan P, Zhou X, Shah M, Wong ST. Automatic segmentation of high-throughput RNAi fluorescent cellular images. IEEE Trans Inf Technol Biomed. 2008;12:109–117. doi: 10.1109/TITB.2007.898006. [DOI] [PMC free article] [PubMed] [Google Scholar]
- 41.Thurber GM, et al. Single-cell and subcellular pharmacokinetic imaging allows insight into drug action in vivo. Nat Commun. 2013;4:1504. doi: 10.1038/ncomms2506. [DOI] [PMC free article] [PubMed] [Google Scholar]
Associated Data
This section collects any data citations, data availability statements, or supplementary materials included in this article.