

Abstract
Human transcription factors recognize specific DNA sequence motifs to regulate transcription. It is unknown whether a single transcription factor is able to bind to distinctly different motifs on chromatin, and if so, what determines the usage of specific motifs. By using a motif-resolution chromatin immunoprecipitation-exonuclease (ChIP-exo) approach, we find that agonist-liganded human androgen receptor (AR) and antagonist-liganded AR bind to two distinctly different motifs, leading to distinct transcriptional outcomes in prostate cancer cells. Further analysis on clinical prostate tissues reveals that the binding of AR to these two distinct motifs is involved in prostate carcinogenesis. Together, these results suggest that unique ligands may switch DNA motifs recognized by ligand-dependent transcription factors in vivo. Our findings also provide a broad mechanistic foundation for understanding ligand-specific induction of gene expression profiles.
Keywords: androgen receptor, ChIP-exo, DNA motif switching, prostate cancer, transcription factor
Introduction
Human transcription factors (TFs) bind to specific DNA motifs to regulate the expression of target genes involved in development, differentiation, and diseases. Although recent in vitro high-throughput TF-DNA binding studies have significantly increased our understanding of DNA motifs recognized by TFs, showing, for example, that structurally different TFs have distinct DNA binding specificities (Badis et al, 2009; Zhao & Stormo, 2011; Jolma et al, 2013), it remains an open question as to whether or not a single TF is able to bind to multiple DNA motifs in vitro and in vivo, and if so, what determines the usage of specific motifs.
TFs in the nuclear hormone receptor (NR) superfamily mediate the action of lipophilic ligands including steroids, retinoids, vitamin D3, and thyroid hormone (Mangelsdorf et al, 1995). NRs contain a N-terminal domain (NTD), a DNA-binding domain (DBD), a hinge region, and a C-terminal ligand-binding domain (LBD) (Mangelsdorf et al, 1995). Previous crystal structural studies on NR LBDs (e.g. LBDs of androgen receptor [AR], estrogen receptor [ER], and progesterone receptor [PR]) found that different ligands (agonists, antagonists, and selective NR modulators) are able to induce different conformational changes of the NR LBDs (Helsen & Claessens, 2014). Interestingly, recent crystal studies on the full-length PPARγ–RXRα heterodimer and HNF-4α homodimer identified previously unknown interfaces between NR LBDs and DBDs, and subsequent functional studies found that LBDs collaborate with DBDs to accomplish DNA binding (Chandra et al, 2008, 2013). In silico modeling, hydrogen–deuterium exchange (HDX) and functional studies demonstrated that such allosteric communications between LBDs and DBDs also exist in other NRs such as AR and vitamin D receptor (VDR) (Zhang et al, 2011; Helsen et al, 2012a). Together, these studies suggest that ligands may dictate DNA sequence recognition, raising the question whether different ligands are able to induce NR binding to distinctly different DNA motifs.
To test whether different ligands are able to switch NR binding motifs in vivo, the sequence composition and variability as well as precise genomic locations of NR binding motifs in vivo need to be precisely defined. Unfortunately, the low resolution of ChIP combined with a microarray (ChIP-on-chip) and standard ChIP combined with high-throughput sequencing (ChIP-seq) assays makes it difficult to determine the precise locations and types of TF binding motifs within TF binding peaks that span several hundred base pairs (bps) (Furey, 2012; Hardison & Taylor, 2012). With the recent incorporation of 5′–3′ strand-specific exonuclease digestion into the standard ChIP-seq procedure, ChIP-exonuclease (ChIP-exo) is able to identify high-resolution TF binding locations and binding motifs (Rhee & Pugh, 2011). Feasibility of this novel technology and methods for ChIP-exo computational analyses have been demonstrated for a number of TFs in yeast and human cells (Rhee & Pugh, 2011, 2012; Serandour et al, 2013). However, since human gene expression normally involves combinatorial regulation by multiple TFs within transcription complexes, it is unclear whether the current ChIP-exo approach may be utilized to precisely define specific motifs bound by individual TFs within such complexes in human cells and tissues.
In this study, we developed a modified ChIP-exo assay for AR (Supplementary Fig S1), which collaborates with other TFs within the AR transcription complex to exert its function during the normal development of the human prostate as well as the onset and progression of human prostate cancer (Heinlein & Chang, 2004; Wu et al, 2011). By using a novel border pattern-based motif defining approach, we precisely defined agonist (dihydrotestosterone, DHT)- and antagonists (bicalutamide and enzalutamide)-liganded AR binding elements (hereinafter called “ARBE”) bound by AR transcription complexes in the prostate cancer cell line LNCaP, malignant human prostate tumors and their paired non-malignant adjacent tissues (NATs). Through an integrative analysis of AR ChIP-exo data, AR ChIP-seq data, mononucleosome-resolution histone mark ChIP-seq data, DNase-seq and RNA-seq data, as well as various functional validation assays, we not only identify and characterize agonist-liganded ARBEs in prostate cancer, but also find that antagonist-bound AR specifically recognizes a novel DNA motif distinct from agonist-liganded ARBEs, leading to distinct prostate cancer-relevant transcriptional outcomes. Collectively, the presented data demonstrate for the first time that the binding of different ligands results in switching of DNA motifs recognized by a ligand-dependent TF.
Results
Profiling of agonist- and antagonist-liganded AR-DNA binding in prostate cancer cells
To precisely map agonist- and antagonist-liganded ARBEs across the whole human genome, AR ChIP-exo was performed in LNCaP cells treated with or without 10 nM DHT for 4 h combined with vehicle, 10 μM bicalutamide (a first-generation AR antagonist), or 10 μM enzalutamide (a second-generation AR antagonist) (Tran et al, 2009) (Fig1, Supplementary Fig S2 and Supplementary Table S1). In two biological replicates with high reproducibility, we identified 39,501 AR-enriched locations (with a resolution of 288 ± 155 bp) and 232,650 exonuclease borders (i.e. exonuclease stop sites) using the bin-based enrichment level threshold (BELT) algorithm (Lan et al, 2011) and the mixture asymmetric-Laplace distribution (MALD) model (see Supplementary Experimental Procedures), respectively (Supplementary Fig S2A–I). At the same sequencing depth, AR ChIP-exo data showed higher resolution compared to our own AR ChIP-seq data and published DNase-seq data (He et al, 2012) in LNCaP cells (Supplementary Fig S2J–M and Supplementary Table S1). Using a differential enrichment analysis (see Supplementary Experimental Procedures), we identified 34,442 DHT-induced AR binding locations as agonist-responsive regions, as well as 3,292 bicalutamide- and enzalutamide-enhanced AR binding locations as antagonist-responsive regions (Fig1). Among those responsive regions, agonist failed to induce AR binding in antagonist-responsive regions, and vise versa (Fig1). We next performed a de novo motif analysis of sequences protected from exonuclease digestion within the agonist-responsive locations. Unlike previous ChIP-exo studies that identified only one type of motif bound by the target TF (Rhee & Pugh, 2011, 2012; Serandour et al, 2013), we found that the most significantly enriched consensus sequences resembled the Forkhead motif rather than the androgen response element (ARE) (supplementary Fig S2N), indicating that non-AR motifs recognized by other TFs within the AR transcription complex may also be discovered from AR ChIP-exo data. To confirm whether the Forkhead motifs defined in AR ChIP-exo are bound by the AR cofactor FOXA1 (Wang et al, 2007), we performed FOXA1 ChIP-exo assays in LNCaP cells with or without DHT stimulation (Supplementary Table S1). Comparison of FOXA1 ChIP-exo data with AR ChIP-exo data revealed the same exonuclease borders over the Forkhead motifs (Supplementary Fig S2O–Q), demonstrating that Forkhead motifs are protected by the same protein (i.e. FOXA1) in two independent ChIP-exo datasets. In addition to Forkhead motifs with strong border signals, many other TF motifs with less clear or weak border signals were co-enriched with AREs (Supplementary Table S2). These results indicate that AR ChIP-exo borders are generated by multiple TFs within the AR transcription complex.
Figure 1.
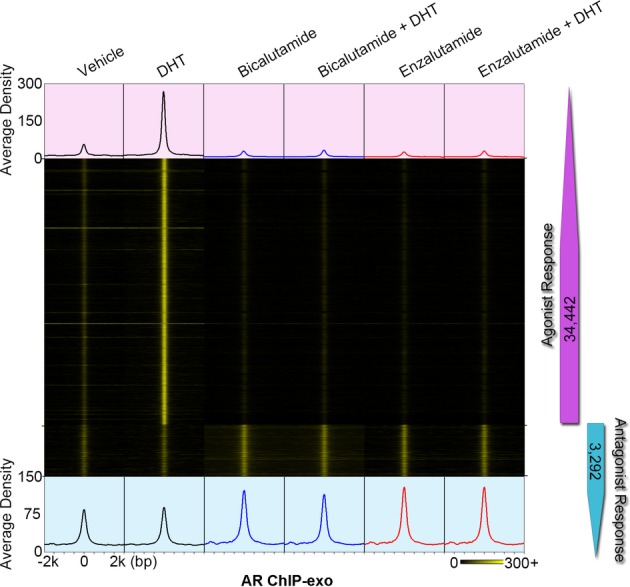
Divergent AR binding triggered by agonist and antagonist in LNCaP cells
Heat map showing two distinct types of AR binding locations. Agonist (DHT) induced AR binding in 34,442 agonist-responsive regions. Antagonist (bicalutamide and enzalutamide)-enhanced AR recruitment in 3,292 antagonist-responsive loci. The normalized average signal density of reads 2 is also shown for each condition.
Precise definition and functional validation of four types of agonist-liganded ARBEs in prostate cancer cells
Given that unique TFs [e.g. FOXA1 (Supplementary Fig S2O–Q) and CTCF (Rhee & Pugh, 2011)] generate specific ChIP-exo border patterns due to distinctive protein–DNA and/or protein–protein interactions on chromatin, we next developed a border pattern-based motif defining approach (see Supplementary Fig S1 and Supplementary Experimental Procedures) to precisely define ARBEs from the agonist-responsive locations. We identified 30,484 high-confidence agonist-liganded ARBEs (Fig2A and B). These ARBEs were classified into four types based on sequence composition and border patterns: 18,359 ARBE1 (5′-NGNACA-3′), 2,739 ARBE2 (5′-NGHACG-3′), 4,460 ARBE3 (5′-AGAACTG-3′), and 4,926 ARBE4 (5′-AGTACYT-3′) (Fig2A and B, and Supplementary Fig S3A). Surprisingly, although agonist-liganded ARBEs were originally proposed to be organized as 15-bp sequences containing inverted repeats of 5′-AGAACA-3′ spaced by 3 nucleotides and recognized by AR homodimers (Mangelsdorf et al, 1995), we found that only up to six nucleotides of agonist-liganded ARBEs were highly protected by AR from exonuclease digestion and highly conserved (Fig2A and B). These unexpected results may support the cooperative steroid receptor (SR) binding hypothesis, which postulates that high-affinity binding of the first SR to a conserved SR responsive element (SRE) half-site facilitates the low-affinity binding of the second SR to a deviated SRE half-site (Tsai et al, 1988; Helsen et al, 2012b), as the low-affinity AR binding sequences appear to be weakly protected by AR from exonuclease digestion. Alternatively and as proposed previously, AR may bind to half-site-like agonist-liganded ARBE sequences (Wang et al, 2007; Massie et al, 2011). To distinguish these two possibilities, we determined the nucleotide frequencies in the sequences 3 bp from the common downstream border of agonist-liganded ARBEs (Supplementary Fig S3B and C) and performed motif scanning on the extended agonist-liganded ARBE-containing sequences using the full-length ARBE matrix obtained from our AR ChIP-seq data (Supplementary Fig S3D) and a published study (Denayer et al, 2010). Approximately 21.2% of ARBE1, 3.9% of ARBE2, 6.6% of ARBE3, and 2.7% of ARBE4 were full-length ARBEs (Supplementary Fig S3E–G). Although only a small fraction of precisely defined ARBEs were full-length ARBEs, the straightforward screening of all precisely defined ARBE matrix-containing sequences within 100 bp of AR ChIP-seq peak centers regardless of border signals resulted in an obvious increase of half-site-like AREs (i.e. increased false-positive matches to a relatively short sequence motif), decrease of full-length ARE proportions, and loss of border signals (as motifs are inaccurately mapped to sites not protected from exo-digestion) (Supplementary Fig S3H–J), implying that simple ChIP-seq sequence analysis may identify potential false-positive motifs. Further characterization of the remaining agonist-liganded ARBEs identified that, in addition to half-site-like ARBEs that shared no conserved nucleotides in the downstream half-sites with canonical full-length ARBEs, a significant percentage (up to 53.3%) of each type of ARBE contains at least 2 or 3 conserved nucleotides in the downstream half-site (Fig2C and Supplementary Fig S3K–M). We termed these ARBEs “non-canonical full-length ARBEs”. Together, these results indicate that agonist-liganded ARBEs are highly heterogeneous.
Figure 2.

- AR ChIP-exo defines four types of high-confidence agonist-liganded ARBEs. Numbers indicate motif counts. The first two columns of each ARBE panel show normalized tags distribution over ARBEs on the forward (blue) and reverse (red) strands, separately. Forward strand refers to the motif-containing strand. The aggregated tag density is shown at the top of the raw signal plots. The third column of each ARBE panel represents the bound motif sequences ordered as in the left two columns.
- Comparison of tag density shows the four types of ARBEs are located between one common upstream border on the forward strand and one common downstream border on the reverse strand. Other border signals on ARBEs are also shown. The protected conserved nucleotides of each ARBE have the same distance to both common borders.
- Clustering of ARBE1 based on the motif probability matrix of the extended second-half ARBE.
To examine whether the four types of agonist-liganded ARBEs are required for AR binding and subsequent activation of androgen-dependent gene expression, we performed reporter gene assays in LNCaP cells (Fig3 and Supplementary Table S3). All 16 randomly selected ARBE regions showed androgen- and ARBE-dependent enhancer activities (Fig3A and B). Interestingly, ChIP-exo analysis identified a precisely defined ARBE2 and an ARBE4 forming an uncommon inter-type non-canonical full-length agonist-liganded ARBE in the well-known −13.5 kb TMPRSS2 enhancer that regulates the TMPRSS2 gene through chromatin looping (Wang et al, 2007; Chen et al, 2011) (Fig3C and Supplementary Fig S3G). Surprisingly, the precisely defined TMPRSS2 agonist-liganded ARBE was different from the previously reported TMPRSS2 ARE identified through motif scanning in ChIP-enriched regions (Wang et al, 2007; Denayer et al, 2010). The clear border signals on the new precisely defined but not the previously identified TMPRSS2 ARE (Fig3C) and functional validation (Fig3D and E) demonstrated that this ARBE rather than the previously reported ARE was the correct element for AR binding in vivo.
Figure 3.

- Schematic representation of ARBE wild-type (WT) and deletion mutant (Mut) reporters.
- ARBE reporter constructs were transiently transfected into LNCaP cells. Cells were stimulated with DHT (100 nM), a synthetic androgen R1881 (10 nM), or vehicle for 16–24 h, and luciferase activities were measured. The results were presented as the mean ± SD of the quadruplicate transfections. The genomic positions of ARBEs are also shown.
- UCSC genome browser showing signals on ChIP-exo defined TMPRSS2 −13.5 kb enhancer ARBE.
- Enhancer activity was compared between literature-based ARE and Exo-defined ARBE in TMPRSS2 locus by reporter gene assay.
- ARBE2 and ARBE4 were validated in TMPRSS2 enhancer through WT or Mut construct transfections. The results were presented as the mean ± SD of the quadruplicate transfections.
- Two ARBE1 regions were changed to ARBE2, ARBE3, or ARBE4 through mutations at nucleotide 5 and/or 6. Cells were stimulated with DHT (100 nM), R1881 (10 nM), or vehicle for 16–24 h, and luciferase activities were measured. The results were presented as the mean ± SD of the quadruplicate transfections. The genomic positions of ARBEs are also shown.
As ChIP-exo analysis found that the levels of AR occupancy at agonist-liganded ARBEs 1 and 2 were higher than ARBEs 3 and 4 (Supplementary Fig S4C and D), we next addressed the mechanisms underlying the differential binding of AR to the four types of agonist-liganded ARBEs. Based on the observation that different ARBE types contained different nucleotides at position +5 and/or +6 (Fig2B), we hypothesized that divergence at these two nucleotide positions leads to differential AR binding. To test this hypothesis, we randomly chose two agonist-liganded ARBE1-containing regions and changed the single ARBE1 sequence in each region to an ARBE2, 3 or 4 sequence through mutations at nucleotide 5 and/or 6 (Fig3F). Interestingly, while ARBE2 mutants showed increased or comparable androgen-dependent enhancer activities, ARBE3 and ARBE4 mutants exhibited significantly decreased androgen-stimulated enhancer activities compared with ARBE1. These results suggest that nucleotide identity at position +5 and/or +6 of agonist-liganded ARBEs plays an essential role in the regulation of differential AR binding and transactivation within agonist-responsive regions.
Characterization of the epigenetic and genetic features of the four types of agonist-liganded ARBE locations
Since histone modification, nucleosome positioning, DNase I hypersensitivity (DHS), and collaborating factor binding can have a significant effect on AR binding (Chen et al, 2010; Augello et al, 2011; He et al, 2012), we next characterized the epigenetic and genetic features of agonist-responsive locations containing the four types of precisely defined agonist-liganded ARBEs (Supplementary Table S4 and Supplementary Fig S4A).
We first performed mononucleosome-resolution histone mark (H3K4me1, H3K4me3, H3K9me3, and H3K27me3) ChIP-seq assays in LNCaP cells (Supplementary Table S1). Analysis of these histone mark ChIP-seq data and AR ChIP-exo data found that agonist-responsive locations were generally associated with high levels of permissive histone marks H3K4me1 and H3K4me3, and low levels of repressive histone marks H3K9me3 and H3K27me3 (Fig4A and Supplementary Fig S4B), suggesting that in general, agonist-liganded ARBEs are located within accessible chromatin.
Figure 4.

- Aggregated sequencing tag distribution of AR ChIP-exo and H3K4me2 MNase ChIP-seq around the four precisely defined ARBEs. ChIP-exo density plot is shown as forward (blue) and reverse (red) strands, respectively. H3K4me2 signal is shown in green. The window indicates ± 500 bp regions from the ARBE motif (0).
- Partitional clustering of the 4 types of ARBE locations based on dynamic signal shifting of H3K4me2 affected by DHT treatment.
- Venn diagram of DHS sites and ARBEs. Right panel shows DNase-seq tag distribution around ARBEs within ± 1 kb.
- Profile of all clusters of each type of ARBE associated with FOXA1 motifs.
- Conservation profile of the four types of ARBEs calculated by phyloP.
- SNP frequency comparison between each type of ARBE and whole-genome control. **P < 1E-8, *P < 1E-5.
Since previous studies found that androgen-induced H3K4me2-marked nucleosome repositioning determines AR binding on nucleosome-depleted regions (NDRs) (He et al, 2010, 2012), we next examined H3K4me2 signal distributions in the presence or absence of DHT in ARBE regions by re-analyzing mononucleosome-resolution H3K4me2 ChIP-seq data in LNCaP cells (He et al, 2010). Consistent with previous studies (He et al, 2010, 2012), the aggregated H3K4me2 signal decreased at the ARBE1, ARBE3, and ARBE4 motif locations and increased at the motif-flanking regions following DHT treatment (Fig4A), indicating that DHT treatment reduces H3K4me2 marked nucleosome density at these precisely defined ARBE motif locations to facilitate AR binding. Surprisingly, although H3K4me2 tag density was also reduced at ARBE2 motif locations after DHT treatment, a H3K4me2 peak was observed at the center of ARBE2 locations (Fig4A), indicating that AR binds to at least a part of ARBE2 motif locations despite high nucleosome occupancy. Further partitional clustering analysis of the distribution of H3K4me2 signals around ARBE2 locations identified a cluster of H3K4me2 signals located at the center of the ARBE2 locations in the presence and absence of DHT (Fig4B and Supplementary Fig S4E), confirming that a group of ARBE2 motifs reside on nucleosomes. Surprisingly, approximately one-third each of ARBE1, ARBE3, or ARBE4 were also situated on nucleosomes (Fig4B and Supplementary Fig S4E), although these three types of ARBEs were more distant from the center of nucleosomes compared to ARBE2 (data not shown). Analysis of mononucleosome-resolution H3K4me1 and H3K4me3 ChIP-seq data confirmed that a portion of all four types of ARBEs was located on nucleosomes (Supplementary Fig S4F). Collectively, these data suggest that the four types of precisely defined agonist-liganded ARBEs are located both on NDRs and nucleosomes.
As recent studies suggest that nucleosome density may not always be correlated with chromatin accessibility (Burd et al, 2012; He et al, 2012), we next examined whether the four types of nucleosomal ARBEs and NDR ARBEs reside on accessible chromatin measured by DNase-seq (He et al, 2012). Analysis of androgen-stimulated LNCaP DHS sites revealed that 72.4% of ARBEs overlap with DHS sites (Fig4C), suggesting that most ARBEs are on accessible chromatin regions. Interestingly, similarly high levels of DHS signals were observed in nucleosomal ARBE (cluster 2) and NDR ARBE locations (clusters 1 and 3) (Supplementary Fig S4G), suggesting that both nucleosomal and NDR ARBEs are located on highly accessible chromatin.
To address whether each type of ARBE was differentially associated with AR cofactor motifs, we precisely defined FOXA1 motifs using the same method employed in the AR ChIP-exo data analysis (Supplementary Fig S4H–K). Although, in general, all four types of precisely defined agonist-liganded ARBEs were highly associated with FOXA1 motifs that have actual FOXA1 binding as identified in the FOXA1 ChIP-exo dataset (Supplementary Fig S2O–Q), less ARBE2 coexisted with FOXA1 motifs compared to the other three ARBE types (Fig4D), indicating that AR binding to ARBE2 may be functionally less dependent on FOXA1 than AR binding to ARBE1, 3, and 4.
We next investigated the functional significance of these ARBEs. Sequence analysis revealed high degrees of conservation within all four ARBEs but not in surrounding regions (Fig4E and Supplementary Fig S4L), supporting functional roles of these ARBEs. Because SNPs in ARBEs may affect AR binding and subsequent expression of AR target genes involved in prostate carcinogenesis, we next examined the coincidence of ARBEs with SNPs. SNPs from dbSNP build 137 occurred in all four types of ARBEs more frequently than in genome controls (Fig4F and Supplementary Fig S4M). Importantly, in addition to the overlap of precisely defined ARBEs with SNPs in known prostate cancer-associated regions (PCaR) (Supplementary Fig S4N), the high frequency of SNPs overlapping ARBEs outside known PCaR (Supplementary Fig S4O) may help identify novel areas of the genome impacting prostate development and function that may provide future insight into cancer risk.
Antagonist-liganded AR does not bind to agonist-liganded ARBEs
Having established that DHT-liganded AR binds to four types of ARBEs, we next asked whether antagonist-bound AR competes with DHT-bound AR to recognize these agonist-liganded ARBEs. While DHT alone significantly enhanced AR binding to the four types of agonist-liganded ARBEs (Figs1 and 2), neither bicalutamide nor enzalutamide alone augmented AR recruitment to these ARBEs (Fig5A). In addition, in the presence of 10 μM bicalutamide or enzalutamide, DHT-induced AR binding was completely abolished (Figs1 and 5A), consistent with a previous study demonstrating that 10 μM bicalutamide or enzalutamide is able to completely compete with DHT to bind AR in LNCaP-derived cells (Tran et al, 2009). As an example, ChIP-exo analysis revealed that either antagonist alone or antagonist combined with DHT failed to enhance AR binding to the KLK3 enhancer ARBE (Fig5B). Although standard ChIP analysis found that bicalutamide was not able to completely inhibit DHT-induced AR binding to the KLK3 enhancer region (Fig5C), the observations that bicalutamide completely abolished DHT-stimulated endogenous gene and reporter gene activation (Fig5D and E) suggest that bicalutamide may prevent direct binding of AR to agonist-liganded ARBEs but not indirect binding of AR to chromatin through interactions with other TFs within the AR complex.
Figure 5.

- Heat map showing raw tags distribution over the four types of agonist-responsive ARBEs in LNCaP cells treated with vehicle, bicalutamide (10 μM), bicalutamide plus DHT (10 nM), enzalutamide (10 μM), or enzalutamide plus DHT (10 nM). The order of sequences in each type of ARBE is the same as the order of sequences shown in Fig2A.
- UCSC genome browser views of sequencing data at KLK3 locus under different conditions.
- Regular ChIP analysis of AR on KLK3 enhancer. LNCaP cells were treated with or without agonist and antagonist for 4 h. The data are presented as the fold enrichment over IgG (mean ± SD,n = 3).
- Quantitative RT-PCR was performed to assess KLK3 mRNA levels under agonist or antagonist treatments. The data are the mean of triplicates ± SD.
- Eight agonist-responsive ARBE reporter constructs used in Fig3B were transiently transfected into LNCaP cells. Cells were stimulated with vehicle, DHT (100 nM), bicalutamide (10 μM), bicalutamide plus DHT, enzalutamide (10 μM), or enzalutamide plus DHT for 16–24 h, and luciferase activities were measured. The results are presented as the mean ± SD of the quadruplicate transfections.
Ligand-induced AR motif switching is associated with distinct transcriptional outcomes
Unexpectedly, we found that bicalutamide or enzalutamide but not DHT enhanced the binding of AR to a distinct group of genomic locations (Fig1). Further analysis of these 3,292 antagonist-responsive regions identified 596 locations preferentially bound by bicalutamide-liganded AR, 1,364 locations preferentially bound by enzalutamide-liganded AR, and 1,332 locations where AR binding was induced by both antagonists (Fig6A). Interestingly, while DHT treatment decreased nucleosome density at agonist-liganded ARBE locations to facilitate AR binding (Fig4A), nucleosome occupancy at antagonist-liganded AR binding locations was already very low in the absence of DHT (Supplementary Fig S5A–D). In the presence of DHT, in contrast to the phased nucleosomes neighboring agonist-liganded ARBEs (Fig4B), the vehicle treatment-associated well-positioned nucleosomes flanking antagonist-liganded ARBEs were positioned randomly (Fig6B). Importantly, in the absence of DHT, antagonist-liganded ARBE locations showed even higher chromatin accessibility and FOXA1 binding compared to agonist-liganded ARBE locations (Supplementary Fig S5E and F).
Figure 6.

- Heat map showing the signal intensity of AR binding in LNCaP cells treated with DHT, bicalutamide, and enzalutamide, respectively. Numbers indicate the antagonist-responsive AR locations in each category.
- Clustering of the antagonist-responsive AR locations based on dynamic signal shifting of H3K4me2 affected by DHT treatment.
- The aggregated tag density is shown on the forward (blue) and reverse (red) strands, separately. The bottom panel represents the bound motif sequences found in the antagonist-responsive AR locations. Antagonist-liganded ARBE is also shown.
- EMSA was performed to validate specific AR binding to antagonist-liganded ARBEs. Biotin-labeled wild-type (WT) or mutated (Mut) probes were incubated with same amounts of nuclear extract from LNCaP cells treated with bicalutamide or enzalutamide. Arrow indicates the position of the shifted specific probe. Four probes (M1–M4) were randomly selected. Quantification of EMSA gel bands shows that antagonists increase the in vitro binding to 1.7–3.8-fold compared to the vehicle.
- Top panel represents overlap between genes within 20 kb of the bicalutamide-responsive AR locations and enzalutamide-responsive AR locations. Bottom panel indicates microarray analysis of genes around enzalutamide-responsive AR locations following treatment with DHT or enzalutamide in LNCaP cells.
- UCSC genome browser views of sequencing data at CPEB4 locus under different conditions. The blue region represents antagonist-responsive AR location, while the two pink regions indicate agonist-responsive AR locations.
- AR ChIP-exo library validation on antagonist-responsive and agonist-responsive AR locations referred to (F). The data are the mean of triplicates ± SD.
- mRNA levels of CPEB4 were examined in cells treated with or without DHT and enzalutamide. The data are the mean of triplicates ± SD.
- Silencing of CPEB4 enhanced the inhibitory effects of enzalutamide in LNCaP cells. LNCaP cells were transfected with a control siRNA or siCPEB4. Cells were then treated with vehicle or 1 μM enzalutamide, and cell numbers were determined on day 3 with a direct viable cell count assay. The data are the mean of triplicates ± SD.
To investigate whether antagonist-liganded AR binds to the four types of agonist-liganded ARBEs, we next performed motif analysis in antagonist-responsive locations using our border pattern-based motif defining approach. Surprisingly, no motif resembling any agonist-liganded ARBE was found to be enriched in these antagonist-responsive regions (Supplementary Table S2). Instead, a distinctly different motif from agonist-liganded ARBEs, 5′-NCHKGNnndDCHDGN (Fig6C), is the most significantly enriched motif protected from exonuclease digestion except for FOXA1 motif. To confirm AR binding to antagonist-liganded ARBEs, electrophoretic mobility shift assays (EMSA) were performed using probes designed from four randomly selected antagonist-responsive regions with different binding density (M1–M4). Both bicalutamide and enzalutamide enhanced the specific interaction between AR and antagonist-liganded ARBEs (Fig6D and Supplementary Fig S5G), indicating that antagonist-bound AR can clearly recognize these novel ARBEs.
To investigate whether the novel antagonist-liganded ARBE regulates antagonist-dependent genes, we re-analyzed gene expression profiles in LNCaP cells treated with enzalutamide or DHT (Guerrero et al, 2013). Interestingly, the common antagonist-liganded and enzalutamide-liganded ARBE locations regulated a group of genes (e.g. CPEB4,RANBP9, and PKIB) that exhibited inverse responsiveness to enzalutamide or DHT treatment (Fig6E and Supplementary Fig S5H–K). For example, in three enhancer regions of the CPEB4 gene involved in solid tumor progression (D'Ambrogio et al, 2013), enzalutamide-liganded AR binding to an antagonist-liganded ARBE correlated with enhanced CPEB4 mRNA expression, while DHT-liganded AR bound to two agonist-liganded ARBEs with apparent repressive functionality as evidenced by reduced CPEB4 mRNA expression (Fig6F–H and Supplementary Fig S5I–K). Importantly, silencing of CPEB4,RANBP9, and PKIB markedly enhanced the cell growth inhibitory effects of enzalutamide (Fig6I and Supplementary Fig S5L). Taken together, these results demonstrate that enzalutamide regulates expression of a group of genes through enzalutamide-dependent AR binding rather than its competition with DHT, thus compromising the ability of enzalutamide to inhibit prostate cancer growth.
Agonist- and antagonist-liganded ARBEs regulate genes involved in the onset and progression of prostate cancer
To further examine the clinical relevance of agonist- and antagonist-liganded ARBEs identified from LNCaP cells, we performed AR ChIP-exo assays using samples of four primary malignant prostate tumors and two paired non-malignant adjacent tissues (NATs) obtained at prostatectomy (two additional paired NAT samples failed our quality control evaluation and were not used; Fig7A and Supplementary Table S5). As the heterogeneous nature of prostate cancer and unsynchronized AR binding in prostate tissues resulted in lower AR ChIP-exo signal/noise ratio in prostate tissues versus prostate cancer cell lines (data not shown), we used a strategy to initially identify AR-enriched locations followed by the identification of ARBEs in these locations in prostate tumors and NATs. Comparison between clinical tissues indicated that the two NATs were quite similar, whereas the four prostate tumors were heterogeneous (Supplementary Fig S6A). Using the differential enrichment analysis, we identified 1,715 enhanced AR binding locations in prostate tumors versus NATs, 1,262 common AR binding locations, and 147 enhanced AR binding locations in NATs compared to prostate tumors (Fig7B and Supplementary Fig S6B–E). In LNCaP cells, AR was strongly recruited to the vast majority of tumor enhanced and common AR binding locations but not to NAT enhanced AR binding locations (Fig7B and Supplementary Fig S6F), confirming the AR binding specificity in prostate tumors versus NATs. We next used border and motif alignments to identify agonist-liganded ARBEs and FOXA1 motifs in tumor enhanced AR binding locations in a representative pair of prostate tumor and NAT. This identified 2,050 ARBE1, 236 ARBE2, 367 ARBE3, and 420 ARBE4 including canonical full-length ARBEs, non-canonical full-length ARBEs, and half-site-like ARBEs as well as 2,173 FOXA1 motifs (Supplementary Fig S6G and H). The agonist-liganded ARBEs and FOXA1 motifs were also identified in common AR binding locations (Supplementary Fig S6I and J). Interestingly, all four types of agonist-bound ARBEs resided less frequently in promoter regions in tumor enhanced AR versus common AR binding locations (Supplementary Fig S6K), indicating that distal but not proximal agonist-liganded ARBEs may contribute more to prostate carcinogenesis.
Figure 7.

- Immunohistochemical (IHC) detection of AR in four malignant prostate tumors and two paired NATs. Representative microphotographs of H&E staining showed normal prostatic gland (NATs) and poorly differentiated adenocarcinoma cells. IHC analysis indicated heterogeneous AR expression among patients. Magnification, 40×. N1a and M3a were collected from the same patient ((Supplementary Table S5). N2b and M4b were gathered from another patient ((Supplementary Table S5).
- Tissue AR ChIP-exo raw signal intensity showing 1,715 enhanced AR binding locations in malignant prostate tumors (M) compared to NATs (N). ChIP-exo data of LNCaP (+DHT) is plotted around the same locations.
- Pathways and networks constructed using genes within 50 kb of AR binding locations enhanced in prostate tumors. Nodes and corresponding pathways are extracted according to interaction annotation. Literature-based network is configured as PROSTATIC NEOPLASMS (Genomatix Mining).
- Oncomine analysis showing median rank for genes in the PROSTATIC NEOPLASMS network across 16 analyses of overexpression in prostate cancer (PCa) versus normal. The right column represents fold change in gene expression detected by RNA-seq in the LNCaP cell line after DHT treatment (Log2 FC DHT/Vehicle, P < 0.01).
- Survival curves were generated based on Kaplan–Meier analysis. For each of the four clinical datasets, up to one-third of genes in the PROSTATIC NEOPLASMS network was selected based on gene expression level. These genes were then used to stratify patients. The P-values were calculated by log-rank test.
To investigate whether the genes near tumor enhanced AR binding locations are associated with prostate cancer, we performed an integrated network analysis (Genomatix Pathway System) of all genes with transcription start sites (TSS) within 50 kb of such AR binding locations. We performed this analysis at the location level but not the motif level as most AR binding locations contain multiple ARBEs (data not shown), preventing an evaluation of ARBE type-specific impacts on global gene regulation. Interestingly, the most significantly enriched gene set was “prostatic neoplasms” (117 genes) or “neoplasms, hormone dependent” (139 genes) (Fig7C and data not shown). Importantly, Oncomine analysis revealed that the vast majority of genes in either gene set were overexpressed in prostate cancers versus normal prostates in at least 1 out of 16 published gene expression datasets (Fig7D and Supplementary Table S6). In addition, survival analysis demonstrated that a portion of these genes can predict survival of prostate cancer patients (Fig7E and Supplementary Table S7). These results suggest that tumor enhanced AR binding events are associated with the onset and progression of prostate cancer. To ask whether the 117 genes in the “prostatic neoplasms” set can be regulated by androgen, we performed a RNA-seq assay in LNCaP cells treated with 10 nM DHT or vehicle for 4 h. This identified 55 (47.0%) DHT-upregulated (e.g. KLK3,mTOR,BIRC5 and BCL2L1) and 16 (13.7%) DHT-downregulated genes (e.g. ESRRG and VAV3) (P < 0.01) (Fig7D). We next performed a canonical pathway analysis to study the functional and physical interactions among the 117 genes in the “prostatic neoplasms” set. This not only identified AR and FOXA1 as being central to the gene network but also, and more interestingly, discovered DHT-regulated genes mTOR,BIRC5, and BCL2L1 as key hub genes (Fig7C and Supplementary Fig S6L and M). Analysis of 139 genes in the “neoplasms, hormone-dependent” set revealed similar results (data not shown). While it is well known that the mTOR signaling pathway is activated in prostate cancer through PTEN loss and/or androgen stimulation (Xu et al, 2006; Shen & Abate-Shen, 2010), we found that AR directly regulated the mTOR gene through enhanced binding to a half-site-like agonist-liganded ARBE3 and a half-site-like agonist-liganded ARBE4 6.2 kb away from the TSS of this gene in prostate tumors versus paired NATs or in LNCaP cells treated with DHT versus vehicle (Fig3B [chr.1: 11316430] and Supplementary Fig S6L and data not shown). Importantly, analysis of The Cancer Genome Atlas (TCGA) prostate cancer RNA-seq data generated from matched tumor and “normal” tissues found that the expression of mTOR,BIRC5, and BCL2L1 genes was significantly higher in 30 prostate tumors compared with “normal” tissues (Supplementary Fig S6N). Together, these results suggest that AR binds to agonist-liganded ARBEs to upregulate three hub target genes contributing to prostate carcinogenesis.
Finally, we investigated whether antagonist-liganded ARBEs identified in LNCaP cells were recognized by AR in prostate cancer samples. Tissue AR ChIP-exo analysis revealed higher binding of AR to these antagonist-liganded ARBE locations in prostate tumors compared with NATs (Supplementary Fig S6O and P). Interestingly, Oncomine analysis found that these antagonist-liganded ARBE locations were associated with genes highly expressed in prostate cancer but not in another eight cancer types (Supplementary Fig S6Q and Supplementary Table S7). These genes were enriched in VEGF, AKT, and EGFR1 signaling pathways and were able to predict the survival of prostate cancer patients (Supplementary Fig S6R and Supplementary Table S7).
Discussion
By performing AR ChIP-exo assays in a prostate cancer cell model, prostate tumors, and NATs, we precisely defined four types of agonist-liganded ARBEs in the human genome. Several lines of evidence suggest that AR binds to these elements to regulate androgen-dependent transcription in vivo. First, these motifs protected from exonuclease digestion either resemble AREs in the TF binding databases or are similar to each other (Supplementary Fig S3A). Second, these motifs have common AR-specific exonuclease borders (Fig2A and Supplementary Fig S2O), and the distances between the most conserved nucleotides (i.e. +1G, +3A, and +4C) in these motifs and the common borders are fixed (Fig2B). Notably, those protected motifs that do not resemble ARBEs 1–4 have no AR-specific common borders and/or no conserved nucleotides with fixed distance to the borders (e.g. FOXA1 motifs and data not shown), suggesting that such motifs are not agonist-liganded ARBEs. Third, canonical full-length agonist-liganded ARBEs are enriched in these protected motif regions but not in regions within or outside of AR ChIP-seq peaks regardless of border signals (Supplementary Fig S3H–J). Fourth, these androgen-liganded ARBE regions show androgen- and ARBE-dependent enhancer activities (Fig3 and Supplementary Fig S6M). Unexpectedly, we found that antagonists (bicalutamide or enzalutamide) trigger AR binding to a distinct group of genomic locations (Figs1 and 6A). While our border pattern-based motif defining approach failed to identify any type of agonist-liganded ARBE within these locations (Supplementary Table S2), it discovered a distinct antagonist-AR-bound motif (Fig6D and Supplementary Fig S5G) with border signals (Fig6C). A recent study has demonstrated that both bicalutamide and enzalutamide treatment are able to induce nuclear translocation of AR in LNCaP cells (Myung et al, 2013). Indeed, the fact that antagonist-liganded AR translocates to the nucleus allows AR to recognize an antagonist-liganded ARBE. To our knowledge, no evidence exists to show that a TF is able to bind two motifs on chromatin. Although a previous study demonstrated that estrogens and anti-estrogens induce estrogen receptor (ER) binding to some different binding locations (Welboren et al, 2009), those locations were enriched with the same binding motif, the estrogen responsive element (ERE), and not different motifs as we have shown in our study. It is also important to point out that the concept that anti-estrogens are able to induce ER binding to unique locations has been challenged by a recent comprehensive ER high-depth ChIP-seq study (Hurtado et al, 2011), which failed to find unique anti-estrogen-stimulated ER binding events (and novel ER motifs). In addition, while previous studies on glucocorticoid receptor (GR) clearly demonstrated that single or multiple nucleotide changes within the same motif (i.e., glucocorticoid responsive element, GRE) affect DNA binding affinities of the same ligand-bound GR (Meijsing et al, 2009; Thomas-Chollier et al, 2013), our study stands alone by demonstrating that different ligands cause AR binding to distinctly different motifs. Importantly, such motif switching leads to distinct transcriptional outcomes (Fig6E–H and Supplementary Fig S5H–K). Given that TFs bind to DNA through interactions between complementary conformations, and in view of the recent findings that NR LBDs cooperate with DBDs to achieve DNA binding (Chandra et al, 2008, 2013), we hypothesize that different ligands induce NR conformational changes that account for NR DNA binding motif switching. Future solving of high-resolution full-length NR crystal structures with different ligands will help test this hypothesis.
Although our findings that enzalutamide completely inhibits androgen-induced binding to the four types of ARBEs (Fig5) support the prevailing idea that enzalutamide functions as a pure AR antagonist in androgen-dependent LNCaP cells (Tran et al, 2009), two lines of evidence suggest that enzalutamide acts as a partial transcriptional agonist in LNCaP cells. First, enzalutamide enhances AR binding to over 3,000 antagonist-liganded ARBEs (Figs1 and 6A). Second, these antagonist-liganded ARBEs are associated with a group of genes exhibiting inverse responsiveness to enzalutamide and DHT (Fig6E–H and Supplementary Fig S5H–K), which may reduce the cell growth inhibitory effects of enzalutamide (Fig6I and Supplementary Fig S5L). It is noteworthy to point out that this partial transcriptional agonist function of enzalutamide in LNCaP cells with short-term treatment (4 h) is completely different from the recently reported agonist function of enzalutamide in long-term (> 3 months) treated enzalutamide-resistant LNCaP cells (Balbas et al, 2013; Joseph et al, 2013; Korpal et al, 2013) and from the enzalutamide resistance conferred by GR in LNCaP/AR xenografts treated with long-term (> 20 weeks) enzalutamide (Arora et al, 2013). Nonetheless, the findings that enzalutamide functions as a partial transcriptional agonist suggest that development of improved hormonal therapies should consider targeting enzalutamide-regulated oncogenes (e.g. CPEB4 [Fig6G]) during enzalutamide treatment.
Mapping the SR cistromes in the human genome is important for identifying critical cis-regulatory elements contributing to carcinogenesis of hormone-related cancers. Although most such studies were performed in cell line models, recent studies have begun to use ChIP-seq to define ER and AR cistromes in human cancer samples and non-cancer tissues (Ross-Innes et al, 2012; Sharma et al, 2013). Unfortunately, mapping these cistromes in non-cancer tissues has been largely unsuccessful, possibly due to the difficulty of using the relatively low-sensitivity/low-resolution standard ChIP-seq assay in detecting the relatively weak SR binding in these non-cancer tissues. It is therefore unknown whether alteration of SR binding and the resultant aberrant target gene expression lead to the onset of hormone-related cancers. In this study, we used ChIP-exo to identify 1,715 enhanced AR binding locations in prostate tumors versus NATs (Fig7B). As previous studies have found that chromatin accessibility and collaborating factor binding determine cell type or tumor stage-selective binding of specific transcription factors (John et al, 2011; Ross-Innes et al, 2012), we hypothesize that these 1,715 regions in NATs show lower chromatin accessibility and/or binding of AR collaborating factors [e.g. FOXA1 and GATA2 (Wang et al, 2007; Wu et al, 2014)] than in prostate tumors, thus preventing strong AR binding. Future analysis of DNase I hypersensitivity and FOXA1/GATA2 ChIP-exo using prostate tissues will assist in the validation this hypothesis. Importantly, integrative experimental and bioinformatic analyses of these 1,715 AR locations found that AR binds to one or more precisely defined agonist-liganded ARBE types to upregulate the key hub genes mTOR (ARBE3 and ARBE4), BIRC5 (ARBE2), and BCL2L1 (ARBE1) involved in prostate cell proliferation and survival (Fig7C and Supplementary Fig S6L and M), leading to the overexpression of these genes contributing to the onset and progression of prostate cancer (Fig7D and E). These findings reveal an important molecular mechanism by which AR drives prostate carcinogenesis. In addition to the identification of agonist-liganded ARBEs in prostate tumors, we also confirmed that antagonist-liganded ARBEs exist in prostate tumors, which are associated with a group of genes highly overexpressed in prostate cancer and relevant to prostate cancer prognosis (Supplementary Fig S6Q and R and Supplementary Table S7). The observation that AR is differentially recruited to these antagonist-liganded ARBEs among different patients (Supplementary Fig S6O) may prove valuable in stratifying patients by expected response to hormonal therapies based on AR binding affinities to antagonist-liganded ARBEs.
Materials and Methods
ChIP-exo, ChIP-seq, native MNase ChIP-seq, and non-poly(A) selection, directional, ligation-free paired-end RNA-seq
For AR ChIP-exo and FOXA1 ChIP-exo, LNCaP cells were exposed to 10 nM DHT or vehicle combined with or without 10 μM bicalutamide or 10 μM enzalutamide for 4 h. For human prostate tissue AR ChIP-exo, fresh frozen tissues were used. ChIP-exo was performed as previously described (Rhee & Pugh, 2011) with modifications (see Supplementary Fig S1 and Supplementary Experimental Procedures). Paired-end sequencing was performed using Illumina HiSeq 2000 at the Ohio State University Comprehensive Cancer Center (OSUCCC) sequencing core. Details on ChIP-seq and RNA-seq are available online in Supplementary Experimental Procedures.
ChIP-exo peak, border, and border pattern-based motif analysis, conservation, SNP analysis, and RNA-seq analysis
The BELT program (Lan et al, 2011) was used with Read 2 to identify AR binding locations (Supplementary Fig S1). The MALD model was applied for high-resolution border detection using Read 1 (Supplementary Fig S1). The enriched DNA motifs were identified by a novel border pattern-based motif defining approach (see Supplementary Experimental Procedures). Details on conservation, SNP, and RNA-seq analysis are available online in Supplementary Experimental Procedures.
Reporter gene assays, electrophoretic mobility shift assay (EMSA), real-time RT–PCR, immunohistochemistry (IHC), RNA interference, and cell proliferation assay
Reporter gene assays (Chen et al, 2011), EMSA (Wang et al, 2004), real-time RT-PCR (Chen et al, 2011), RNA interference, and cell proliferation assay (Chen et al, 2011) were performed as previously described with modifications (see Supplementary Experimental Procedures). Details on IHC analysis are available online in Supplementary Experimental Procedures.
Accession numbers
The ChIP-exo, ChIP-seq, and RNA-seq datasets can be accessed at the NCBI Gene Expression Omnibus (GEO) (accession numbers: GSE43791).
Acknowledgments
We thank Drs. Michael Ostrowski, Gustavo Leone, Jiyan Ma, and Jonathan Pritchard for critically reviewing the manuscript, A. Selen Yilmaz from the OSUCCC Biomedical Informatics Shared Resource for generating fastq files and distribution of the sequencing data, and TCGA (The Cancer Genome Atlas) for agreeing to analyze TCGA prostate cancer RNA-seq data. Supported by NIH grants R01CA151979 (to Q.W., W.L., S.K.C., D.L.Z., S.L.), U54CA113001 (to Q.W., T.H-M.H, K.P.N., V.X.J.), T32CA009338 (to C.G.), DOD grant W81XWH-12-1-0615 (to Q.W., W.L., S.K.C.), 2011 V Foundation V Scholar Award (to Q.W.), OSUCCC Solid Tumor Biology Program (to Q.W.), and The Ohio State University and Howard Hughes Medical Institute MED into GRAD Scholars Program Fellowship (to B.S.).
Author contributions
ZC and QW designed the study, analyzed, and interpreted the data. ZC performed ChIP-exo, ChIP-seq, MNase ChIP-seq, RNA-seq, ChIP, reporter gene assays, EMSA, RT-PCR, and cell proliferation assay experiments. For ChIP-exo data analysis, XL and VXJ applied a mixture asymmetric-Laplace distribution (MALD) model to detect ChIP-exo borders, and ZC developed a border pattern-based motif defining approach to precisely define ARBE. ZC performed analysis of microarray, ChIP-seq, and MNase ChIP-seq data. ZC analyzed gene network, clinical association, and survival. DW generated plasmids for reporter gene assays and performed experiments presented in for Fig3D and Supplementary Fig S5I, K. JMT-A, CG, DLZ, JH, and SKC collected clinical samples, performed, and reviewed pathological analysis and IHC analysis. PSY performed high-throughput sequencing. XL and SL performed SNP analysis. ZY performed conservation analysis. LW, JC, and WL performed RNA-seq analysis. ZC and QW wrote the manuscript with input from BS, VXJ, WL, KPN, and TH-MH.
Conflict of interest
The authors declare that they have no conflict of interest.
Supporting Information
Supplementary Information
Supplementary Table S2
Supplementary Table S4
Review Process File
References
- Arora VK, Schenkein E, Murali R, Subudhi SK, Wongvipat J, Balbas MD, Shah N, Cai L, Efstathiou E, Logothetis C, Zheng D, Sawyers CL. Glucocorticoid receptor confers resistance to antiandrogens by bypassing androgen receptor blockade. Cell. 2013;155:1309–1322. doi: 10.1016/j.cell.2013.11.012. [DOI] [PMC free article] [PubMed] [Google Scholar]
- Augello MA, Hickey TE, Knudsen KE. FOXA1: master of steroid receptor function in cancer. EMBO J. 2011;30:3885–3894. doi: 10.1038/emboj.2011.340. [DOI] [PMC free article] [PubMed] [Google Scholar]
- Badis G, Berger MF, Philippakis AA, Talukder S, Gehrke AR, Jaeger SA, Chan ET, Metzler G, Vedenko A, Chen X, Kuznetsov H, Wang CF, Coburn D, Newburger DE, Morris Q, Hughes TR, Bulyk ML. Diversity and complexity in DNA recognition by transcription factors. Science. 2009;324:1720–1723. doi: 10.1126/science.1162327. [DOI] [PMC free article] [PubMed] [Google Scholar]
- Balbas MD, Evans MJ, Hosfield DJ, Wongvipat J, Arora VK, Watson PA, Chen Y, Greene GL, Shen Y, Sawyers CL. Overcoming mutation-based resistance to antiandrogens with rational drug design. Elife. 2013;2:e00499. doi: 10.7554/eLife.00499. [DOI] [PMC free article] [PubMed] [Google Scholar]
- Burd CJ, Ward JM, Crusselle-Davis VJ, Kissling GE, Phadke D, Shah RR, Archer TK. Analysis of chromatin dynamics during glucocorticoid receptor activation. Mol Cell Biol. 2012;32:1805–1817. doi: 10.1128/MCB.06206-11. [DOI] [PMC free article] [PubMed] [Google Scholar]
- Chandra V, Huang P, Hamuro Y, Raghuram S, Wang Y, Burris TP, Rastinejad F. Structure of the intact PPAR-gamma-RXR- nuclear receptor complex on DNA. Nature. 2008;456:350–356. doi: 10.1038/nature07413. [DOI] [PMC free article] [PubMed] [Google Scholar]
- Chandra V, Huang P, Potluri N, Wu D, Kim Y, Rastinejad F. Multidomain integration in the structure of the HNF-4alpha nuclear receptor complex. Nature. 2013;495:394–398. doi: 10.1038/nature11966. [DOI] [PMC free article] [PubMed] [Google Scholar]
- Chen Z, Wang L, Wang Q, Li W. Histone modifications and chromatin organization in prostate cancer. Epigenomics. 2010;2:551–560. doi: 10.2217/epi.10.31. [DOI] [PMC free article] [PubMed] [Google Scholar]
- Chen Z, Zhang C, Wu D, Chen H, Rorick A, Zhang X, Wang Q. Phospho-MED1-enhanced UBE2C locus looping drives castration-resistant prostate cancer growth. EMBO J. 2011;30:2405–2419. doi: 10.1038/emboj.2011.154. [DOI] [PMC free article] [PubMed] [Google Scholar]
- D'Ambrogio A, Nagaoka K, Richter JD. Translational control of cell growth and malignancy by the CPEBs. Nat Rev Cancer. 2013;13:283–290. doi: 10.1038/nrc3485. [DOI] [PubMed] [Google Scholar]
- Denayer S, Helsen C, Thorrez L, Haelens A, Claessens F. The rules of DNA recognition by the androgen receptor. Mol Endocrinol. 2010;24:898–913. doi: 10.1210/me.2009-0310. [DOI] [PMC free article] [PubMed] [Google Scholar]
- Furey TS. ChIP-seq and beyond: new and improved methodologies to detect and characterize protein-DNA interactions. Nat Rev Genet. 2012;13:840–852. doi: 10.1038/nrg3306. [DOI] [PMC free article] [PubMed] [Google Scholar]
- Guerrero J, Alfaro IE, Gomez F, Protter AA, Bernales S. Enzalutamide, an androgen receptor signaling inhibitor, induces tumor regression in a mouse model of castration-resistant prostate cancer. Prostate. 2013;73:1291–1305. doi: 10.1002/pros.22674. [DOI] [PubMed] [Google Scholar]
- Hardison RC, Taylor J. Genomic approaches towards finding cis-regulatory modules in animals. Nat Rev Genet. 2012;13:469–483. doi: 10.1038/nrg3242. [DOI] [PMC free article] [PubMed] [Google Scholar]
- He HH, Meyer CA, Shin H, Bailey ST, Wei G, Wang Q, Zhang Y, Xu K, Ni M, Lupien M, Mieczkowski P, Lieb JD, Zhao K, Brown M, Liu XS. Nucleosome dynamics define transcriptional enhancers. Nat Genet. 2010;42:343–347. doi: 10.1038/ng.545. [DOI] [PMC free article] [PubMed] [Google Scholar]
- He HH, Meyer CA, Chen MW, Jordan VC, Brown M, Liu XS. Differential DNase I hypersensitivity reveals factor-dependent chromatin dynamics. Genome Res. 2012;22:1015–1025. doi: 10.1101/gr.133280.111. [DOI] [PMC free article] [PubMed] [Google Scholar]
- Heinlein CA, Chang C. Androgen receptor in prostate cancer. Endocr Rev. 2004;25:276–308. doi: 10.1210/er.2002-0032. [DOI] [PubMed] [Google Scholar]
- Helsen C, Dubois V, Verfaillie A, Young J, Trekels M, Vancraenenbroeck R, De Maeyer M, Claessens F. Evidence for DNA-binding domain–ligand-binding domain communications in the androgen receptor. Mol Cell Biol. 2012a;32:3033–3043. doi: 10.1128/MCB.00151-12. [DOI] [PMC free article] [PubMed] [Google Scholar]
- Helsen C, Kerkhofs S, Clinckemalie L, Spans L, Laurent M, Boonen S, Vanderschueren D, Claessens F. Structural basis for nuclear hormone receptor DNA binding. Mol Cell Endocrinol. 2012b;348:411–417. doi: 10.1016/j.mce.2011.07.025. [DOI] [PubMed] [Google Scholar]
- Helsen C, Claessens F. Looking at nuclear receptors from a new angle. Mol Cell Endocrinol. 2014;382:97–106. doi: 10.1016/j.mce.2013.09.009. [DOI] [PubMed] [Google Scholar]
- Hurtado A, Holmes KA, Ross-Innes CS, Schmidt D, Carroll JS. FOXA1 is a key determinant of estrogen receptor function and endocrine response. Nat Genet. 2011;43:27–33. doi: 10.1038/ng.730. [DOI] [PMC free article] [PubMed] [Google Scholar]
- John S, Sabo PJ, Thurman RE, Sung MH, Biddie SC, Johnson TA, Hager GL, Stamatoyannopoulos JA. Chromatin accessibility pre-determines glucocorticoid receptor binding patterns. Nat Genet. 2011;43:264–268. doi: 10.1038/ng.759. [DOI] [PMC free article] [PubMed] [Google Scholar]
- Jolma A, Yan J, Whitington T, Toivonen J, Nitta KR, Rastas P, Morgunova E, Enge M, Taipale M, Wei G, Palin K, Vaquerizas JM, Vincentelli R, Luscombe NM, Hughes TR, Lemaire P, Ukkonen E, Kivioja T, Taipale J. DNA-binding specificities of human transcription factors. Cell. 2013;152:327–339. doi: 10.1016/j.cell.2012.12.009. [DOI] [PubMed] [Google Scholar]
- Joseph JD, Lu N, Qian J, Sensintaffar J, Shao G, Brigham D, Moon M, Maneval EC, Chen I, Darimont B, Hager JH. A clinically relevant androgen receptor mutation confers resistance to second-generation antiandrogens enzalutamide and ARN-509. Cancer Discov. 2013;3:1020–1029. doi: 10.1158/2159-8290.CD-13-0226. [DOI] [PubMed] [Google Scholar]
- Korpal M, Korn JM, Gao X, Rakiec DP, Ruddy DA, Doshi S, Yuan J, Kovats SG, Kim S, Cooke VG, Monahan JE, Stegmeier F, Roberts TM, Sellers WR, Zhou W, Zhu P. An F876L mutation in androgen receptor confers genetic and phenotypic resistance to MDV3100 (enzalutamide) Cancer Discov. 2013;3:1030–1043. doi: 10.1158/2159-8290.CD-13-0142. [DOI] [PubMed] [Google Scholar]
- Lan X, Bonneville R, Apostolos J, Wu W, Jin VX. W-ChIPeaks: a comprehensive web application tool for processing ChIP-chip and ChIP-seq data. Bioinformatics. 2011;27:428–430. doi: 10.1093/bioinformatics/btq669. [DOI] [PMC free article] [PubMed] [Google Scholar]
- Mangelsdorf DJ, Thummel C, Beato M, Herrlich P, Schutz G, Umesono K, Blumberg B, Kastner P, Mark M, Chambon P, Evans RM. The nuclear receptor superfamily: the second decade. Cell. 1995;83:835–839. doi: 10.1016/0092-8674(95)90199-x. [DOI] [PMC free article] [PubMed] [Google Scholar]
- Massie CE, Lynch A, Ramos-Montoya A, Boren J, Stark R, Fazli L, Warren A, Scott H, Madhu B, Sharma N, Bon H, Zecchini V, Smith DM, Denicola GM, Mathews N, Osborne M, Hadfield J, Macarthur S, Adryan B, Lyons SK, et al. The androgen receptor fuels prostate cancer by regulating central metabolism and biosynthesis. EMBO J. 2011;30:2719–2733. doi: 10.1038/emboj.2011.158. [DOI] [PMC free article] [PubMed] [Google Scholar]
- Meijsing SH, Pufall MA, So AY, Bates DL, Chen L, Yamamoto KR. DNA binding site sequence directs glucocorticoid receptor structure and activity. Science. 2009;324:407–410. doi: 10.1126/science.1164265. [DOI] [PMC free article] [PubMed] [Google Scholar]
- Myung JK, Banuelos CA, Fernandez JG, Mawji NR, Wang J, Tien AH, Yang YC, Tavakoli I, Haile S, Watt K, McEwan IJ, Plymate S, Andersen RJ, Sadar MD. An androgen receptor N-terminal domain antagonist for treating prostate cancer. J Clin Invest. 2013;123:2948–2960. doi: 10.1172/JCI66398. [DOI] [PMC free article] [PubMed] [Google Scholar]
- Rhee HS, Pugh BF. Comprehensive genome-wide protein-DNA interactions detected at single-nucleotide resolution. Cell. 2011;147:1408–1419. doi: 10.1016/j.cell.2011.11.013. [DOI] [PMC free article] [PubMed] [Google Scholar]
- Rhee HS, Pugh BF. Genome-wide structure and organization of eukaryotic pre-initiation complexes. Nature. 2012;483:295–301. doi: 10.1038/nature10799. [DOI] [PMC free article] [PubMed] [Google Scholar]
- Ross-Innes CS, Stark R, Teschendorff AE, Holmes KA, Ali HR, Dunning MJ, Brown GD, Gojis O, Ellis IO, Green AR, Ali S, Chin SF, Palmieri C, Caldas C, Carroll JS. Differential oestrogen receptor binding is associated with clinical outcome in breast cancer. Nature. 2012;481:389–393. doi: 10.1038/nature10730. [DOI] [PMC free article] [PubMed] [Google Scholar]
- Serandour AA, Brown GD, Cohen JD, Carroll JS. Development of an Illumina-based ChIP-exonuclease method provides insight into FoxA1-DNA binding properties. Genome Biol. 2013;14:R147. doi: 10.1186/gb-2013-14-12-r147. [DOI] [PMC free article] [PubMed] [Google Scholar]
- Sharma NL, Massie CE, Ramos-Montoya A, Zecchini V, Scott HE, Lamb AD, MacArthur S, Stark R, Warren AY, Mills IG, Neal DE. The androgen receptor induces a distinct transcriptional program in castration-resistant prostate cancer in man. Cancer Cell. 2013;23:35–47. doi: 10.1016/j.ccr.2012.11.010. [DOI] [PubMed] [Google Scholar]
- Shen MM, Abate-Shen C. Molecular genetics of prostate cancer: new prospects for old challenges. Genes Dev. 2010;24:1967–2000. doi: 10.1101/gad.1965810. [DOI] [PMC free article] [PubMed] [Google Scholar]
- Thomas-Chollier M, Watson LC, Cooper SB, Pufall MA, Liu JS, Borzym K, Vingron M, Yamamoto KR, Meijsing SH. A naturally occurring insertion of a single amino acid rewires transcriptional regulation by glucocorticoid receptor isoforms. Proc Natl Acad Sci USA. 2013;110:17826–17831. doi: 10.1073/pnas.1316235110. [DOI] [PMC free article] [PubMed] [Google Scholar]
- Tran C, Ouk S, Clegg NJ, Chen Y, Watson PA, Arora V, Wongvipat J, Smith-Jones PM, Yoo D, Kwon A, Wasielewska T, Welsbie D, Chen CD, Higano CS, Beer TM, Hung DT, Scher HI, Jung ME, Sawyers CL. Development of a second-generation antiandrogen for treatment of advanced prostate cancer. Science. 2009;324:787–790. doi: 10.1126/science.1168175. [DOI] [PMC free article] [PubMed] [Google Scholar]
- Tsai SY, Carlstedt-Duke J, Weigel NL, Dahlman K, Gustafsson JA, Tsai MJ, O'Malley BW. Molecular interactions of steroid hormone receptor with its enhancer element: evidence for receptor dimer formation. Cell. 1988;55:361–369. doi: 10.1016/0092-8674(88)90059-1. [DOI] [PubMed] [Google Scholar]
- Wang Q, Udayakumar TS, Vasaitis TS, Brodie AM, Fondell JD. Mechanistic relationship between androgen receptor polyglutamine tract truncation and androgen-dependent transcriptional hyperactivity in prostate cancer cells. J Biol Chem. 2004;279:17319–17328. doi: 10.1074/jbc.M400970200. [DOI] [PubMed] [Google Scholar]
- Wang Q, Li W, Liu XS, Carroll JS, Janne OA, Keeton EK, Chinnaiyan AM, Pienta KJ, Brown M. A hierarchical network of transcription factors governs androgen receptor-dependent prostate cancer growth. Mol Cell. 2007;27:380–392. doi: 10.1016/j.molcel.2007.05.041. [DOI] [PMC free article] [PubMed] [Google Scholar]
- Welboren WJ, van Driel MA, Janssen-Megens EM, van Heeringen SJ, Sweep FC, Span PN, Stunnenberg HG. ChIP-seq of ERalpha and RNA polymerase II defines genes differentially responding to ligands. EMBO J. 2009;28:1418–1428. doi: 10.1038/emboj.2009.88. [DOI] [PMC free article] [PubMed] [Google Scholar]
- Wu D, Zhang C, Shen Y, Nephew KP, Wang Q. Androgen receptor-driven chromatin looping in prostate cancer. Trends Endocrinol Metab. 2011;22:474–480. doi: 10.1016/j.tem.2011.07.006. [DOI] [PMC free article] [PubMed] [Google Scholar]
- Wu D, Sunkel B, Chen Z, Liu X, Ye Z, Li Q, Grenade C, Ke J, Zhang C, Chen H, Nephew KP, Huang TH, Liu Z, Jin VX, Wang Q. Three-tiered role of the pioneer factor GATA2 in promoting androgen-dependent gene expression in prostate cancer. Nucleic Acids Res. 2014;42:3607–3622. doi: 10.1093/nar/gkt1382. [DOI] [PMC free article] [PubMed] [Google Scholar]
- Xu Y, Chen SY, Ross KN, Balk SP. Androgens induce prostate cancer cell proliferation through mammalian target of rapamycin activation and post-transcriptional increases in cyclin D proteins. Cancer Res. 2006;66:7783–7792. doi: 10.1158/0008-5472.CAN-05-4472. [DOI] [PubMed] [Google Scholar]
- Zhang J, Chalmers MJ, Stayrook KR, Burris LL, Wang Y, Busby SA, Pascal BD, Garcia-Ordonez RD, Bruning JB, Istrate MA, Kojetin DJ, Dodge JA, Burris TP, Griffin PR. DNA binding alters coactivator interaction surfaces of the intact VDR-RXR complex. Nat Struct Mol Biol. 2011;18:556–563. doi: 10.1038/nsmb.2046. [DOI] [PMC free article] [PubMed] [Google Scholar]
- Zhao Y, Stormo GD. Quantitative analysis demonstrates most transcription factors require only simple models of specificity. Nat Biotechnol. 2011;29:480–483. doi: 10.1038/nbt.1893. [DOI] [PMC free article] [PubMed] [Google Scholar]
Associated Data
This section collects any data citations, data availability statements, or supplementary materials included in this article.
Supplementary Materials
Supplementary Information
Supplementary Table S2
Supplementary Table S4
Review Process File