Abstract
Pancreatic islets exhibit bursting oscillations in response to elevated blood glucose. These oscillations are accompanied by oscillations in the free cytosolic Ca2+ concentration (Cac), which drives pulses of insulin secretion. Both islet Ca2+ and metabolism oscillate, but there is some debate about their interrelationship. Recent experimental data show that metabolic oscillations in some cases persist after the addition of diazoxide (Dz), which opens K(ATP) channels, hyperpolarizing β-cells and preventing Ca2+ entry and Ca2+ oscillations. Further, in some islets in which metabolic oscillations were eliminated with Dz, increasing the cytosolic Ca2+ concentration by the addition of KCl could restart the metabolic oscillations. Here we address why metabolic oscillations persist in some islets but not others, and why raising Cac restarts oscillations in some islets but not others. We answer these questions using the dual oscillator model (DOM) for pancreatic islets. The DOM can reproduce the experimental data and shows that the model supports two different mechanisms for slow metabolic oscillations, one that requires calcium oscillations and one that does not.
Keywords: oscillations, calcium, pancreatic β-cells, dual oscillator model, metabolic
1. Introduction
Pancreatic islets, clusters of electrically coupled endocrine cells, exhibit bursting oscillations in response to elevated blood glucose levels. These oscillations consist of periodic episodes of electrical activity followed by quiescence. The electrical oscillations drive oscillations in the free cytosolic Ca2+ concentration, which in turn mediate pulsatile insulin secretion from β-cells [2, 3, 24]. Pulsatile insulin secretion appears to be important for maintaining glucose homeostasis, as it is lost in patients with Type 2 diabetes and their close, nondiabetic relatives [38, 45, 48]. Pulsatile insulin has also been shown to enhance insulin action at the liver [39]. There is a long history of mathematical modeling to describe the complex electrical activity and intracellular Ca2+ dynamics of the β-cells within islets [6, 13, 11, 12, 21, 29, 47, 49, 50, 52, 53, 59]. More recently, metabolic pathways have been included that supplement the electrical and Ca2+ components that were present in the earlier models [7, 8, 17, 23, 22].
A central question in islet dynamics is whether the metabolic oscillations that have been observed [1, 4, 14, 27, 30, 31, 34, 35, 43, 46] are self-sustaining or whether they are a result of oscillations in the cytosolic Ca2+ concentration (Cac). The first hypothesis is motivated by the observation of glycolytic oscillations in muscle extracts driven by phosphofructokinase-1 enzyme (PFK-1), whose catalytic activity is amplified by its product fructose-1,6-bisphosphate (FBP) [55, 58, 57]. The muscle isoform of PFK-1 is the dominant one in β-cells, suggesting that glycolytic oscillations are possible in these cells [56]. The second hypothesis is motivated by the observation that Ca2+ influences metabolism in several ways. Ca2+ upregulates dehydrogenases in the citric acid cycle [15, 40], Ca2+ flux into the mitochondria depolarizes the mitochondrial membrane [32, 36, 37, 44], and ATP is utilized by Ca2+ ATPases to pump Ca2+ from the cytosol into the endoplasmic reticulum (ER) or out of the cell [16, 33].
Two classes of models have been proposed corresponding to these hypotheses, one in which the metabolic oscillations are driven by Ca2+ oscillations and one in which the metabolic oscillations drive the Ca2+ oscillations. In both cases metabolic and Ca2+ oscillations typically occur together and mutually interact, but only in the second case can metabolic oscillations occur in the absence of Ca2+ oscillations.
The two classes of models have further been combined into a dual oscillator model (DOM), in which an electrical oscillator (EO) drives fast Ca2+ oscillations (period < 2 min), and a glycolytic oscillator (GO) drives slow oscillations (period 2–10 min) [7, 8]. The bifurcation structure of the DOM was analyzed in [25] to explain how the EO and GO work together to produce the diverse oscillation patterns observed in islets. The DOM predicts that fast metabolic oscillations are secondary to Ca2+ oscillations, whereas slow metabolic oscillations do not require Ca2+ oscillations.
The validity of the two hypotheses for the origin of slow metabolic oscillations was tested in studies in which the islet β-cells were hyperpolarized by the K(ATP) channel activator diazoxide (Dz). If Ca2+ oscillations drive metabolic oscillations, then terminating oscillations in Cac by membrane hyperpolarization should stop metabolic oscillations. In fact, it was found that islet hyperpolarization terminates metabolic oscillations [30, 35]. However, in a later study of a large population of islets (101), about one-third of the islets that exhibited metabolic oscillations (as measured through NAD(P)H fluorescence) continued to oscillate in Dz [42].
The case in which Dz abolished metabolic oscillations was interpreted using the DOM as follows. Membrane hyperpolarization abolishes Ca2+ influx through voltage-dependent Ca2+ channels, which eliminates Ca2+ oscillations and decreases the cytosolic Ca2+ concentration. That in turn reduces the demand for ATP to fuel the Ca2+ pumps, so the ATP concentration rises to a level that may be sufficient to inhibit glycolysis and thus prevent metabolic oscillations.
This led to the prediction that increasing the Ca2+ concentration, while preventing it from oscillating, could restart the metabolic oscillations because it would increase the demand for ATP to fuel the Ca2+ pumps. The prediction was confirmed—NAD(P)H oscillations were in fact restored in about half the islets where Dz had eliminated the metabolic oscillations [42]. Thus, the experiments answered one question but raised two new ones. First, when the β-cell membrane is hyperpolarized, why do metabolic oscillations persist in some islets but not in others? Second, when membrane hyperpolarization terminates metabolic oscillations, why does raising the cytosolic Ca2+ concentration sometimes restart them but sometimes not?
In order to answer these questions, we investigate further the dynamic properties of the DOM and find that the DOM exhibits two different mechanisms for slow metabolic oscillations, one that does not require Ca2+ oscillations (denoted by Ca-Independent or CaI) and one that can occur only in the presence of Ca2+ oscillations (denoted by Ca-Dependent or CaD). The slow CaD oscillations are distinct from the fast oscillations described above, in which metabolic oscillations are driven by Ca2+ oscillations, in that no oscillations can occur if glycolysis is stationary. In order to facilitate the analysis of the DOM and to identify the essential features, we simplify the model in several steps, ending up with two coupled, planar fast-slow systems that interact via fast-threshold modulation [54].
2. Model
2.1. The dual oscillator model
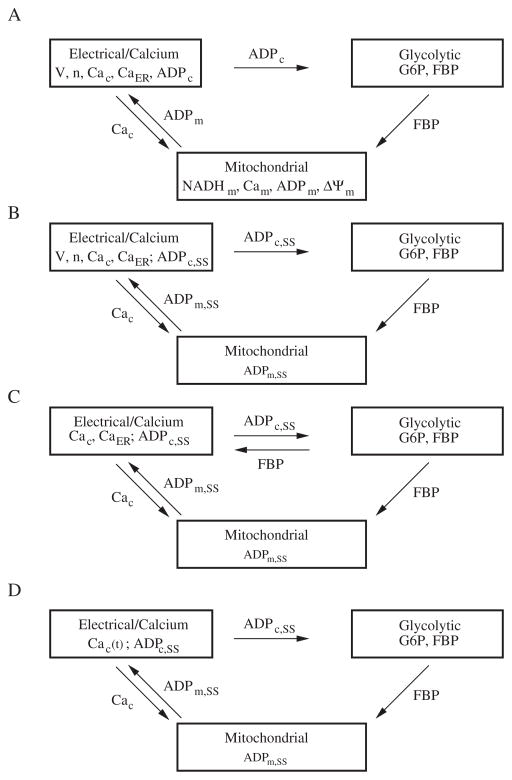
A complete mathematical and physical description of the DOM has been published previously [7, 8], so only the key elements and the simplifications we made will be described here. The DOM consists of three interacting components, electrical/calcium, glycolytic, and mitochondrial (Figure 1A). It was developed to account for the three main oscillatory behaviors of islets: fast electrical bursting, which is postulated to be driven by Ca2+-dependent ion channels; slow glycolytic bursting, driven by glycolytic oscillations; and compound bursting, in which glycolysis modulates Ca2+-dependent bursting to form episodes of bursts clustered together [7]. The two latter slow modes correspond to the slow metabolic oscillations investigated experimentally in [42].
Figure 1.
Successive reductions of the DOM. (A) The three interconnected components of the DOM. (B) Reduced DOM with simplified mitochondria and ADPc set to steady state. (C) Dual planar system with a simplified calcium component for phase-plane analysis. (D) Glycolytic oscillations forced by Cac. See the text for details.
The first component historically was electrical/calcium, consisting of membrane potential, V; the Hodgkin–Huxley gating variable for the voltage-dependent K+ channels, n; cytosolic Ca2+, Cac; and Ca2+ stored internally in the ER, denoted by CaER. The model for the electrical component was developed in [8].
The electrical activity reflects the metabolic state of the cell through the effects of ATP and ADP on K(ATP) channels. These were initially considered parameters determined by glucose concentration, the main physiological driver of β-cell electrical activity and insulin secretion, but were later made dynamic variables. The metabolic state can be reduced to a single parameter by assuming that the sum of ATP and ADP is conserved:
| (2.1) |
After entering the cell, glucose is metabolized first anaerobically in glycolysis. It is phosphorylated to glucose-6-phosphate (G6P) by glucokinase (GK), isomerized to fructose-6-phosphate (F6P), and then phosphorylated a second time to fructose-1,6-bisphosphate (FBP) by phosphofructokinase-1 (PFK-1), the key enzyme that controls oscillations. Other reactions follow downstream of PFK-1, but these are all in equilibrium with FBP and do not contribute to oscillations. F6P is assumed to be in equilibrium with G6P.
With the above simplifications, the equations for the glycolytic component are
| (2.2) |
| (2.3) |
This formulation was adapted from an earlier model for glycolytic oscillations in muscle extracts [51].
The glycolytic component takes ADPc as input from the electrical/calcium component and has as output FBP. It can generate slow oscillations in the absence of Cac oscillations because of positive feedback onto PFK-1 by FBP and slow negative feedback from depletion of the substrate G6P. There is also negative feedback by ATPc, but in our model this is a modulator, not a driver, of oscillations. This differs from earlier models of glycolysis in which ATPc provided the negative feedback and ADPc provided the positive feedback to drive the oscillations [26].
The final component describes the reactions in the mitochondria, which aerobically metabolize the carbons from glucose and produce most of the ATP in the cell. The mitochondrial component has four variables: mitochondrial NADH concentration (NADHm), mitochondrial ADP concentration (ADPm), mitochondrial calcium concentration (Cam), and the inner membrane potential (Δψm). The mitochondrial calcium concentration is determined by exchange with Cac, which is calculated in the electrical component. The actual primary input to the mitochondria from glycolysis is pyruvate, but we use as a surrogate the rate of one of the downstream enzymes, glyceraldehyde 3-phosphate dehydrogenase (GPDH), which is in equilibrium with FBP. That rate satisfies
| (2.4) |
The mitochondrial component of the model was originally developed by Magnus and Keizer [36, 37] and was simplified in [5].
To close the loop, the mitochondria export ATP to the cytosol in exchange for cytosolic ADP via the adenine nucleotide transporter (ANT). Flux through the transporter, JANT, is given by
| (2.5) |
where R is the universal gas constant, F is Faraday’s constant, T is the temperature, and ψm is the mitochondrial membrane potential, here assumed to be constant. ATPm is eliminated by assuming conservation of adenine nucleotides in the mitochondria:
| (2.6) |
The cytosolic variable ADPc is determined by that exchange together with cytosolic ATP consumption, notably by Ca2+ pumps that hydrolyze ATP to ADP to transport Ca2+ into the ER or out of the cell. The hydrolysis rate is modeled as
| (2.7) |
where khyd is the calcium-dependent component of hydrolysis, and Jhyd,SS is the basal level of hydrolysis. Through this interaction, Cac influences the rate of glycolysis, which is modulated by ADPc, as noted above.
2.2. The reduced dual oscillator model
In order to analyze the system, we simplified the DOM while preserving its main characteristics (Figure 1B). We followed along the lines of an earlier, simpler version of the DOM [8], in which NADHm, Cam, and ΔΨm were neglected, and ADPc was determined solely by Cac. However, in the reduced DOM, we used curve fitting to match the input-output relationship of the more complex mitochondrial component depicted in Figure 1A, as that was the first model to exhibit CaD oscillations. Parameter changes and additional parameters are indicated in Table 1. We did retain ADPm, allowing the ANT to determine ADPc, but set it to steady state:
| (2.8) |
where JGPDH is an increasing function of FBP (2.4). The term q1Cac is a simplification of the effect of calcium uptake by the mitochondria to inhibit respiration by shunting the mitochondrial membrane potential, as first modeled by Keizer and Magnus [28]. The second term represents the input from glycolysis. We include the first term for conceptual completeness and possible future use, but we found that it was not necessary for studying the phenomena of interest in this paper because it is redundant to the cytosolic effect of Cac on ATP hydrolysis (2.7). Thus, q1 was set to 0. Therefore, the reduced DOM allows input from the mitochondria but with the mitochondrial variables determined by algebraic equations.
Table 1.
Parameters for the reduced DOM.
| gK(CA) = 450 pS | kPMCA = 0.3 | ḡK(ATP) = 17000 pS |
| q1 = 0 | q2 = 12700 | q3 = 5 |
| κ = 0.003 | ψm = 164 mV | εer = 3 |
| p19 = 0.35 | p20 = 2 | F/RT = 0.037 mV−1 |
Finally, ADPc was set to steady state. In the full DOM [7], ADPc satisfies
| (2.9) |
where δ is the mitochondrial/cytosolic volume ratio. Setting the right-hand side of (2.9) to zero and solving for ADPc gives
| (2.10) |
where JANT is given by (2.5) and the conservation condition (2.1) was used.
Combining (2.7), (2.8), and (2.10), ADPc, which increases K(ATP) channel open probability, falls with glycolytic activity and rises with Cac. These are the necessary, but not sufficient, conditions for the model to exhibit CaD oscillations.
Parameter values are as in [7] unless otherwise noted. Equations (2.8) and (2.10) were added to that model, and the differential equation for ADPc was removed. Details of the equations not discussed here can be found in [7] as well as in the XPP ODE files (see 92019 01.zip [local/web 1.99MB]). With these changes, the model can be described by the scheme in Figure 1B. The mutual dependences of the individual variables within the components are sketched in the following equations:
ADPc,SS, the glue that binds the electrical and metabolic components together, is a decreasing function of FBP and an increasing function of Cac. Note that if Cac is fixed, then the glycolytic component becomes a stand-alone two-variable system, which we exploit later to carry out phase-plane analysis of the behavior of metabolism.
2.3. Dual phase-plane model
As a final simplification, we reduce the EO to a planar system as well, replacing it with a FitzHugh–Nagumo-like system for the two slow variables of the EO, Cac and CaER:
| (2.11) |
| (2.12) |
with the parameter values listed in Table 2. Whereas in the DOM increased cytosolic ATP closes K+ channels, which depolarizes the plasma membrane, opens voltage-dependent Ca2+ channels, and increases Cac, in (2.11) we accomplish the same purpose with the additive FBP term, diagrammed in Figure 1C. With these simplifications, the dual phase-plane model allows us to carry out phase-plane analysis of the EO and the GO jointly.
Table 2.
Parameter values for the dual phase-plane model.
| B = 800 | a = 0.2 |
| D = 0.03 | γ = 0.001 |
| β = 0.5 | ε = 0.02 |
| κ = 0.004 | E = 0.15 |
2.4. Solution methods
The differential equations were solved numerically with the variable step size CVODE method with tolerance 10−9 implemented in the XPPAUT software package [19]. The full set of equations and expressions is contained in the XPP ODE files (see 92019 01.zip [local/web 1.99MB]).
3. Results
3.1. Metabolic oscillations can persist without Ca2+ oscillations
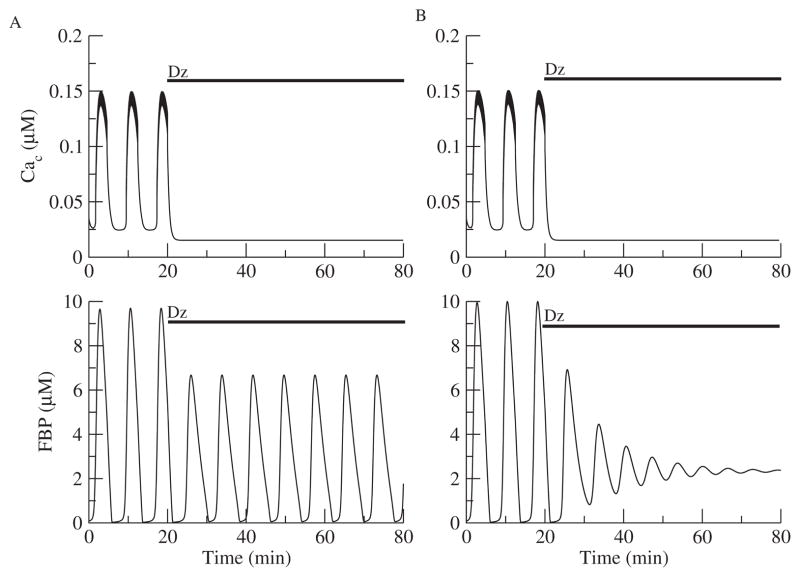
The first test of the reduced DOM (Figure 1B) is whether it can reproduce the findings of [42] that metabolic oscillations sometimes persist and sometimes are terminated by abolishing calcium entry with the K(ATP) channel opener Dz. Figure 2 simulates the two experimentally observed responses to Dz. The application of Dz is simulated by clamping the conductance of the ATP-sensitive K+ (K(ATP)) conductance to a high constant level independent of ADPc. Since the reduced model does not have an equation for NADH, the concentration of FBP is plotted to show the metabolic oscillations. Metabolic oscillations were either lost (Figure 2B) or persisted with a reduced amplitude (Figure 2A). The only difference between these two cases is the rate of the enzyme glucokinase (JGK), which converts glucose into G6P. Islet to islet heterogeneity in the levels of the glucokinase protein is not unlikely and would result in different JGK parameter values.
Figure 2.
Effects of Dz on Ca2+ and metabolic oscillations with the reduced DOM. (A) When JGK = 0.143 μM ms−1, metabolic oscillations are sustained. (B) When JGK = 0.153 μM ms−1, metabolic oscillations are terminated.
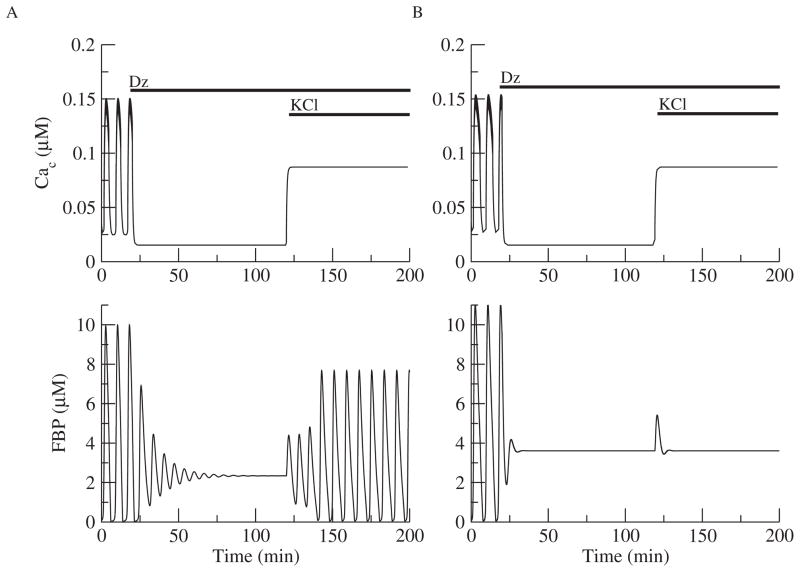
The second test is whether the reduced model can simulate the restoration of the oscillations in Figure 2B when the Cac level is raised. Figure 3A extends Figure 2B in time, and at t = 120 min, the K+ equilibrium potential is raised from −75 mV to −50 mV, simulating the addition of KCl. This raises Cac and restores the oscillations (Figure 3A). Therefore, these metabolic oscillations do not require Ca2+ oscillations. They do, however, depend on the intracellular Ca2+ level. However, metabolic oscillations were not restored in all cases (Figure 3B).
Figure 3.
Metabolic oscillations that are terminated with Dz can be restored in some cases (A) but not others (B). (A) Continuation of simulation in Figure 2B with KCl added at t = 120 min, simulated by raising the K+ reversal potential from −75 mV to −50 mV. Cac rises but remains nonoscillatory, and FBP oscillations are restored. (B) FBP oscillations cannot be restored when JGK is increased slightly (0.19 μM ms−1).
Having established that the reduced DOM captures the key behaviors of the full DOM (Figure 1A), we can use it to understand why the Ca2+ concentration affects metabolic oscillations. We approached this first by isolating the GO, removing the electrical component, and treating Cac as a fixed parameter. The isolated GO system thus consists of (2.2), (2.3), with ADPc and ATPc determined by (2.10) and (2.1) (Figure 1D).
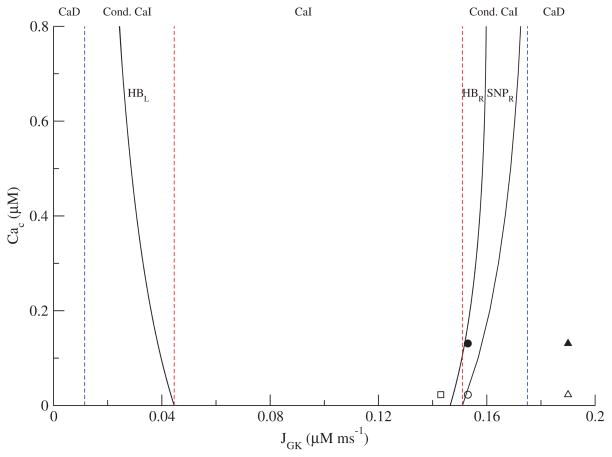
We used the isolated GO (Figure 1D) to construct a two-parameter bifurcation diagram in the JGK-Cac plane. The curves in Figure 4 indicate the locations of Hopf bifurcations (HB) and saddle node of periodics bifurcations (SNP). The two leftmost red and blue lines were determined by the rightmost (red) and leftmost (blue) values of JGK for the HBL curve. The rightmost value is where the HBL curve intersects the JGK axis. The leftmost value is the asymptote that the HBL curve approaches as JGK is lowered. Likewise, the two rightmost red and blue lines were determined by the leftmost (red) and rightmost (blue) values of JGK for the SNPR. The leftmost value is where the SNPR curve intersects the JGK axis. The rightmost value is the maximum value of JGK on the SNPR curve before it turns back to the left above where the graph ends. In between the two HB curves, metabolic oscillations are the only stable structure, but between HBR and SNPR there is bistability between a steady state and an oscillation. In the region between the vertical red lines, metabolism is oscillatory, and since Cac is fixed, these are CaI oscillations. The case of Figure 2A, indicated by the open square in Figure 4, lies in the CaI region. For that value of JGK (0.143 μM ms−1), metabolic oscillations occur for any fixed value of Cac. In contrast, the case of Figure 3A, indicated by the open and closed circles in Figure 4, lies at a value of JGK (0.153 μM ms−1), for which metabolic oscillations occur only for Cac sufficiently large. When the cell is hyperpolarized with Dz, Cac ≈ 0.023 μM, which is outside the region of CaI oscillations (open circle), and the oscillations are lost. Raising Cac to ≈ 0.130 μM with KCl restores the oscillations because the system moves inside the region of CaI oscillations (black circle). This case lies in the conditional CaI region, bounded by the red and blue vertical lines. The case of Figure 3B is indicated by the open and closed triangles in Figure 4. For that value of JGK (0.19 μMms−1), metabolic oscillations cannot occur for any fixed value of Ca2+. However, the full system, with EO and GO, does oscillate in the absence of Dz, and these are thus CaD oscillations. For some cases of conditional CaI oscillations, Ca2+ must be raised to unphysiological levels to get oscillations. In these cases, the oscillations may not be distinguishable in practice from CaD oscillations.
Figure 4.
Two-parameter bifurcation diagram of the glycolytic subsystem illustrating the region of Ca2+ independent (CaI) oscillations. The open square corresponds to Figure 2A after the addition of Dz, the open circle corresponds to Figure 3A, and the open triangle corresponds to Figure 3B. The filled circle corresponds to Figure 3A after KCl is raised to restore oscillations, and the closed triangle corresponds to Figure 3B. The left set of vertical dashed lines are the leftmost (blue) and rightmost (red) JGK values of the HBL curve, while the right set of vertical dashed lines are the leftmost (red) and rightmost (blue) JGK values of the SNPR curve.
More precisely, the CaD region in Figure 4 shows where CaD oscillations may exist. Whether they actually exist depends on the properties of the EO. In other words, the boundaries between CaI, conditional CaI, and CaD can be determined from the properties of the GO alone, but the actual existence of oscillations in the full system depends on both the GO and the EO.
Note finally that Figure 4 explains the results of Figures 2 and 3, but cannot tell us whether the metabolic oscillations observed experimentally in [42] that were not restored by the addition of KCl were CaD or conditional CaI. For example, the level of Cac achieved by raising KCl may have been too low to put the system into the oscillatory region.
3.2. Analysis of CaD oscillations
Examination of the nullclines for the isolated GO (Figure 1D) in the G6P-FBP phase plane is sufficient to explain why CaI oscillations disappear as JGK is increased. The FBP nullcline is S-shaped, and the glycolytic subsystem oscillates when the nullclines intersect on the middle branch, provided G6P is sufficiently slow. The intersection lies on the middle branch for the parameter values that correspond to the region of CaI metabolic oscillations in Figure 4 (not shown). However, raising JGK raises the G6P nullcline so that it intersects the upper branch of the FBP nullcline. Thus, for a fixed value of Cac the GO can no longer oscillate (Figure 5B). The right boundary of the CaI region (curve SNPR in Figure 4) has positive slope because of the competition, JGK and Cac: JGK moves the steady state toward the upper branch, whereas Cac moves it back toward the middle branch.
Figure 5.
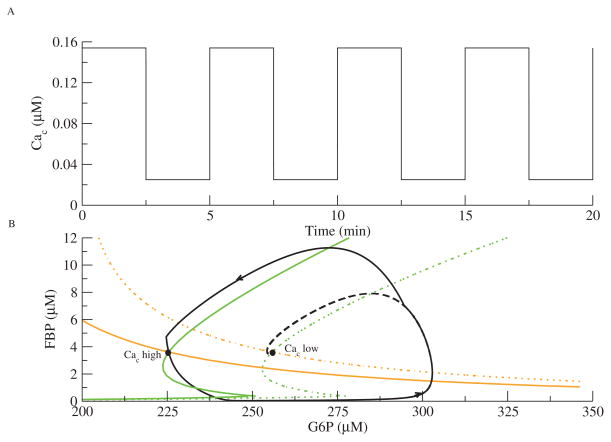
Forcing of the glycolytic subsystem with JGK = 0.19 μM ms−1. (A) Cac is a square-wave oscillation. (B) The phase plane for the GO. The GO chases two different steady states that switch as Cac jumps from high to low. The FBP (green) and G6P (orange) nullclines move to the left as Cac increases. The trajectory is solid black; the dashed black line indicates that the phase point would have gone to the low Cac steady state if Cac had not jumped.
CaD oscillations by definition require variation in Cac, as the GO does not oscillate for Cac fixed. First we consider the simple case of Ca2+-dynamics imposed by external forcing so that we may analyze glycolosis in a planar system. In Figure 5, the GO is forced by a square wave oscillation in Cac (Figure 5A).
The effect of Cac on the GO is mediated by Ca2+-dependent consumption of ATP (2.9), which activates PFK-1. As the term JPFK appears in both (2.2) and (2.3), the FBP and G6P nullclines both depend on Cac. Figure 5B shows two FBP (green) and two G6P (orange) nullclines. The solid nullclines are for high Cac, and the dashed ones are for low Cac. The steady state for high Cac lies to the left of that for low Cac because the increased activity of PFK-1 increases consumption of G6P.
If Cac and FBP start out low, then the phase point heads for the steady state on the right. Before it gets there, however, Cac jumps up, causing the nullclines to jump to the left. The dashed curve shows where the phase point would have gone had Cac remained low. The phase point now has to go further up and around to reach the new steady state, producing a pulse of FBP. Before it reaches the high-Cac steady state, Cac jumps down, moving the steady state back to the right. Thus, the phase point chases two different steady states that move as Cac changes (see 92019 02.gif [local/web 725KB]). Without these jumps in Cac, the glycolytic subsystem with CaD parameters would not oscillate. We now explore whether the jumping nullcline picture also applies to the autonomous system.
With the EO added back in place of Cac (i.e., the reduced DOM, Figure 1B), the same type of behavior in the GO phase plane is found (see 92019 03.gif [local/web 742KB]). A better understanding of the interdependency of the EO and GO subsystems in the CaD region is obtained by using the dual phase-plane reduction described in section 2.3 (Figure 1C). This allows us to analyze the EO as well as the GO in the phase plane.
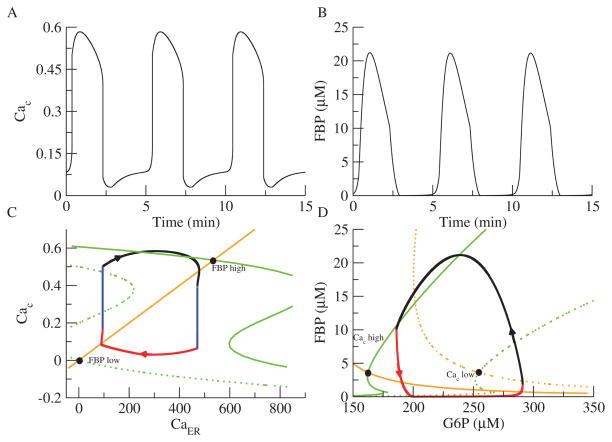
Figures 6A and B show the oscillations produced in Cac and FBP, respectively. Figure 6C shows the CaER-Cac plane, and Figure 6D shows the G6P-FBP phase plane. As in Figure 5B, the FBP nullcline is in green and the G6P nullcline is in orange, and the steady state moves from right to left as Cac increases. The Cac nullcline (green) is a cubic function of Cac (see (2.11)) and is shown dashed for low FBP and solid for high FBP. The Cac nullcline moves from left to right as FBP increases. To ensure that the EO cannot oscillate on its own, parameters are chosen such that the phase point is on either the lower branch or the upper branch of the Cac nullcline, and the Caer nullcline never intersects the Cac nullcline solely on the middle branch. Thus, both the EO and GO are excitable, not oscillatory.
Figure 6.
Phase plane analysis of the dual planar model. The GO is coupled to a FitzHugh–Nagumo-like oscillator consisting of Cac and CaER in place of the original EO. (A) Cac oscillations. (B) FBP oscillations. (C) Phase plane for the EO. The Cac nullcline is cubic (green) and moves to the right as FBP increases. The CaER nullcline is linear (orange). (D) Phase plane for the GO. The FBP (green) and G6P (orange) nullclines move to the left as Cac increases. The trajectories for the EO and GO are in black (JGK=0.19 μM ms−1).
Panels C and D show how CaD metabolic oscillations emerge. If FBP and Cac start out low, the GO steady state is on the right, and the EO steady state is on the left. As the GO approaches its steady state (red section), FBP rises. If parameters are chosen appropriately, this causes the Cac nullcline to jump to the right just before the EO reaches its steady state. Cac in turn jumps up (left blue section), causing the steady state of the GO to move to the left. Now, as in Figure 5B, the EO trajectory flows up and to the right to approach the new, high-Cac steady state (black section). As the GO approaches its new steady state, FBP starts to decrease (black section). This decrease moves the Cac nullcline back to the left, and Cac decreases (right blue section). Finally, the steady state of the GO is on the right, and the combined system is back in its initial configuration (see 92019 04.gif [local/web 1.12MB]).
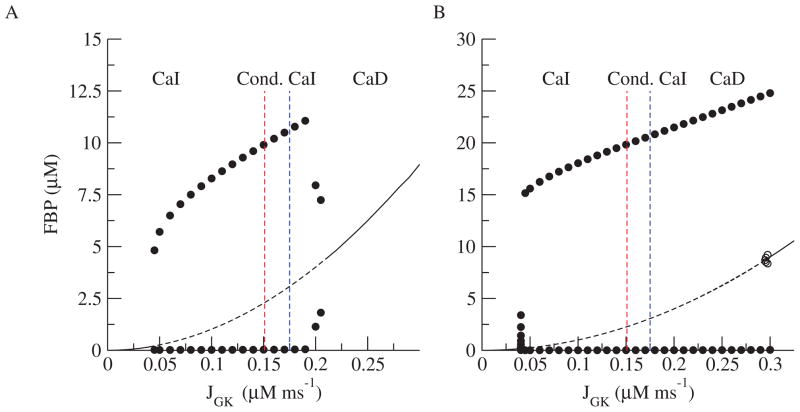
Figure 7A shows the one-parameter bifurcation diagram with respect to JGK for the reduced DOM (Figure 1B). The dividing lines between CaI, conditional CaI, and CaD oscillations are repeated from Figure 4. (For simplicity, we label only the rightmost divisions, as we never observed CaD for low JGK.) As JGK is increased, the amplitude of the metabolic oscillations increases, but there is no qualitative change between the various regimes. Figure 7B shows the bifurcation diagram for the dual phase-plane model (Figure 1C). This diagram looks very similar to the bifurcation diagram for the reduced system (Figure 7A), suggesting that the analysis for the dual phase-plane model can be applied to the reduced system.
Figure 7.
Bifurcation diagram for the reduced DOM (A) and the dual planar model (B).
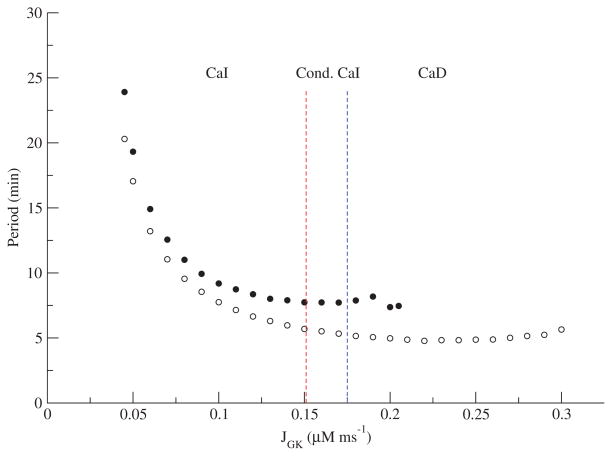
The periods further reinforce the similarities between both models. Figure 8 shows the period vs. JGK for the reduced DOM and the dual phase-plane model. The periods are similar quantitatively and in both models are relatively flat apart from a narrow strip near the threshold on the left. As with the amplitude (Figure 7), there is no sharp transition between CaI and conditional CaI or between conditional CaI and CaD. Setting aside the low JGK values with highest period, it would be difficult to distinguish these patterns on the basis of period.
Figure 8.
Periods for the reduced DOM (filled circles) and the dual phase-plane model (open circles) as a function of JGK.
3.3. Comparison with experimental data
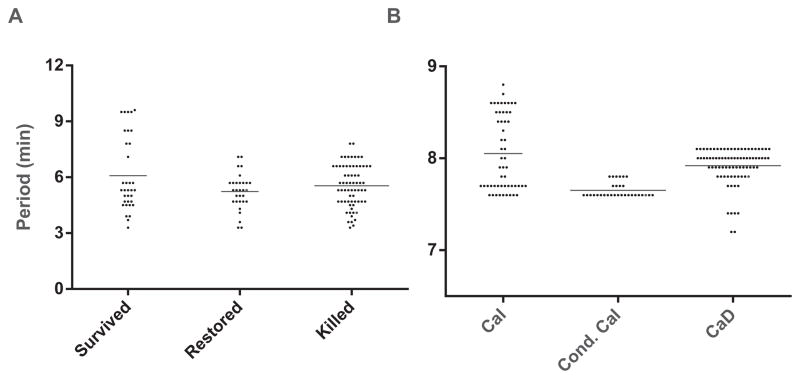
We returned to the experimental data from [42] to examine the periods of islets in which oscillations survived Dz (CaI), were lost but restored with KCl (conditional CaI), or were lost but not restored (could be CaD or conditional CaI) (see Figure 9A). There is a statistically significant difference between the three groups (p = 0.04 for one-way ANOVA) as well as the pairwise comparison between those that survived and those that were restored (p = 0.03). The data are skewed, however, and there are no significant differences if the highest outlying values of the “Survived” group are excluded, or if the nonparametric Kruskal–Wallis test is used. We discard the outliers and conclude that in both the model (Figure 8) and the data (Figure 9A) there is no sharp transition between the three cases.
Figure 9.
Periods observed in islets [42] (A) and synthetic data for the reduced DOM (B). Synthetic data generated by taking a Gaussian distribution of JGK values with mean 0.1575 and standard deviation 0.0475. The horizontal lines represent mean values.
However, there is no reason to believe that the outlying period values in the data are invalid, as we do not expect the periods to be normally distributed in light of the steep period vs. JGK relationship near threshold in the model. Similarly, large periods are found scattered in the experimental islet literature, especially at near-threshold glucose concentrations. It is thus tempting to identify the longest-period data points from the experiments with the low JGK cases from the model.
Figure 9A shows the distribution of periods of NAD(P)H oscillations from mouse islets under three different conditions. The first group (Survived) reflects periods from islets in which oscillations persisted when the membrane was hyperpolarized with Dz. Note that the period plotted is that of the NAD(P)H oscillations prior to Dz application. The second group (Restored) reflects periods from islets whose oscillations were eliminated by Dz but were restored upon membrane depolarization with KCl. The final group (Killed) is from islets whose oscillations were eliminated by Dz and could not be subsequently restored by KCl application. Differences in the mean periods across the three groups were not statistically significant.
Figure 9B shows period distributions using synthetic data from the reduced DOM. It was obtained by sampling JGK values over a Gaussian distribution centered at 0.1575, which is between the red and blue lines in Figure 8. This produces a sampling of CaI, conditional CaI, and CaD oscillations. These are analogous to the Survived, Restored, and Killed islet groups, respectively. The synthetic distributions qualitatively resemble the experimental distributions, including the long tail of high period points. We note two caveats about the interpretation. First, the experimental group, Killed, could represent CaD or conditional CaI oscillations, as we do not know whether those islets would have oscillated at a different level of Cac. Second, we have no information about JGK in the experiments, and, even if we did, the response likely depends as well on other parameters that are unknown.
We remark that the bifurcation diagram of the reduced DOM (Figure 7A) seems to suggest that CaI oscillations should be the most common, whereas these were observed in a minority of cases in [42]. The discrepancy is explained by noting that the CaI region in Figure 7A consists of a wide range of JGK values, which presumably correspond to both low and high glucose levels, but all the experiments were carried out in 11.1 mM glucose, a strongly stimulatory level. The fact that a few islets nonetheless exhibited very long periods, which in the model correspond to low JGK values, likely reflects heterogeneity in levels of glucokinase expression or other cellular parameters.
4. Discussion
Experimental evidence has shown that metabolic oscillations in pancreatic islets can persist in the absence of Cac oscillations, although they can depend on the level of fixed Cac (Figure 3) [42]. The dual oscillator model (DOM) supports the above distinction, which depends on the level of glucokinase activity (JGK; see Figures 4 and 7A). However, models in which Ca2+ oscillations are obligatory for metabolic oscillations cannot explain the full set of experimental observations. For example, in the Keizer–Magnus model [28] and the models of Fridlyand, Ma, and Philipson [22], Fridlyand, Tamarina, and Philipson [23], Cha et al. [10], and Diederichs [17], inhibiting Ca2+ oscillations invariably abolishes metabolic oscillations. In contrast to these models, the DOM has a glycolytic oscillator (GO) in addition to the electrical oscillator (EO), and glycolytic oscillations can persist in the absence of Ca2+ oscillations. We have termed these Ca2+-Independent (CaI) oscillations.
However, in some cases, metabolic oscillations are terminated by blocking Ca2+ entry. In some such cases the oscillations can be restored by raising the Ca2+ concentration while leaving Ca2+ nonoscillatory [42], and the DOM can account for that response if the islets lie in the regime where CaI oscillations exist only for a subset of Cac levels (conditional CaI oscillations; see Figure 7A). In other cases, the oscillations were not restored, possibly because the Ca2+ concentration did not fall in the oscillatory range of the GO, as suggested by Figure 4, or because some metabolic oscillations do depend on Ca2+ oscillations. Such CaD oscillations can also be accommodated within the framework of the DOM (Figure 7A).
These oscillations are not noticeably different in amplitude (Figure 7A) or frequency (Figure 8) from CaI oscillations, in agreement with experimental observations (Figure 9).
The geometric basis for CaD oscillations is shown in Figure 6 using the dual phase-plane model. The transition from CaI to CaD occurs when the steady state of the isolated GO moves from the middle branch of the FBP nullcline to the upper branch, making it excitable. The EO was also made excitable to conform to the fact that the EO in the DOM is not capable of generating slow oscillations by itself. CaD oscillations occur when the EO and GO push each other between their low and high states reciprocally.
The biophysical basis of CaD oscillations in all versions of the model studied here is the effect of increased Cac to lower ATPc and thereby activate PFK-1, and of reduced Cac to deactivate PFK-1. This effect of Cac was confirmed experimentally in a recent paper, which showed by direct imaging of ATPc that KCl lowers ATPc and Dz raises it, and that the changes are large, comparable to those that occur during oscillations of Cac and ATPc [33].
In the model, the active phase is triggered by a rise in FBP, which leads to a rise in the ATP/ADP ratio and thereby closure of K(ATP) channels and increased Cac. That in turn amplifies the rise in FBP. The downstroke of FBP is likewise amplified by the fall in Cac. These features apply to both the CaI and CaD regimes, but in the CaD regime, the rise in FBP at the end of the silent phase is not by itself sufficient to initiate an active phase. It may, however, raise Cac sufficiently to provide additional boost to FBP and trigger the next active phase. The same applies to the triggering of the next silent phase at the end of the active phase, but with the directions reversed.
The scenarios above are specific for islets and the DOM, but oscillations mediated by coupled excitable systems that interact via jumping nullclines are well known in neuroscience under the name fast threshold modulation (FTM) [54]. FTM was originally conceived as a way to describe synaptic coupling and synchrony between two or more neurons, but the essential element of one oscillator causing the nullclines of another to jump is general and can occur with two dissimilar oscillators that are coupled by one or more common variables within a single cell. Another system that appears to be governed by FTM between two internal subsystems is a model for Ca2+ oscillations in GnRH neurons [18]. In that model an excitable fast electrical subsystem coupled to an excitable slow Ca2+ subsystem consisting of Cac, CaER, and a superslow Ca2+-activated K+ channel produces bursting oscillations. Making the electrical subsystem excitable rather than oscillatory is critical for allowing that model to reproduce the experimentally observed bursts, which have very long silent phases. Another recent model for GnRH neurons also involves FTM [60].
The bifurcation structure of the DOM has been studied previously [25], but with different methods and different aims. In that analysis, either the EO or the GO was oscillatory or both were oscillatory. The EO oscillations were studied as a function of the slow variable ADPc, viewed as a parameter supplied by the GO. The oscillations of the GO, consisting of ADPc, Cac, and CaER, were studied as a function of Cac supplied by the EO. Those bifurcation diagrams were overlapped to expose the mechanisms of fast, slow, and compound oscillations and their modulation by glucose concentration. The slow variation of reciprocally controlled parameters of the two oscillatory subsystems could be called “slow threshold modulation.” In contrast, the CaD oscillations studied here depend crucially on transient behavior, rather than the slowly modulated fixed points and limit cycles studied in [25].
Another aspect of β-cell models that is closely related to slow threshold modulation is phantom bursting [6, 9]. In phantom bursting there are two slow variables, s1 and s2, where s2 is much slower than s1. If the fast (electrical) subsystem is oscillatory with respect to s1, relatively fast bursting is obtained. If the fast subsystem is excitable with respect to s1, s2 may be able to sweep the combined fast variable-s1 subsystem across its saddle node and homoclinic bifurcations to produce much slower bursting.
We believe that the analysis presented here using the reduced DOM applies to the full DOM for several reasons. First, both models exhibit the same key behaviors, including fast, slow, and compound oscillations. Second, the bifurcation diagram of the full DOM (not shown) is very similar to that of the reduced DOM, provided that kPMCA and εER are chosen suitably. The full DOM does not show true CaD oscillations, however, only CaI and conditional CaI. This difference appears to be a result of setting the mitochondrial variables in the reduced DOM to steady state. Importantly, however, restoring metabolic oscillations in the full DOM in many cases requires Cac levels much higher than the physiological range [20]. Whereas in the reduced model we can set Cac arbitrarily, in real islets such levels would not be attainable by raising KCl, and hence those CaI oscillations would not be distinguishable from CaD experimentally.
The final question is whether the model accounts for the varied responses of real islets, in particular whether the oscillations terminated by Dz that could not be restored by KCl were conditional CaI oscillations or CaD oscillations. The bifurcation diagram of the reduced DOM (Figure 7A) indicates that the CaD regime is comparable in size to the conditional CaI regime. Since conditional CaI oscillations have been shown to exist, it seems likely that CaD oscillations also exist. A recent paper in which ATPc oscillations were measured showed that Cac has large effects on ATPc, at least in the subplasma-membrane space [33], which makes CaD oscillations plausible.
Given that there is no clear-cut difference in period and amplitude between CaD and CaI, to distinguish them one would have to exhaustively test restoration of oscillations with many values of KCl concentration. Alternatively, one could try to trace a path through the two-parameter diagram (Figure 4) by titrating glucose and KCl. It is technically difficult, though perhaps not impossible, to maintain recordings long enough in any given islet to do either of these.
To end on a note of hope, and point to how the modeling and mathematical analysis of the DOM are driving innovative biology, we have developed a method to measure FBP oscillations [41]. This opens the possibility of testing directly whether glycolytic oscillations in β-cells conform to the model predictions.
Supplementary Material
Contributor Information
Margaret Watts, Email: margaret.watts@nih.gov.
Bernard Fendler, Email: bfendler@cshl.edu.
Matthew J. Merrins, Email: mmerrins@umich.edu.
Leslie S. Satin, Email: lsatin@umich.edu.
Richard Bertram, Email: bertram@math.fsu.edu.
Arthur Sherman, Email: asherman@nih.gov.
References
- 1.Ainscow EK, Rutter GA. Glucose-stimulated oscillations in free cytosolic ATP concentration imaged in single islet β-cells. Diabetes. 2002;51:S162–S170. doi: 10.2337/diabetes.51.2007.s162. [DOI] [PubMed] [Google Scholar]
- 2.Barbosa RM, Silva AM, Tome AR, Stamford JA, Santos RM, Rosario LM. Control of pulsatile 5-HT/insulin secretion from single mouse pancreatic islets by intracellular calcium dynamics. J Physiol Lond. 1998;510:135–143. doi: 10.1111/j.1469-7793.1998.135bz.x. [DOI] [PMC free article] [PubMed] [Google Scholar]
- 3.Bergstein RM. Slow and fast oscillations of cytosolic Ca2+ correspond to pulsatile insulin release. Am J Physiol. 1995;268:E282–E287. doi: 10.1152/ajpendo.1995.268.2.E282. [DOI] [PubMed] [Google Scholar]
- 4.Bergsten P, Westerlund J, Liss P, Carlsson PO. Primary in vivo oscillations of metabolism in the pancreas. Diabetes. 2002;51:699–703. doi: 10.2337/diabetes.51.3.699. [DOI] [PubMed] [Google Scholar]
- 5.Bertram R, Pedersen MG, Luciani DS, Sherman A. A simplified model for mitochondrial ATP production. J Theor Biol. 2006;243:575–586. doi: 10.1016/j.jtbi.2006.07.019. [DOI] [PubMed] [Google Scholar]
- 6.Bertram R, Previte J, Sherman A, Kinard TA, Satin LS. The phantom burster model for pancreatic β-cells. Biophys J. 2000;79:2880–2892. doi: 10.1016/S0006-3495(00)76525-8. [DOI] [PMC free article] [PubMed] [Google Scholar]
- 7.Bertram R, Satin L, Pedersen MG, Luciani D, Sherman A. Interaction of glycolysis and mitochondrial respiration in metabolic oscillations of pancreatic islets. Biophys J. 2007;92:1544–1555. doi: 10.1529/biophysj.106.097154. [DOI] [PMC free article] [PubMed] [Google Scholar]
- 8.Bertram R, Satin L, Zhang M, Smolen P, Sherman A. Calcium and glycolysis mediate multiple bursting models in pancreatic islets. Biophys J. 2004;87:3074–3087. doi: 10.1529/biophysj.104.049262. [DOI] [PMC free article] [PubMed] [Google Scholar]
- 9.Bertram R, Sherman A. A calcium-based phantom bursting model for pancreatic islets. Bull Math Biol. 2004;66:1313–1344. doi: 10.1016/j.bulm.2003.12.005. [DOI] [PubMed] [Google Scholar]
- 10.Cha CY, Nakamura Y, Himeno Y, Wang J, Fujimoto S, Inagaki N, Earm YE, Noma A. Ionic mechanisms and CA2+ dynamics underlying the glucose response of pancreatic beta cells: A simulation study. J Gen Physiol. 2011;138:21–37. doi: 10.1085/jgp.201110611. [DOI] [PMC free article] [PubMed] [Google Scholar]
- 11.Chay TR. Electrical bursting and luminal calcium oscillation in excitable cell models. Biol Cybern. 1996;75:419–431. doi: 10.1007/s004220050307. [DOI] [PubMed] [Google Scholar]
- 12.Chay TR. Effects of extracellular calcium on electrical bursting and intracellular and luminal calcium oscillations in insulin secreting pancreatic β-cells. Biophys J. 1997;73:1673–1688. doi: 10.1016/S0006-3495(97)78199-2. [DOI] [PMC free article] [PubMed] [Google Scholar]
- 13.Chay TR, Keizer J. Minimal model for membrane oscillations in the pancreatic β-cell. Biophys J. 1983;42:181–190. doi: 10.1016/S0006-3495(83)84384-7. [DOI] [PMC free article] [PubMed] [Google Scholar]
- 14.Chou HF, Berman N, Ipp E. Oscillations of lactate released from islets of Langerhans: Evidence for oscillatory glycolysis in β-cells. Am J Physiol. 1992;262:E800–E805. doi: 10.1152/ajpendo.1992.262.6.E800. [DOI] [PubMed] [Google Scholar]
- 15.Civelek VN, Deeney JT, Fusonie GE, Corkey BE, Tornheim K. Oscillations in oxygen consumption by permeabilized clonal pancreatic β-cells (HIT) incubated in an oscillatory glycolyzing muscle extract. Diabetes. 1997;46:51–56. doi: 10.2337/diab.46.1.51. [DOI] [PMC free article] [PubMed] [Google Scholar]
- 16.Detimary P, Gilon P, Henquin JC. Interplay between cytoplasmic Ca2+ and the ATP/ADP ratio: A feedback control mechanism in mouse pancreatic islets. Biochem J. 1998;333:269–274. doi: 10.1042/bj3330269. [DOI] [PMC free article] [PubMed] [Google Scholar]
- 17.Diederichs F. Mathematical simulation of membrane processes and metabolic fluxes of the pancreatic β-cell. Bull Math Biol. 2006;68:1779–1818. doi: 10.1007/s11538-005-9053-9. [DOI] [PubMed] [Google Scholar]
- 18.Duan W, Lee K, Herbison A, Sneyd J. A mathematical model of adult GnRH neurons in mouse brain and its bifurcation analysis. J Theor Biol. 2011;276:22–34. doi: 10.1016/j.jtbi.2011.01.035. [DOI] [PubMed] [Google Scholar]
- 19.Ermentrout B. Simulating, Analyzing, and Animating Dynamical Systems: A Guide to XPPAUT for Researchers and Students. SIAM; Philadelphia: 2002. [Google Scholar]
- 20.Fendler BJ., II . PhD thesis. Florida State University; Tallahassee, FL: 2009. Synchronization of Pancreatic Islets: A Quantitative Investigation of Nonlinear Oscillations in the Endocrine Pancreas. [Google Scholar]
- 21.Fridlyand LE, Jacobson DA, Kuznetsov A, Philipson LH. A model of action potentials and fast Ca2+ dynamics in pancreatic β-cells. Biophys J. 2009;96:3126–3139. doi: 10.1016/j.bpj.2009.01.029. [DOI] [PMC free article] [PubMed] [Google Scholar]
- 22.Fridlyand LE, Ma L, Philipson LH. Adenine nucleotide regulation in pancreatic β-cells: Modeling of ATP/ADP-Ca2+ interactions. Am J Physiol Endocrinol Metab. 2005;289:E839–E848. doi: 10.1152/ajpendo.00595.2004. [DOI] [PubMed] [Google Scholar]
- 23.Fridlyand LE, Tamarina N, Philipson LH. Modeling Ca2+ flux in pancreatic β-cells: Role of plasma membrane and intracellular stores. Am J Physiol Endocrinol Metab. 2003;285:E138–E154. doi: 10.1152/ajpendo.00194.2002. [DOI] [PubMed] [Google Scholar]
- 24.Gilon P, Henquin JC. Influence of membrane potential changes on cytoplasmic Ca2+ concentration in an electrically excitable cell, the insulin-secreting pancreatic β-cell. Am J Physiol. 1992;268:20713–20720. [PubMed] [Google Scholar]
- 25.Goel P, Sherman A. The geometry of bursting in the dual oscillator model of pancreatic β-cells. SIAM J Appl Dyn Syst. 2009;8:1664–1693. [Google Scholar]
- 26.Goldbeter A, Lefever R. Dissipative structures for an allosteric model: Application to glycolytic oscillations. Biophys J. 1972;12:1302–1315. doi: 10.1016/S0006-3495(72)86164-2. [DOI] [PMC free article] [PubMed] [Google Scholar]
- 27.Juntii-Berggren L, Webb DL, Arkhammar POG, Schultz V, Schweda EKH, Tornheim K, Berggren PO. Dihydroxyacetone-induced oscillations in cytoplasmic free Ca2+ and the ATP/ADP ratio in pancreatic β-cells at substimulatory glucose. J Biol Chem. 2003;278:40710–40716. doi: 10.1074/jbc.M308248200. [DOI] [PubMed] [Google Scholar]
- 28.Keizer J, Magnus G. ATP-sensitive potassium channel and bursting in the pancreatic β cell. Biophys J. 1989;56:229–242. doi: 10.1016/S0006-3495(89)82669-4. [DOI] [PMC free article] [PubMed] [Google Scholar]
- 29.Keizer J, Smolen P. Bursting electrical activity in pancreatic β cells caused by Ca2+-and voltage-inactivated Ca2+ channels. Proc Nat Acad Sci USA. 1991;88:3897–3901. doi: 10.1073/pnas.88.9.3897. [DOI] [PMC free article] [PubMed] [Google Scholar]
- 30.Kennedy RT, Kauri LM, Dahlgren GM, Jung SK. Metabolic oscillations in β-cells. Diabetes. 2002;51:S263–S161. doi: 10.2337/diabetes.51.2007.s152. [DOI] [PubMed] [Google Scholar]
- 31.Kindmark H, Köhler M, Brown G, Bränström R, Larsson O, Berggren PO. Glucose-induced oscillations in cytoplasmic free Ca2+ concentration precede oscillations in mitochondrial membrane potential in the pancreatic β-cell. J Biol Chem. 2001;276:34530–34536. doi: 10.1074/jbc.M102492200. [DOI] [PubMed] [Google Scholar]
- 32.Krippeit-Drews P, Dufer M, Drews G. Parallel oscillations of intracellular calcium activity and mitochondrial membrane potential in mouse pancreatic β-cells. Biochem Biophys Res Commun. 2000;267:179–183. doi: 10.1006/bbrc.1999.1921. [DOI] [PubMed] [Google Scholar]
- 33.Li J, Shuai HY, Gylfe E, Tengholm A. Oscillations of sub-membrane ATP in glucose-stimulated beta cells depend on negative feedback from Ca2+ Diabetologia. 2013;56:1577–1586. doi: 10.1007/s00125-013-2894-0. [DOI] [PMC free article] [PubMed] [Google Scholar]
- 34.Longo EA, Tornheim K, Deeney JT, Varnum BA, Tillotson D, Prentki M, Corkey BE. Oscillations in cytosolic free Ca2+, oxygen consumption, and insulin secretion in glucose-stimulated rat pancreatic islets. J Biol Chem. 1991;266:9314–9319. [PubMed] [Google Scholar]
- 35.Luciani DS, Misler S, Polonsky KS. Ca2+ controls slow NAD(P)H oscillations in glucose-stimulated mouse pancreatic islets. J Physiol. 2006;572:379–392. doi: 10.1113/jphysiol.2005.101766. [DOI] [PMC free article] [PubMed] [Google Scholar]
- 36.Magnus G, Keizer J. Model of β-cell mitochondrial calcium handling and electrical activity. I. Cytoplasmic variables. Am J Physiol Cell Physiol. 1998;274:C1158–1173. doi: 10.1152/ajpcell.1998.274.4.C1158. [DOI] [PubMed] [Google Scholar]
- 37.Magnus G, Keizer J. Model of β-cell mitochondrial calcium handling and electrical activity. II. Mitochondrial variables. Am J Physiol Cell Physiol. 1998;274:C1174–C1184. doi: 10.1152/ajpcell.1998.274.4.C1174. [DOI] [PubMed] [Google Scholar]
- 38.Matthews DR, Lang DA, Burnett MA, Turner RC. Control of pulsatile insulin secretion in man. Diabetologia. 1983;24:231–237. doi: 10.1007/BF00282705. [DOI] [PubMed] [Google Scholar]
- 39.Matveyenko AV, Lluwantara D, Gurlo T, Kirakossian D, Man CD, Cobelll C, White MF, Copps KD, Volpl E, Fujita S, Butler P. Pulsatile portal vein insulin delivery enhances hepatic insulin action and signaling. Diabetes. 2012;61:2269–2279. doi: 10.2337/db11-1462. [DOI] [PMC free article] [PubMed] [Google Scholar]
- 40.McCormack J, Longo E, Corkey B. Glucose-induced activation of pyruate dehydrogenase in isolated rat pancreatic islets. Biochem J. 1990;267:527–530. doi: 10.1042/bj2670527. [DOI] [PMC free article] [PubMed] [Google Scholar]
- 41.Merrins MJ, Van Dyke AR, Mapp AK, Rizzo MA, Satin LS. Direct measurement of oscillatory glycolysis in pancreatic islet beta-cells using a novel fluorescence resonance energy transfer (FRET) biosensor for pyruvate kinase M2 activity. J Biol Chem. 2013;288:33312–33322. doi: 10.1074/jbc.M113.508127. [DOI] [PMC free article] [PubMed] [Google Scholar]
- 42.Merrins MJ, Fendler B, Zhang M, Sherman A, Bertram R, Satin L. Metabolic oscillations in pancreatic islets depend on the intracellular Ca2+ level but not Ca2+ oscillations. Biophys J. 2010;99:76–84. doi: 10.1016/j.bpj.2010.04.012. [DOI] [PMC free article] [PubMed] [Google Scholar]
- 43.Nilsson T, Schultz V, Berggren PO, Corkey BE, Tornheim K. Temporal patterns of changes in ATP/ADP ratio, glucose 6-phosphate and cytoplasmic free Ca2+ in glucose-stimulated pancreatic β-cells. Biochem J. 1996;314:91–94. doi: 10.1042/bj3140091. [DOI] [PMC free article] [PubMed] [Google Scholar]
- 44.Nunemaker CS, Bertram R, Sherman A, Tsaneva-Atanasova K, Daniel CR, Satin LS. Comparison of metabolic oscillations from mouse pancreatic beta cells and islets. Endocrine. 2004;25:61–68. doi: 10.1385/ENDO:25:1:61. [DOI] [PubMed] [Google Scholar]
- 45.O’Rahilly S, Turner RC, Matthews DR. Impaired pulsatile secretion of insulin in relatives of patients with non-insulin-dependent diabetes. N Engl J Med. 1988;318:1225–1230. doi: 10.1056/NEJM198805123181902. [DOI] [PubMed] [Google Scholar]
- 46.Ortsäter H, Liss P, Lund PE, Åkerman KE, Bergsten P. Oscillations in oxygen tension and insulin release of individual pancreatic ob/ob mouse islets. Diabetologia. 2000;43:1313–1318. doi: 10.1007/s001250051528. [DOI] [PubMed] [Google Scholar]
- 47.Pedersen MG. A biophysical model of electrical activity in human β-cells. Biophys J. 2010;99:3200–3207. doi: 10.1016/j.bpj.2010.09.004. [DOI] [PMC free article] [PubMed] [Google Scholar]
- 48.Polonsky KS, Given BD, Hirsch LJ, Tillil H, Shapiro GT, Beebe C, Frank BH, Gallaway JA, Van Cauter E. Abnormal patterns of insulin secretion in non-insulin-dependent diabetes mellitus. N Engl J Med. 1988;318:1231–1239. doi: 10.1056/NEJM198805123181903. [DOI] [PubMed] [Google Scholar]
- 49.Sherman A. Contributions of modeling to understanding stimulus-secretion coupling in pancreatic β-cells. Am J Physiol. 1996;271:362–372. doi: 10.1152/ajpendo.1996.271.2.E362. [DOI] [PubMed] [Google Scholar]
- 50.Sherman A, Rinzel J, Keizer J. Emergence of organized bursting in clusters of pancreatic β-cells by channel sharing. Biophys J. 1988;54:411–425. doi: 10.1016/S0006-3495(88)82975-8. [DOI] [PMC free article] [PubMed] [Google Scholar]
- 51.Smolen P. A model for glycolytic oscillations based on skeletal muscle phosphofructokinase kinetics. J Theor Biol. 1995;174:137–148. doi: 10.1006/jtbi.1995.0087. [DOI] [PubMed] [Google Scholar]
- 52.Smolen P, Keizer J. Slow voltage inactivation of Ca2+ currents and bursting mechanisms for the mouse pancreatic β-cell. J Membrane Biol. 1992;127:9–19. doi: 10.1007/BF00232754. [DOI] [PubMed] [Google Scholar]
- 53.Smolen P, Terman D, Rinzel J. Properties of a bursting model with two slow inhibitory variables. SIAM J Appl Math. 1993;53:861–892. [Google Scholar]
- 54.Somers D, Kopell N. Rapid synchronization through fast threshold modulation. Biol Cybern. 1993;68:393–407. doi: 10.1007/BF00198772. [DOI] [PubMed] [Google Scholar]
- 55.Tornheim K. Oscillations of the glycolytic pathway and the purine nucleotide cycle. J Theor Biol. 1979;79:491–541. doi: 10.1016/0022-5193(79)90240-6. [DOI] [PubMed] [Google Scholar]
- 56.Tornheim K. Are metabolic oscillations responsible for normal oscillatory insulin secretion? Diabetes. 1997;46:1375–1380. doi: 10.2337/diab.46.9.1375. [DOI] [PubMed] [Google Scholar]
- 57.Tornheim K, Lowenstein JM. The purine nucleotide cycle: IV. Interactions with oscillations of the glycolytic pathway in muscle extracts. J Biol Chem. 1974;249:3241–3247. [PubMed] [Google Scholar]
- 58.Tornheim K, Lowenstein JM. The purine necleotide cycle: Control of phosphofructokinase and glycolytic oscillations in muscle extracts. J Biol Chem. 1975;250:6304–6314. [PubMed] [Google Scholar]
- 59.Tsaneva-Atanasova K, Sherman A. Accounting for near-normal glucose sensitivity in Kir 6.2AAA transgenic mice. Biophys J. 2009;97:2409–20. doi: 10.1016/j.bpj.2009.07.060. [DOI] [PMC free article] [PubMed] [Google Scholar]
- 60.Vidal A, Clement F. A dynamic model for the control of the gonadotrophin-releasing hormone neurosecretory system. J Neuroendocrinol. 2010;22:1251–1266. doi: 10.1111/j.1365-2826.2010.02055.x. [DOI] [PubMed] [Google Scholar]
Associated Data
This section collects any data citations, data availability statements, or supplementary materials included in this article.


