

Abstract
Background
Crohn's disease (CD) is an intractable inflammatory bowel disease of unknown cause. Recent genome-wide association studies of CD in Korean and Japanese populations suggested marginal sharing of susceptibility loci between Caucasian and Asian populations. As the 7 identified loci altogether explain 5.31% of the risk for CD, the objective of this study was to identify additional CD susceptibility loci in the Korean population.
Methods
Using the ImmunoChip custom single-nucleotide polymorphism array designed for dense genotyping of 186 loci identified through GWAS, we analyzed 722 individuals with CD and 461 controls for 96,048 SNP markers in the discovery stage, followed by validation in an additional 948 affected individuals and 977 controls.
Results
We confirmed 6 previously reported loci in Caucasian: GPR35 at 2q37 (rs3749172; P = 5.30 × 10⁻¹¹, odds ratio [OR] = 1.45), ZNF365 at 10q21 (rs224143; P = 2.20 × 10⁻⁹, OR = 1.38), ZMIZ1 at 10q22 (rs1250569; P = 3.05 × 10⁻⁷, OR = 1.30), NKX2-3 at 10q24 (rs4409764; P = 7.93 × 10⁻⁸, OR = 1.32), PTPN2 at 18p11 (rs514000; P = 9.00 × 10⁻⁸, OR = 1.33), and USP25 at 21q11 (rs2823256; P = 2.49 × 10⁻⁷, OR = 1.35), bringing the number of known CD loci (including 3 in the HLA) in Koreans to 15. The 6 additional loci increased the total genetic variance for CD risk from 5.31% to 7.27% in Koreans.
Conclusions
Although the different genetic backgrounds of CD between Asian and Western countries has been well established for the major susceptibility genes, our findings of overlapping associations offer new insights into the genetic architecture of CD.
Keywords: Crohn's disease, genetics, ImmunoChip, Korean
Crohn's disease (CD) is a chronic inflammatory disorder of the gastrointestinal tract characterized by persistent inflammation, often granulomatous, which affects all layers of the bowel wall. Being a complex disease, both genetic susceptibility and environmental factors are likely to be involved in the pathogenesis of CD. The current working hypothesis is that CD arises as a consequence of dysregulated mucosal immune responses to the gut flora in genetically susceptible individuals.1 Recent studies from China, Japan, and Korea have shown that the incidence of inflammatory bowel disease (IBD) is rapidly increasing in these countries.2–5 Despite identifying more than 140 susceptibility loci to CD in Caucasian through genome-wide association studies (GWASs) and meta-anal-yses,6–12 the heritability of CD has not been fully explained.12 Recent GWASs in Japanese and Korean populations identified several more CD susceptibility loci that are not significant in Caucasian populations.13,14 These include 2 intergenic regions on chromosomes 4p14 and 10q25, the ATG16L2-FCHSD2 region on chromosome 11q13 and the SLC25A15-ELF1-WBP4 region on chromosome 13q14.
The lack of an association of the well-established Caucasian CD susceptibility genes, NOD215–17 and ATG16L1,18–20 in Asian populations suggests that there are differences in genetic susceptibility to CD between Asian and Western populations.15–20 Furthermore, reports on the role of IL23R in Asian CD have been inconsistent.18–21 However, more recent studies suggest that there is association with CD at IL23R, at least in the Korean population, although the association is with a different variant (Gly149Arg) not present in Caucasian, the well-documented Caucasian-associated single-nucleotide polymorphism (SNP) (Arg381Gln) was monomorphic in the Korean population.14,21 The CD association of TNFSF15 has been confirmed in Asian and Caucasian cohorts.6,22–24 Collectively, these findings emphasized the importance of genetic studies across different ethnicities.
Full details of the design and content of the ImmunoChip (Illumina, San Diego, CA) array have been previously described.25,26 Briefly, the ImmunoChip consists of all known SNPs from the 1000 Genomes Project (February 2010 release) and private resequencing efforts for 186 loci previously identified as showing association with 12 immune-mediated diseases including CD. For each disease, ∼3000 SNPs were selected from available GWAS data for deep replication and to cover strong candidate genes. The ImmunoChip was designed based on SNPs identified in individuals of European origin and non-European variation that may be underrepresented. This platform provides an opportunity to identify new CD associations with loci implicated in other autoimmune diseases and permits fine-mapping experiments. In this study, we used the ImmunoChip to identify additional susceptibility loci for CD in Koreans and expand our knowledge of the genetic architecture of CD in this population.
Materials and Methods
Study Population
A total of 1670 patients with CD and 1438 unrelated healthy controls, divided into 2 independent cohorts, were included in this study. The clinical characteristics of the study subjects are shown in Table, Supplemental Digital Content 1, http://links.lww.com/IBD/A647. All study participants were of Korean descent. All 722 patients with CD in the ImmunoChip screening cohort and 156 of 948 patients with CD from the replication cohort were recruited from the IBD Clinic of Asan Medical Center. The remaining 792 patients with CD from the replication cohort were registered through the Korea Research Network for Crohn's Disease. Diagnosis of CD was made on the basis of standard clinical, radiologic, endoscopic, and histopathologic criteria.27 Patients with indeterminate colitis were excluded from the study. The patients with CD were subgrouped using the Montreal classification with minor modifications,28 briefly according to age at diagnosis (A1: ≤16 yr; A2: 17–40 yr; A3: >40 yr), disease location (L1, terminal ileum; L2, colon; L3, ileocolon), and disease behavior (B1, inflammatory; B2, stricturing; B3, penetrating). Upper gastrointestinal and perianal disease modifiers of the Montreal classification system were not included in our classification scheme. Controls for the ImmunoChip and replication cohort consisted of 461 healthy controls recruited from the University of Ulsan College of Medicine and the Asan Medical Center, 720 from Seoul National University, and 257 provided by the Gyeongsang National University Hospital, a member of the National Biobank of Korea. All samples were obtained after provision of written informed consent under protocols approved by institutional review board.
Genotyping and Quality Controls
ImmunoChip genotyping of the 726 CD cases and 469 controls was performed at the Cedars-Sinai Medical Center, Los Angeles. All SNPs on the X, Y, and mitochondrial chromosomes as well as copy number variation-related SNPs were excluded. As part of quality control, SNPs were excluded if they had a call rate lower than 90%, a minor allele frequency <0.01, or significant deviation from Hardy–Weinberg equilibrium in the controls (P < 2.5 × 10⁻⁷). In total, 44,836 SNPs failed and were zeroed out. Of the SNPs which did not fail, 43,340 SNPs were monomorphic, 11,665 SNPs (controls) and 11,807 SNPs (cases) were removed due to minor allele frequency >0 but <0.01. Similarly, we removed all samples with a genotyping rate <96% from further analysis. Only 96,048 SNP remained for further quality control.
We examined the potential genetic relatedness of the 1195 samples based on pair-wise identity-by-state analysis using PLINK 1.07 software. For each of the identified first-degree relative pairs, the samples with the lower genotype call rates were removed. In total, 12 samples were removed due to sample duplications and/or genetic relatedness (4 cases and 8 controls). After the SNP and sample quality control analyses, we finally used the genotyping data of 96,048 SNPs in 722 cases and 461 controls in the ImmunoChip analysis.
Imputation
For the imputation analysis, untyped genotypes were imputed in the GWAS samples by using the Asian reference panel (JPT + CHB) from the 1000 Genomes Project databases (February 2012 release) by using IMPUTE (v2.0).29 Imputed genotypes with a genotype probability of <90% and SNPs with an imputation certainty <80% (based on information scores of imputation results), a minor allele frequency <0.05 and a missing rate of >10% of genotypes were eliminated from further analysis. A total of 453,532 imputed SNPs passed quality control and were combined with 96,084 genotyped SNPs for association analysis.
Replication
Genotyping for validation was done with iPLEX on a matrix-assisted laser desorption/ionization time-of-flight MassARRAY platform (Sequenom, San Diego, CA) at the Analytical Genetics Technology Center, Princess Margaret Hospital, University Health Network in Toronto, Canada. Validation of rs3749172 and rs77910374 was performed using TaqMan SNP genotyping assays.
Variance
The percentage of genetic variance explained by each of the CD risk alleles was estimated with the algorithm developed by So et al,30 under a liability threshold model.31 This model proposes a latent continuous liability, which is assumed to be normally distributed with mean 0 and variance 1. We assumed a CD prevalence of 0.0112% in the Korean population.32 To calculate the heritability explained by a single variant, we used the allele frequency, odds ratio (OR), and disease prevalence.
Statistical Analysis
Single-marker association analyses were performed using the Cochran–Armitage trend test. A quantile–quantile plot was generated using R (2.13.1) to evaluate the overall significance of the genome-wide associations and the potential impact of population stratification. The impact of population stratification was also evaluated by calculating the genomic control inflation factor. As our genomic control value (λGC) of 1.218 used for correction was based on all the SNPs, our correction of population stratification by genomic control is conservative and may have overcorrected the P values. The statistical evidence of association might be stronger than what have been reported here. The Manhattan plot of −log10 P was generated using Haploview (v4.2). Replication analyses were performed by analyzing 1 follow-up sample separately and then analyzing the combined sample of all the cases and controls. Association analyses of the combined samples were performed using Cochran–Mantel–Haenszel stratification analysis. A Breslow–Day test was used to test for heterogeneity between the ORs for different sample cohorts.
Bioinformatics Analysis
For the prediction of the evolutionary conservation of a functional variant, the PhastCons46wayPlacental and PhyloP scores were obtained from the UCSC Genome Browser. Prediction of the possible impact of an amino acid substitution on protein function was performed by using the SIFT (sorting intolerant from tolerant) (http://sift.jcvi.org) and PolyPhen-2 (polymorphism phenotyping v2) (http://genetics.bwh.harvard.edu/pph2) algorithms.33,34 A SIFT and PolyPhen-2 prediction of “deleterious” and/or “probably/possibly damaging” were considered to predict an effect on protein function.
Results
Associations Detected at Previously Identified CD Risk Loci
The workflow of the project is shown in Figure, Supplemental Digital Content 2, http://links.lww.com/IBD/A648. After stringent quality control measures (see Materials and Methods) and principal-component analysis (Fig., Supplemental Digital Content 3, http://links.lww.com/IBD/A649), we further analyzed 96,048 SNPs in 722 cases and 461 controls (average call rate of 99.98%) using a trend test in logistic regression. The quantile-quantile and Manhattan plots of the observed P values (Fig. 1; see Fig., Supplemental Digital Content 4, http://links.lww.com/IBD/A650) were corrected for residual inflation by genomic control (λGC = 1.218) (see Materials and Methods).
FIGURE 1.
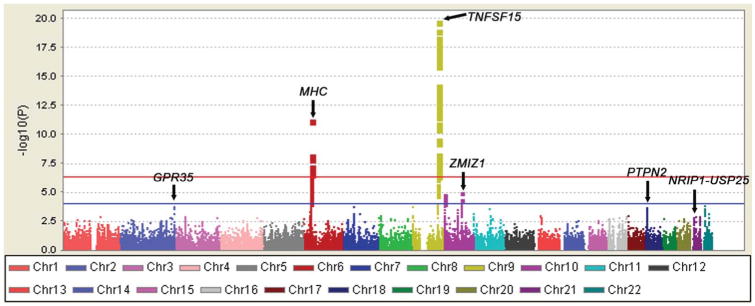
Summary of the ImmunoChip results in 722 cases and 461 controls. −log10 P values corrected for residual inflation by genomic control are shown according to chromosomal location. SNPs within the TNFSF15 locus on 9q32 and the MHC locus achieved genome-wide significance. The red horizontal line indicates SNPs at a genome-wide significance level (P = 5.21 × 10⁻⁷). The blue horizontal line indicates SNPs with P < 1.0 × 10⁻⁴.
After the ImmunoChip analysis, only SNPs from the MHC and TNFSF15 loci achieved genome-wide significance (defined here as P < 5.21 × 10⁻⁷ based on the use of multiple testing correction of 96,048 SNPs) (Fig. 1). SNPs with P < 10−4 were selected for validation. Of 299 SNPs with P < 10−4, 126 SNPs were from the MHC region and 107 SNPs were from the TNFSF15 locus. Of the remaining 66 SNPs from 9 loci (2q37, 7p12, 9p24, 10p15, 10q21, 10q22, 11q13, 18p11, and 22q11) (Table, Supplemental Digital Content 5, http://links.lww.com/IBD/A651), we chose 10 SNPs for validation. The imputation revealed 7 additional SNPs from 7 new loci (4q24, 6q22, 11p15, 11q14, 17p13, 21q11, and 21q21) with P < 10−4, and these were also selected for validation (Table, Supplemental Digital Content 6, http://links.lww.com/IBD/A652).
Of the 17 SNPs selected for validation, genotyping of 16 SNPs from 15 loci was successful in an independent set of 948 CD and 977 control samples (Table, Supplemental Digital Content 7, http://links.lww.com/IBD/A653). Of these, 4 loci attained genome-wide significance (P < 5.21 × 10⁻⁷) in the combined analysis of the ImmunoChip and validation: rs3749172 in GPR35 at 2q37 (combined P = 5.30 × 10⁻¹¹, OR = 1.45), rs514000 in PTPN2 at 18p11 (combined P = 9.00 × 10⁻⁸, OR = 1.33), rs2823256 in USP25 at 21q11 (combined P = 2.49 × 10⁻⁷, OR = 1.35), and rs1250569 in ZMIZ1 at 10q22 (combined P = 3.05 × 10⁻⁷, OR = 1.30) (see Table, Supplemental Digital Content 7, http://links.lww.com/IBD/A653).
The strongest association signal was identified at rs3749172 in GPR35 (G-protein coupled receptor 35), a kynurenic acid receptor, at 2q37 (Table 1 and Fig. A, Supplemental Digital Content 8, http://links.lww.com/IBD/A654). The variant leads to an amino acid substitution (polar uncharged serine to basic arginine) at position 294 of the C-terminal topological domain. A search for a measurement of interspecies conservation at rs3749172 (1000 bp) in the UCSC Genome Browser database revealed PhyloP and PhastCons score of 0.47 and 0.32, respectively, suggesting that it is evolutionarily conserved. In silico evaluation of rs3749172 using the SIFT and PolyPhen-2 predicted the substitution to be tolerated (0.63) and benign (0.001), respectively.
TABLE 1. Summary of Results for 6 SNPs Associated with CD in Koreans.
| No. Samples | RAF | |||||||||||
|---|---|---|---|---|---|---|---|---|---|---|---|---|
|
|
|
|||||||||||
| SNP | Risk Allele | Chromosome Location | Gene(s) or Locus | Study | Case | Control | Case | Control | Pa | OR | 95% CI | P-BDb |
| rs3749172 | A | Chr2: 241,570,249 | GPR35 | Immunochip | 722 | 461 | 0.36 | 0.28 | 5.57 × 10⁻⁵ | 1.44 | 1.20–1.72 | |
| Replication | 894 | 967 | 0.35 | 0.27 | 7.31 × 10⁻⁸ | 1.50 | 1.29–1.74 | |||||
| Combinedc | 1616 | 1428 | 0.36 | 0.28 | 5.30 × 10⁻¹¹ | 1.45 | 1.29–1.61 | 0.912 | ||||
| rs224143 | G | Chr10: 64,477,836 | (ZNF365) | Immunochip | 722 | 461 | 0.67 | 0.60 | 3.31 × 10⁻⁴d | 1.36 | 1.15–1.60 | |
| Replication | 938 | 966 | 0.66 | 0.59 | 3.24 × 10⁻⁶ | 1.37 | 1.20–1.56 | |||||
| Combinedc | 1660 | 1427 | 0.67 | 0.59 | 2.20 × 10⁻⁹ | 1.38 | 1.24–1.53 | 0.922 | ||||
| rs1250569 | T | Chr10: 81,045,207 | ZMIZI | Immunochip | 722 | 461 | 0.57 | 0.47 | 1.41 × 10⁻⁶ | 1.51 | 1.28–1.79 | |
| Replication | 945 | 975 | 0.53 | 0.48 | 6.45 × 10⁻³ | 1.19 | 1.05–1.35 | |||||
| Combinedc | 1667 | 1436 | 0.55 | 0.48 | 3.05 × 10⁻⁷ | 1.30 | 1.18–1.44 | 0.030 | ||||
| rs4409764 | T | Chr10: 101,284,237 | (NKX2-3) | Immunochip | 722 | 461 | 0.51 | 0.46 | 1.18 × 10⁻²d | 1.24 | 1.05–1.47 | |
| Replication | 932 | 955 | 0.53 | 0.45 | 7.40 × 10⁻⁷ | 1.39 | 1.22–1.59 | |||||
| Combinedc | 1654 | 1416 | 0.52 | 0.46 | 7.93 × 10⁻⁸ | 1.32 | 1.19–1.46 | 0.308 | ||||
| rs514000 | C | Chr18: 12,854,072 | PTPN2 | Immunochip | 722 | 461 | 0.39 | 0.30 | 4.94 × 10⁻⁵ | 1.43 | 1.20–1.70 | |
| Replication | 941 | 974 | 0.40 | 0.34 | 4.13 × 10⁻⁴ | 1.27 | 1.11–1.44 | |||||
| Combinedc | 1663 | 1435 | 0.39 | 0.33 | 9.00 × 10⁻⁸ | 1.33 | 1.20–1.48 | 0.238 | ||||
| rs2823256 | G | Chr21: 16,784,706 | (NRIP1, USP25) | Immunochip | 722 | 461 | 0.75 | 0.69 | 7.01 × 10⁻⁴e | 1.38 | 1.14–1.66 | |
| Replication | 939 | 968 | 0.76 | 0.70 | 6.45 × 10⁻⁵ | 1.35 | 1.16–1.56 | |||||
| Combinedc | 1661 | 1429 | 0.76 | 0.70 | 2.49 × 10⁻⁷ | 1.35 | 1.20–1.51 | 0.814 | ||||
CI, confidence interval; OR, odds ratio; RAF, risk allele frequency.
P value obtained from Cochrane–Armitage trend test.
P BD: asymptotic P value of the Breslow–Day (BD) test for heterogeneity of the odds ratio.
Combined: combined P value (PCMH) and combined OR were calculated by Cochran–Mantel–Haenszel (CMH) test statistic (1 df).
These SNPs were selected as reported SNPs in Caucasian GWAS studies.
This SNP was selected as the proxy of rs200642633 (insertion/deletion SNP) (r2 = 0.91, D′ = 0.96).
The second locus identified was at rs514000 on 18p11 (OR = 1.33; 95% CI, 1.20–1.48, combined P = 9.00 × 10⁻⁸) in intron 2 of PTPN2 (protein tyrosine phosphatase, nonreceptor type 2) (Table 1 and Fig. E, Supplemental Digital Content 8, http://links.lww.com/IBD/A654). In addition, we identified an association with rs2823256 on 21q11, located between NRIP1 (nuclear receptor-interacting protein 1) and USP25 (ubiquitin-specific peptidase 25) (OR = 1.35; 95% CI, 1.20–1.51, combined P = 2.49 × 10⁻⁷) (Table 1 and Fig. F, Supplemental Digital Content 8, http://links.lww.com/IBD/A654). Finally, we also identified an association at rs1250569 on 10q22 located in intron 8 of ZMIZ1 (zinc finger, MIZ-type containing 1) (OR, 1.30; 95% CI, 1.18–1.44, combined P = 3.05 × 10⁻⁷) (Table 1 and Fig. C, Supplemental Digital Content 8, http://links.lww.com/IBD/A654). ZMIZ1 encodes a member of the PIAS (protein inhibitor of activated STAT) family of proteins and regulates the activity of various transcription factors, including the androgen receptor.
Comparison with Caucasian Data
We then compared our data with 140 CD loci recently reported in Caucasian.12 Of the 140 loci, Korean data were available for 111 loci (Table, Supplemental Digital Content 9, http://links.lww.com/IBD/A655). Of the 111 loci, 9 loci with P < 1 × 10⁻⁴ were already selected for validation in the replication cohort after the ImmunoChip screening: the MHC region, TNFSF15, GPR35 at 2q37, ZPBP-IKZF1-DDC at 7p12, JAK2 at 9p24, ZMIZ1 at 10q22, PTPN2 at 18p11, and NRIP1-USP25 at 21q11, and UBE2L3 at 22q11. Of the remaining 102 loci, none showed significant associations after Bonferroni correction (P < 4.5 × 10⁻⁴). However, 13 loci showed consistent association at a nominal P value of ≤ 0.05 in Koreans that required further validation: B3GNT2-TMEM17, MST1, ZNF300, IL12B, LOC100506647-JARID2, PHACTR2, RNASET2-FGFR1OP-CCR6, ZNF365-ADO, NKX2-3, PRKCB, IKZF3-ORMDL3, DNMT3B, and CD40. Of these 13 loci, only 7 loci were successfully validated in the replication cohort (RNASET2-FGFR1OP-CCR6, ZNF365, NKX2-3, PRKCB, IKZF3-ORMDL3, DNMT3B, and CD40) (Table, Supplemental Digital Content 10, http://links.lww.com/IBD/A656). Of the 7 loci successfully validated in Koreans, 2 loci—ZNF365 and NKX2-3—achieved genome-wide significance for association with CD in Koreans (rs224143: OR = 1.38; 95% CI, 1.24–1.53, combined P = 2.20 × 10⁻⁹; rs4409764: OR = 1.32; 95% CI, 1.19–1.46, combined P = 7.93 × 10⁻⁸) (Table 1, Table, Supplemental Digital Content 10, http://links.lww.com/IBD/A656, and Fig. B and D, Supplemental Digital Content 8, http://links.lww.com/IBD/A654).
Subphenotype Analysis of the 6 CD Susceptibility Loci
We then examined the association between the 6 SNPs identified in this study and CD subgroups classified by disease location and behavior based on the Montreal classification and history of perianal fistula.28 In the case of subphenotype–control analyses, rs1250569 in intron 8 of ZMIZ1 showed a significant association with ileocolonic (L3) involvement (P = 4.30 × 10⁻⁸, OR = 1.44; 95% CI, 1.26–1.65) (data not shown), a stronger association than those of the overall case-control analyses. Case–case comparisons between the CD subgroups failed to show any significant differences in the frequencies of alleles between the CD subgroups (data not shown).
Variance
Next, the percentage of genetic variance explained by each of the CD risk alleles was estimated using the algorithm developed by So et al30 under a liability threshold model.31 Based on the CD prevalence of 0.0112% in Koreans,32 the 6 confirmed and 7 previously reported loci (including 3 in the MHC region) together accounted for 5.99% of the total genetic risk in Koreans (Table, Supplemental Digital Content 11, http://links.lww.com/IBD/A657). Addition of the 2 new loci, rs6856616 at 4p14 and rs11195128 at 10q25, identified by GWAS but not present in the ImmunoChip increased total genetic variance for CD risk to 7.27% in Koreans.
Discussion
In this study, we used the ImmunoChip custom SNP array to identify 6 additional CD susceptibility loci in the Korean population, which increased the total explained genetic variance of CD risk to 7.27% in Koreans. The 6 susceptibility loci identified in the ImmunoChip analysis were all previously reported in Caucasian with the associations in the same direction, suggesting common pathways for CD in Caucasian and Asians.
A few key points can be made by comparing our data with those reported previously. First, not all of the reported loci are covered by the ImmunoChip. Of the 3 novel loci, we identified in a GWAS of CD in Koreans, only 1 novel locus at 11q13 was present in the ImmunoChip and gave a combined P value of 3.28 × 10⁻⁶ for rs12294037, confirming our previous data (see Table, Supplemental Digital Content 7, http://links.lww.com/IBD/A653). Failure of replication of the other 2 intergenic loci, 4p14 and 10q25, seems to be due to poor coverage of some previously reported loci by the ImmunoChip array. The best ImmunoChip signal near our GWAS signal rs6856616 on 4p14 was rs6840119 (P = 0.131), 54.5 kb away and not in LD (r2 = 0.18), and the best ImmunoChip signal near our GWAS signal rs1195128 on 10q25 was rs4918510 (P = 0.021), 21.5 kb away and not in LD (r2 = 0.26). There were 29 and 9 genotyped SNPs present in the ImmunoChip in the region flanking 400 kb on either side of the marker SNPs, rs6840119 on 4p14 and rs4918510 on 10q25, whereas there were 257 and 200 SNPs in our GWAS data, respectively. This finding again highlights the importance of the coverage of common variations of the Asian genome in currently available GWAS genotyping chips and the ImmunoChip.
Second, why we could not replicate many established European CD loci could be due to the following reasons: (1) sample size; (2) LD structure; and (3) heterogeneity in etiology between ethnicities. Because of our small sample size, the statistical power is a major concern. As our study had limited power for detecting the previously reported 140 CD risk loci at a P value of 0.05, more loci would be expected to be replicated in the Asian population by future studies with much larger sample sizes. Regarding LD structure, all of the 6 loci identified in this study showed LD structures similar to those of Caucasian. If there is a fundamental difference in LD patterns across associated loci, the established European loci will not be found even with a large sample size. In addition, there might be population-specific loci.
As there are limited data available for other populations, it would take some effort to determine whether the pathway for the CD is the same or not across populations. However, currently available data supports the ethnicity dependence of the major susceptibility genes for CD. Recent GWASs of CD in Korean and Japanese populations identified several more CD susceptibility loci not significant in Caucasian.13,14 Asian GWASs have shown that the TNFSF15 polymorphism is the only one with an OR >2, by far the greatest risk for CD. Other variations in the MHC region, IL23R, were reported to be highly associated with CD but with an OR value between 1.5 and 2. All of the 6 loci identified in this study showed an OR <1.5. Identification of additional CD susceptibility genes common to both Caucasian and Asians suggest that common pathways are involved in the CD susceptibility, despite the differences in the major susceptibility genes between Caucasian and Asians. These data highlight differences in the magnitude of the contribution of these loci to CD susceptibility by ethnicity. Our findings offer new insights into the genetic architecture of CD and support the complementary value of genetic studies in different populations.
URLS and WEB Resources
URLs
R, http://www.r-project.org/; LocusZoom, http://csg.sph.umich.edu/locuszoom/; PLINK, http://pngu.mgh.harvard.edu/∼purcell/plink/; IMPUTEv2, https://mathgen.stats.ox.ac.uk/impute/impute_v2.html; Quanto, http://hydra.usc.edu/gxe/; SIFT (sorting intolerant from tolerant), http://sift.jcvi.org; PolyPhen-2 (polymorphism phenotyping v2), http://genetics.bwh.harvard.edu/pph2
Web Resources
The URLs for the data presented herein are as follows: The 1000 Genome Project, http://www.1000genomes.org/; UCSC Genome Browser, http://genome.ucsu.edu/.
Supplementary Material
Acknowledgments
The authors thank all participating patients and healthy donors who provided the DNA and clinical information necessary for this study. They acknowledge use of the case DNA collection from the Korea Research Network for Crohn's Disease (Drs. Chang Hwan Choi, Hyun Joo Park, Won Moon, You Sun Kim, Suck-Ho Lee, Bo-In Lee, Jin Oh Kim, Kyu Chan Huh, Young Sook Park, Seok Won Jung, Kwang Ho Baik, HiunSuk Chae, Geun Am Song, Sam Ryong Jee, Dong Soo Han, EunSoo Kim, Sung Hee Jung, Chan-Guk Park, EunJeong Jang, Il Hyun Baek, Joo Sung Kim, Kang-Moon Lee, Jae Kyu Sung, Kyung Ho Kim, and Yoon Tae Jeen).
Supported by a Midcareer Researcher Program grant through the NRF (National Research Foundation of Korea) to K. Song (2010–0015648, 2014R1 A2A1A09005824) funded by the Ministry of Science, Information & Communication Technology and Future Planning and a Korean Health Technology R&D Project grant to S-K. Yang (A120176) from the Ministry of Health & Welfare, the Republic of Korea.
Footnotes
Supplemental digital content is available for this article. Direct URL citations appear in the printed text and are provided in the HTML and PDF versions of this article on the journal's Web site (www.ibdjournal.org).
The authors have no conflicts of interest to disclose.
References
- 1.Khor B, Gardet A, Xavier RJ. Genetics and pathogenesis of inflammatory bowel disease. Nature. 2011;474:307–317. doi: 10.1038/nature10209. [DOI] [PMC free article] [PubMed] [Google Scholar]
- 2.Yang SK, Loftus EV, Jr, Sandborn WJ. Epidemiology of inflammatory bowel disease in Asia. Inflamm Bowel Dis. 2001;7:260–270. doi: 10.1097/00054725-200108000-00013. [DOI] [PubMed] [Google Scholar]
- 3.Yang SK, Yun S, Kim JH, et al. Epidemiology of inflammatory bowel disease in the Songpa-Kangdong district, Seoul, Korea, 1986-2005: a KASID study. Inflamm Bowel Dis. 2008;14:542–549. doi: 10.1002/ibd.20310. [DOI] [PubMed] [Google Scholar]
- 4.Prideaux L, Kamm MA, De Cruz PP, et al. Inflammatory bowel disease in Asia: a systematic review. J Gastroenterol Hepatol. 2012;27:1266–1280. doi: 10.1111/j.1440-1746.2012.07150.x. [DOI] [PubMed] [Google Scholar]
- 5.Zheng JJ, Zhu XS, Huangfu Z, et al. Prevalence and incidence rates of Crohn's disease in main land China: a meta-analysis of 55 years of research. J Dig Dis. 2010;11:161–166. doi: 10.1111/j.1751-2980.2010.00431.x. [DOI] [PubMed] [Google Scholar]
- 6.Yamazaki K, McGovern D, Ragoussis J, et al. Single nucleotide polymorphisms in TNFSF15 confer susceptibility to Crohn's disease. Hum Mol Genet. 2005;14:3499–3506. doi: 10.1093/hmg/ddi379. [DOI] [PubMed] [Google Scholar]
- 7.Duerr RH, Taylor KD, Brant SR, et al. A genome-wide association study identifies IL23R as an inflammatory bowel disease gene. Science. 2006;314:1461–1463. doi: 10.1126/science.1135245. [DOI] [PMC free article] [PubMed] [Google Scholar]
- 8.Rioux JD, Xavier RJ, Taylor KD, et al. Genome-wide association study identifies new susceptibility loci for Crohn's disease and implicates autophagy in disease pathogenesis. Nat Genet. 2007;39:596–604. doi: 10.1038/ng2032. [DOI] [PMC free article] [PubMed] [Google Scholar]
- 9.Hampe J, Franke A, Rosenstiel P, et al. A genome-wide association scan of nonsynonymous SNPs identifies a susceptibility variant for Crohn's disease in ATG16L1. Nat Genet. 2007;39:207–211. doi: 10.1038/ng1954. [DOI] [PubMed] [Google Scholar]
- 10.The Wellcome Trust Case Control Consortium. Genome-wide association study of 14,000 cases of seven common diseases and 3,000 shared controls. Nature. 2007;447:661–678. doi: 10.1038/nature05911. [DOI] [PMC free article] [PubMed] [Google Scholar]
- 11.Parkes M, Barrett JC, Prescott NJ, et al. Sequence variants in the autophagy gene IRGM and multiple other replicating loci contribute to Crohn's disease susceptibility. Nat Genet. 2007;39:830–832. doi: 10.1038/ng2061. [DOI] [PMC free article] [PubMed] [Google Scholar]
- 12.Jostins L, Ripke S, Weersma RK, et al. Host-microbe interactions have shaped the genetic architecture of inflammatory bowel disease. Nature. 2012;491:119–124. doi: 10.1038/nature11582. [DOI] [PMC free article] [PubMed] [Google Scholar]
- 13.Yamazaki K, Umeno J, Takahashi A, et al. A genome-wide association study identifies 2 susceptibility loci for Crohn's disease in a Japanese population. Gastroenterology. 2013;144:781–788. doi: 10.1053/j.gastro.2012.12.021. [DOI] [PubMed] [Google Scholar]
- 14.Yang SK, Hong M, Zhao W, et al. Genome-wide association study of Crohn's disease in Koreans revealed three new susceptibility loci and common attributes of genetics susceptibility across ehtnic populations. Gut. 2014;63:80–87. doi: 10.1136/gutjnl-2013-305193. [DOI] [PubMed] [Google Scholar]
- 15.Inoue N, Tamura K, Kinouchi Y, et al. Lack of common NOD2 variants in Japanese patients with Crohn's disease. Gastroenterology. 2002;123:86–91. doi: 10.1053/gast.2002.34155. [DOI] [PubMed] [Google Scholar]
- 16.Leong RW, Armuzzi A, Ahmad T, et al. NOD2/CARD15 gene polymorphisms and Crohn's disease in the Chinese population. Aliment Pharmacol Ther. 2003;17:1465–1470. doi: 10.1046/j.1365-2036.2003.01607.x. [DOI] [PubMed] [Google Scholar]
- 17.Croucher PJ, Mascheretti S, Hampe J, et al. Haplotype structure and association to Crohn's disease of CARD15 mutations in two ethnically divergent populations. Eur J Hum Genet. 2003;11:6–16. doi: 10.1038/sj.ejhg.5200897. [DOI] [PubMed] [Google Scholar]
- 18.Ng SC, Tsoi KK, Kamm MA, et al. Genetics of inflammatory bowel disease in Asia: systematic review and meta-analysis. Inflamm Bowel Dis. 2012;18:1164–1176. doi: 10.1002/ibd.21845. [DOI] [PubMed] [Google Scholar]
- 19.Yamazaki K, Onouchi Y, Takazoe M, et al. Association analysis of genetic variants in IL23R, ATG16L1 and 5p13.1 loci with Crohn's disease in Japanese patients. J Hum Genet. 2007;52:575–583. doi: 10.1007/s10038-007-0156-z. [DOI] [PubMed] [Google Scholar]
- 20.Yang SK, Park M, Lim J, et al. Contribution of IL23R but not ATG16L1 to Crohn's disease susceptibility in Koreans. Inflamm Bowel Dis. 2009;15:1385–1390. doi: 10.1002/ibd.20921. [DOI] [PubMed] [Google Scholar]
- 21.Kim SW, Kim ES, Moon CM, et al. Genetic polymorphisms of IL-23R and IL-17A and novel insights into their associations with inflammatory bowel disease. Gut. 2011;60:1527–1536. doi: 10.1136/gut.2011.238477. [DOI] [PubMed] [Google Scholar]
- 22.Picornell Y, Mei L, Taylor K, et al. TNFSF15 is an ethnic-specific IBD gene. Inflamm Bowel Dis. 2007;13:1333–1338. doi: 10.1002/ibd.20223. [DOI] [PMC free article] [PubMed] [Google Scholar]
- 23.Kakuta Y, Kinouchi Y, Negoro K, et al. Association study of TNFSF15 polymorphisms in Japanese patients with inflammatory bowel disease. Gut. 2006;55:1527–1528. doi: 10.1136/gut.2006.100297. [DOI] [PMC free article] [PubMed] [Google Scholar]
- 24.Yang SK, Lim J, Chang HS, et al. Association of TNFSF15 with Crohn's disease in Koreans. Am J Gastroenterol. 2008;103:1437–1442. doi: 10.1111/j.1572-0241.2007.01752.x. [DOI] [PubMed] [Google Scholar]
- 25.Cortes A, Brown MA. Promise and pitfalls of the immunochip. Arthritis Res Ther. 2011;13:101–103. doi: 10.1186/ar3204. [DOI] [PMC free article] [PubMed] [Google Scholar]
- 26.Parkes M, Cortes A, Van Heel DA, et al. Genetic insights into common pathways and complex relationships among immune-mediated diseases. Nat Rev Genet. 2013;14:661–673. doi: 10.1038/nrg3502. [DOI] [PubMed] [Google Scholar]
- 27.Lennard-Jones JE. Classificaiton of inflammatory bowel disease. Scand J Gastroenterol. 1989;(suppl 170):2–6. doi: 10.3109/00365528909091339. discussion 16–19. [DOI] [PubMed] [Google Scholar]
- 28.Silverberg MS, Satsangi J, Ahmad T, et al. Toward an integrated clinical, molecular and serological classification of inflammatory bowel disease: Report of a Working Party of the 2005 Montreal World Congress of Gastroenterology. Can J Gastroenterol. 2005;19(suppl A):5–36. doi: 10.1155/2005/269076. [DOI] [PubMed] [Google Scholar]
- 29.Howie BN, Donnelly P, Marchini J. A flexible and accurate genotype imputation method for the next generation of genome-wide association studies. Plos Genet. 2009;5:e1000529. doi: 10.1371/journal.pgen.1000529. [DOI] [PMC free article] [PubMed] [Google Scholar]
- 30.So HC, Gui AH, Cherny SS, et al. Evaluating the heritability explained by known susceptibility variants: a survey of ten complex diseases. Genet Epidemiol. 2011;35:310–317. doi: 10.1002/gepi.20579. [DOI] [PubMed] [Google Scholar]
- 31.Falconer DS. The inheritance of liability to certain diseases, estimated from the incidence among relatives. Ann Hum Genet. 1965;29:51–76. [Google Scholar]
- 32.Kim ES, Kim WH. Epidemiology of IBD in Korea: Epidemiological, genomic, clinical, and therapeutic characteristics. Gut Liver. 2010;4:1–14. doi: 10.5009/gnl.2010.4.1.1. [DOI] [PMC free article] [PubMed] [Google Scholar]
- 33.Kumar P, Henikoff S, Ng PC. Predicting the effects of coding non-synonymous variants on protein function using the SIFT algorithm. Nat Protoc. 2009;4:1073–1081. doi: 10.1038/nprot.2009.86. [DOI] [PubMed] [Google Scholar]
- 34.Adzhubei IA, Schmidt S, Peshkin L, et al. A method and server for predicting damaging missense mutations. Nat Methods. 2010;7:248–249. doi: 10.1038/nmeth0410-248. [DOI] [PMC free article] [PubMed] [Google Scholar]
Associated Data
This section collects any data citations, data availability statements, or supplementary materials included in this article.