Abstract
Structured Abstract
Objective
Homozygosity for a 1.7kb intragenic duplication of the Haptoglobin (Hp) gene (Hp 2-2 genotype), present in 36% of the population, has been associated with a 2–3 fold increased incidence of atherothrombosis in individuals with Diabetes (DM) in 10 longitudinal studies compared to DM individuals not homozygous for this duplication (Hp 1-1/2-1). The increased CVD risk associated with the Hp 2-2 genotype has been shown to be prevented with vitamin E supplementation in man. We sought to determine if there was an interaction between the Hp genotype and vitamin E on atherosclerotic plaque growth and stability in a transgenic model of the Hp polymorphism.
Methods and Results
Brachiocephalic artery atherosclerotic plaque volume was serially assessed by high resolution ultrasound in 28 Hp 1-1 and 26 Hp 2-2 mice in a C57Bl/6 ApoE−/− background. Hp 2-2 mice had more rapid plaque growth and an increased incidence of plaque hemorrhage and rupture. Vitamin E significantly reduced plaque growth in Hp 2-2 but not in Hp 1-1 mice with a significant pharmacogenomic interaction between the Hp genotype and vitamin E on plaque growth.
Conclusions
These results may help explain why vitamin E supplementation in man can prevent CVD in Hp 2-2 DM but not in non Hp 2-2 DM individuals.
Keywords: diabetes, haptoglobin, vitamin E, pharmacogenomics, brachiocephalic artery plaque
The oxidative modification hypothesis of atherosclerosis was developed in response to the observation that atherosclerotic lesions were abundant in oxidized lipid and protein and that oxidation of lipoproteins increased their uptake by scavenger receptors and their atherogenicity [1]. The oxidation modification hypothesis stimulated a large number of studies in animals and in man which attempted to prevent atherosclerosis by administration of high dose antioxidants such as vitamin E [2]. However, antioxidant supplementation has not demonstrated benefit in animals [2] or in man [3–5] in preventing atherosclerosis and its sequelae. One possible reason why these studies failed to show any cardiovascular benefit was the absence of effective selection criteria for determining which individuals should be administered antioxidant supplementation [6].
Extracorpuscular hemoglobin (Hb), as a result of its heme iron cargo, is emerging as a major mediator of vascular disease [7]. The primary mechanism to neutralize and control the fate of extracorpuscular Hb is via the protein haptoglobin (Hp) [8,9]. In man, there is a common Hp functional polymorphism produced by a partial intragenic duplication in the Hp gene. This copy number variant polymorphism is defined by the presence (Hp 2 allele) or absence (Hp 1 allele) of a 1.7 kb in-frame intragenic duplication of exons 3 and 4 of the Hp 1 allele [8,9]. The structure and function of the Hp 2 allelic protein product is markedly different from that of the Hp 1 allelic protein product. For example, the Hp 2 protein is inferior to the Hp 1 protein in preventing Hb-driven oxidative reactions [8–11].
Ten independent longitudinal studies have demonstrated that individuals homozygous for the Hp 2 allele (Hp 2-2 genotype), present in 36% of all DM individuals, have a several fold increased risk of atherothrombosis (i.e., myocardial infarction) in the setting of DM as compared to individuals without the Hp 2-2 genotype and DM [12–21]. We have proposed that this Hp genotype and CVD interaction may be due to Hp genotype differences in the response to intraplaque hemorrhage and in the ability to protect against extracorpuscular Hb in the atherosclerotic plaque [22–26]. We have also demonstrated that the Hp 2-2 protein can bind to HDL and thereby tether Hb to HDL rendering it pro-oxidant and pro-atherogenic [27,28].
Based on the increased oxidative modification of HDL found in Hp 2-2 DM individuals and their increased CVD risk we proposed that the Hp genotype might identify which individuals would benefit from antioxidant therapy [6,15,18]. We have provided support for this hypothesis in three clinical trials demonstrating a significant interaction between Hp genotype and vitamin E on Diabetic CVD (relative CVD risk reduction with vitamin E in Hp 2-2 DM of 35% (95% CI: 9–53%)) [6].
As a result of the magnitude of the apparent beneficial effect of vitamin E in Hp 2-2 DM individuals, a pharmacogenomic algorithm in which all DM individuals would be Hp genotyped followed by administration of vitamin E supplements to those with the Hp 2-2 genotype would have profound public health care implications [18]. Adoption of such an algorithm as a standard of care will require an additional randomized clinical trial. Enthusiasm for funding such a trial has been hampered by the lack of an animal model recapitulating the interaction between vitamin E and the Hp genotype on Diabetic atherosclerotic CVD. In this study we have investigated the interaction of vitamin E and the Hp genotype on diabetic atherosclerotic plaque growth and plaque stability in a novel Hp transgenic model [29].
Research Design and Methods
Animals used in this study
All studies reported here were approved by the Institutional Care and Use Committee (ICUC) of the Technion Faculty of Medicine (protocol #112-11-2011). All mice were in a C57Bl/6 background. Wild type mice have the murine Hp 1 allele which lacks the CNV and has the same intron/exon structure as the human Hp 1 allele. Generation of Hp 2 mice (mice containing the same intragenic duplication of exons 3 and 4 as found in man) has been previously described [29]. Briefly, a murine Hp 2 allele was genetically engineered by producing an in-frame duplication of murine exons 3 and 4 of the murine 1 allele. The murine Hp 2 allele was then used to replace the endogenous wild type murine Hp 1 allele by the process of targeted homologous recombination [29]. Hp 1-1 and Hp 2-2 mice were backcrossed into a C57Bl/6 ApoE−/− background to generate Hp 1-1 ApoE−/− or Hp 2-2 ApoE−/− C57Bl/6 mice. Previous characterization of these two strains has demonstrated that there is no difference in their survival nor in their serum lipoprotein profile [27]. Mice were fed normal rodent chow with free access to water.
The original objective of this study was to assess plaque volume in the same mice at 3 and 6 months with exclusion from the analysis of mice who were missing either of these time points. A total of 128 mice were originally scanned at 3 months of age and 19 of the 3 month scans failed for technical reasons. 40 mice died between 3–6 months of age. The percentage of mice dying did not differ significantly by treatment group or genetic background. 75 mice were scanned at 6 months of age. 54 mice had both a successful 3 month and 6 month scan.
Biochemical measurements from mouse serum
The lipid profile of the mice was determined on serum specimens using a Dimension RXL analyzer from Siemens. Serum vitamin E concentration was determined by HPLC (C18 reversed phase with methanol solvent). Elution was followed at 292 nm and calculations determined using authentic standards.
Animal experimental protocols
Diabetes was produced in these mice using a low dose streptozotocin protocol developed by the NIH consortium on animal models of diabetic complications (www.diacomp.org). This protocol involves injection of streptozotocin over 5 days and was initiated at 3 months of age. Blood glucose was assessed in mice to identify which mice developed DM. At 4 months of age mice were randomized to either placebo or vitamin E (Merck water miscible vitamin E catalog #5.00862.1000 at 40mg/kg/day provided in the drinking water). Mice were sacrificed at 6 months of age.
Serially monitoring brachiocephalic artery plaque growth and estimating plaque volume by ultrasound
The brachiocephalic plaque was monitored in mice at 3 months and 6 months of age using the Vevo2100 (Visualsonics, Toronto, Canada). Ultrasound allows one to repeatedly monitor plaque progression in the same plaque in the same mice thereby decreasing the number of mice needed for the study and increasing study power. As the purpose of this study was to study plaque growth in vivo results are reported only for those 54 mice in which ultrasound was performed and results obtained both at 3 and 6 months in the same mouse. For all measurements mice were anaesthetized with 1.5% isoflurane gas in an air-circulating system. Hair was removed from the neck to the abdomen. Body temperature was maintained via a heated platform as well as with an external heating lamp. Echo gel was generously applied to acquire optimal image quality. A MS550S (32–56 MHz) transducer was used for this protocol. Images were obtained on all mice under one specific file preset of image acquisition with 3 to 12 mm depth and one focal zone placed at 7mm. Data was obtained both in the short and long axis. Images were saved in a cine loop at a frame rate of 300 frames per second. For measurements of plaque volume scans were gated with the ECG and for respiration with a preset of 3mm with a step size (slice interval) of 0.076 mm. Plaque volume was reconstructed from a semi-automated compendium of 2D images in the x, y and z-planes of the aortic arch and its branch vessels by Visualsonics derived software (Figure 1A).
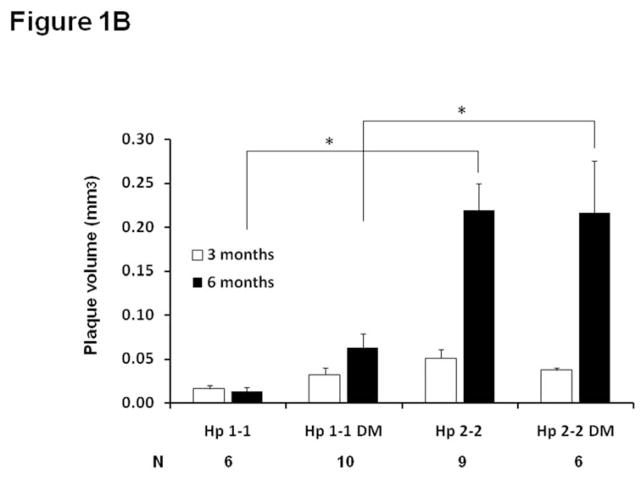
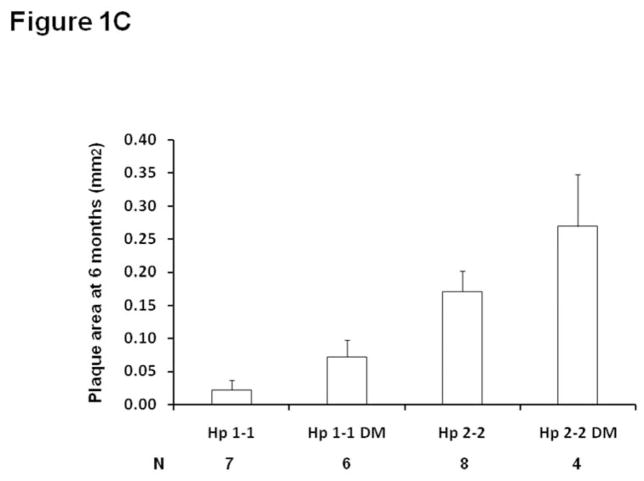
Figure 1. Plaque growth and size are significantly increased in Hp 2-2 mice as determined from in vivo ultrasound measurements and from morphometric measurements of formalin fixed tissue.
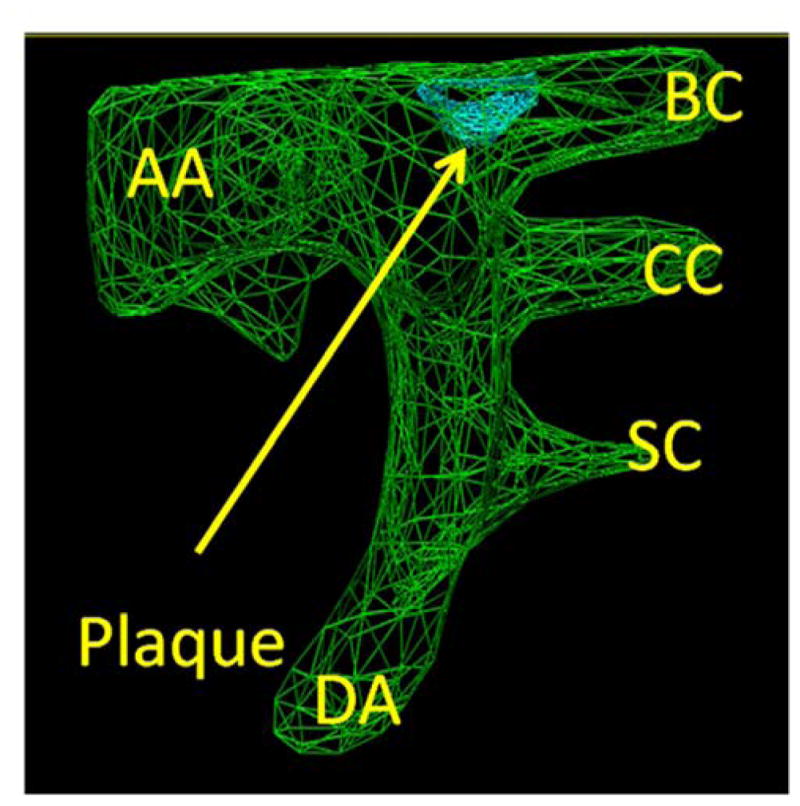
A. Measurement of plaque volume. In green is the three dimensional outline of the aortic arch (AA) with its arterial branches (BC-brachiocephalic, CC-common carotid, SC-subclavian). DA-descending aorta. Plaque (arrow) is visualized in blue at the aortic arch-brachiocephalic artery bifurcation.
B. Brachiocephalic plaque volume was assessed in vivo in the same mouse by ultrasound at both 3 and 6 months in Hp 1-1 ApoE−/− or Hp 2-2 ApoE−/− mice with or without DM induced at 3 months of age. Plaque volume measurements are shown only for mice in which ultrasound measurements were obtained from the same mouse at both 3 months and 6 months, with N indicating the number of mice in each of the four groups with measurements at both 3 and 6 months. The change in plaque volume was significantly different between the 4 groups (ANOVA p=0.009). Pairwise comparisons for the change in plaque volume demonstrated significant differences (*) in plaque growth between Hp 1-1 and Hp 2-2 mice and between Hp 1-1 DM and Hp 2-2 DM mice (p<0.005 for both comparisons).
C. Brachiocephalic plaque area is significantly increased in Hp 2-2 mice at 6 months of age in paraffin embedded formalin fixed sections. Plaque area was assessed on formalin fixed plaques at 6 months. Plaque area was significantly different between the four groups (p<0.009) (N, number of mice assessed in each group). Pairwise comparisons for the change in plaque volume demonstrated significant differences in plaque growth between Hp 1-1 and Hp 2-2 mice and between Hp 1-1 DM and Hp 2-2 DM mice (p<0.005 for both comparisons). Their was a borderline significant increase in plaque area at 6 months in Hp 2-2 DM compared to Hp 2-2 mice, p=0.075).
The operator of the ultrasound was blinded in all cases to the mouse genotype, diabetes status and treatment status of the mouse being scanned. Analysis of the ultrasound images, which was performed at the conclusion of the study, was performed by a single analyst blinded to mouse genotype, diabetes status, treatment status and the time point at which the ultrasound was performed.
Morphometric characterization of the brachiocephalic artery plaque
At 6 months of age mice were sacrificed and the aortic arch and brachiocephalic artery were placed in formalin. In each specimen the brachiocephalic artery was stained in situ with green dye (TMD Tissue Marking Dye # TMD-G, TBS inc.) in order to assist with orientation of the specimen in paraffin embedded sections. 0.5 μm coronal sections of the plaque were used to allow complete visualization of the brachiocephalic plaque along its entire length from its origin at the bifurcation with the aortic arch to well into the brachiocephalic artery. Digital images were taken using an Olympus BX43 photomicroscope (Olympus Optical Co Ltd, Japan) with a Qimaging digital camera. All morphometric measurements of areas and dimensions (including cap thickness) were calculated using Image Proplus 7 software (Media Cybernetics MA, USA) with the reader blinded to the Hp type and treatment status. Iron was identified with Perl’s stain and the intensity of staining and the percentage of the plaque staining was quantitatively assessed in all brachiocephalic plaques. Intraplaque hemorrhage was identified by the presence of red blood cells in the plaque. Plaque rupture was identified in serial histological sections demonstrating fibrous cap disruption and luminal thrombosis.
Statistical analysis
Continuous variables (area, volume, density and thickness) were compared among groups of mice with a one-way Analysis of Variance (ANOVA) followed by pair-wise comparison adjusted with the least significant differences test. Discrete outcomes (hemorrhage or rupture) were compared among groups with the Chi-square test. Associations between continuous variants were evaluated with the Pearson correlation coefficient. Changes in plaque volume between the vitamin E treated mice and placebo treated mice were compared among groups using a regression model with Hp type, diabetes status, treatment, serum cholesterol and their 2 way interactions as fixed effects. A p-value of 0.05 was considered statistically significant. SAS version 9.1.3 (SAS Institute Inc., Cary, NC) and SPSS Statistics version 20 (IBM Corp., Armonk, NY, USA) were used to perform the analyses.
Results
In vivo measurement of atherosclerotic plaque volume by high resolution ultrasound is highly correlated with atherosclerotic plaque area determined from formalin fixed tissue
Brachiocephalic artery plaque volume (Figure 1A) was determined in vivo using the Vevo2100 high resolution ultrasound and brachiocephalic plaque area was determined from morphometric analysis of formalin fixed tissue. Plaque volume as opposed to plaque area provides a more accurate measurement of plaque size as it is obtained from multiple planes and images of a region of interest. Comparing plaque volume in vivo at 6 months of age and plaque area taken in the same mice sacrificed at 6 months of age, there was a highly significant correlation (Pearson correlation coefficient of 0.476, p<0.001, n=57) between the two methods.
Atherosclerotic plaque progression is greater in Hp 2-2 mice
Brachiocephalic plaque volume was sequentially measured in vivo at 3 months and 6 months in Hp 1-1 and Hp 2-2 mice with and without DM using high resolution ultrasound (Figure 1B). The change in plaque volume between 3 and 6 months of age measured by ultrasound was significantly different between the 4 groups of mice (p=0.009) with a significant increase in plaque volume in Hp 2-2 as compared to Hp 1-1 both with and without DM (p<0.005) resulting in an approximately 5–6 fold greater plaque volume at 6 months in Hp 2-2 mice as compared to Hp 1-1 mice. Similar results were obtained in formalin fixed tissue sections from these same mice analyzed at 6 months with significantly larger plaque area seen in Hp 2-2 mice (Figure 1C). Body weight and serum lipoprotein concentrations were not significantly different between Hp 1-1 and Hp 2-2 mice with and without DM (supplementary appendix, Table 1).
Iron is increased in Hp 2-2 DM plaques
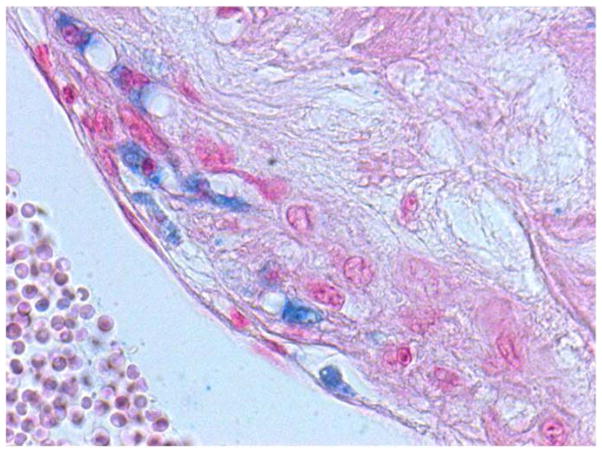
We have previously demonstrated Hp and DM dependent differences in plaque iron as assessed by Perl’s stain in human atherosclerotic plaques (30). We sought to determine if these findings could be recapitulated in Hp transgenic mice using Perl’s stain of 6 month old formalin fixed brachiocephalic artery plaque (Figure 2A). The area and intensity of iron staining was significantly different between the four groups (p=0.009) (supplementary appendix, Table 2) with pairwise comparisons showing that iron was significantly increased in Hp 2-2 mice as compared to Hp 1-1 mice only in the setting of DM (p=0.036 and 0.047 comparing area and iron intensity between Hp 1-1 DM and Hp 2-2 DM mice).
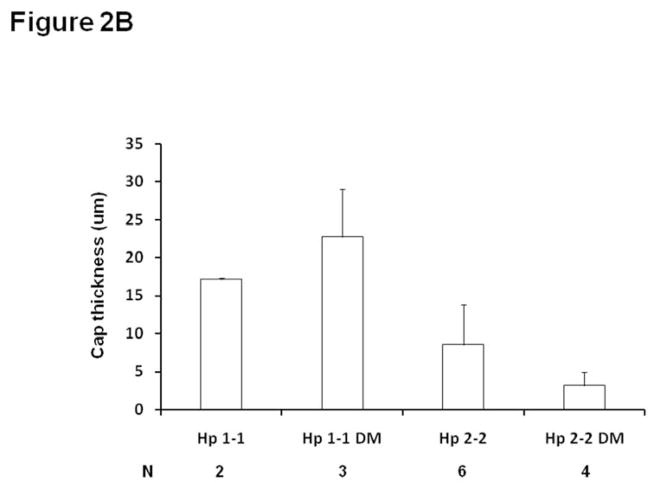
Figure 2. Hp 2-2 plaques have more iron and thinner fibrous caps.
A. Perl’s iron stain (staining blue) in Hp 2-2 brachiocephalic plaque. 40X magnification of the plaque. Quantitation of multiple plaques is provided in supplementary Table 2 demonstrating significantly increased staining (both intensity and area of the plaque stained) in Hp 2-2 plaques.
B. Minimum fibrous cap thickness (μm)±SE measured over the entire length of the brachiocephalic plaque. The minimum fibrous cap thickness of the brachiocephalic plaque in Hp 2-2 DM mice was significantly decreased as compared to Hp 1-1 DM mice p=0.028 with no significant difference between Hp 1-1 and Hp 2-2 mice in the absence of DM, p=0.323). N denotes the number of brachiocephalic plaques in which a clearly discernable cap could be measured for mice of a particular genotype. In Hp 1-1 mice without DM the vast majority of plaques examined for this parameter (12) did not have a fibrous cap.
Hp 2-2 DM plaques are more susceptible to rupture
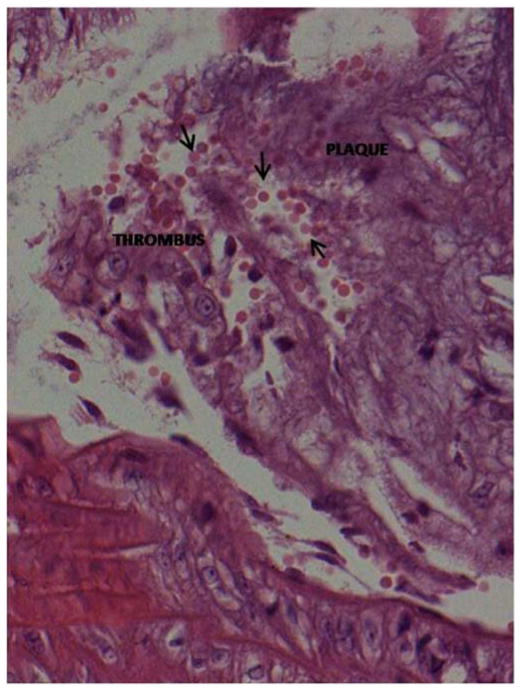
A thin fibrous cap and the presence of intraplaque hemorrhage have been demonstrated to be major determinants of whether a specific plaque is at high risk for rupture thereby inducing atherothrombosis (31–33). The minimum fibrous cap thickness of the brachiocephalic plaque in Hp 2-2 DM mice was decreased as compared to Hp 1-1 DM mice (Figure 2B) (p=0.028 comparing cap thickness Hp 2-2 DM vs. Hp 1-1 DM). Gross intraplaque hemorrhage, identified by the presence of red blood cells within the plaque (Figure 3), was significantly increased in Hp 2-2 brachiocephalic plaques (0/11 for Hp 1-1 vs. 8/10 for Hp 2-2, p<0.001). Finally, we observed at 6 months of age brachiocephalic plaque rupture (as determined from analysis of histological sections) in 50% of Hp 2-2 plaques while failing to see rupture in any Hp 1-1 plaques (0/11 vs. 5/10, p=0.01). An unusual capture by ultrasound of a ruptured brachiocephalic plaque is shown as a series of still frames demonstrating a plaque flap (Figure 4) (full video clip of this rupture provided as on-line supplemental video).
Figure 3. Intraplaque hemorrhage.
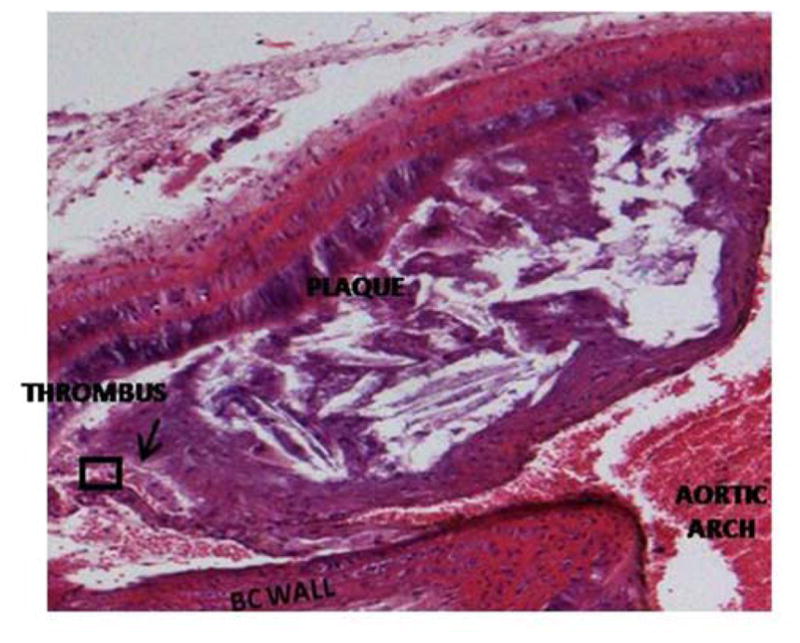
Hematoxylin and eosin stained Hp 2-2 DM plaque showing intraplaque hemorrhage at the site of brachiocephalic artery bifurcation with the aortic arch. The prevalence of intraplaque hemorrhage was increased in Hp 2-2 brachiocephalic plaques (8/10 Hp 2-2 plaques vs. 0/11 Hp 1-1 plaques, p<0.001).
A. 10X magnification. Intraplaque clot is indicated by arrow.
B. 40X magnification of boxed inset region from (A) demonstrating numerous red blood cells (arrows) derived from an intraplaque hemorrhage within the plaque.
Figure 4. Still frames of ultrasound video recording demonstrating plaque rupture in Hp 2-2 DM plaque.
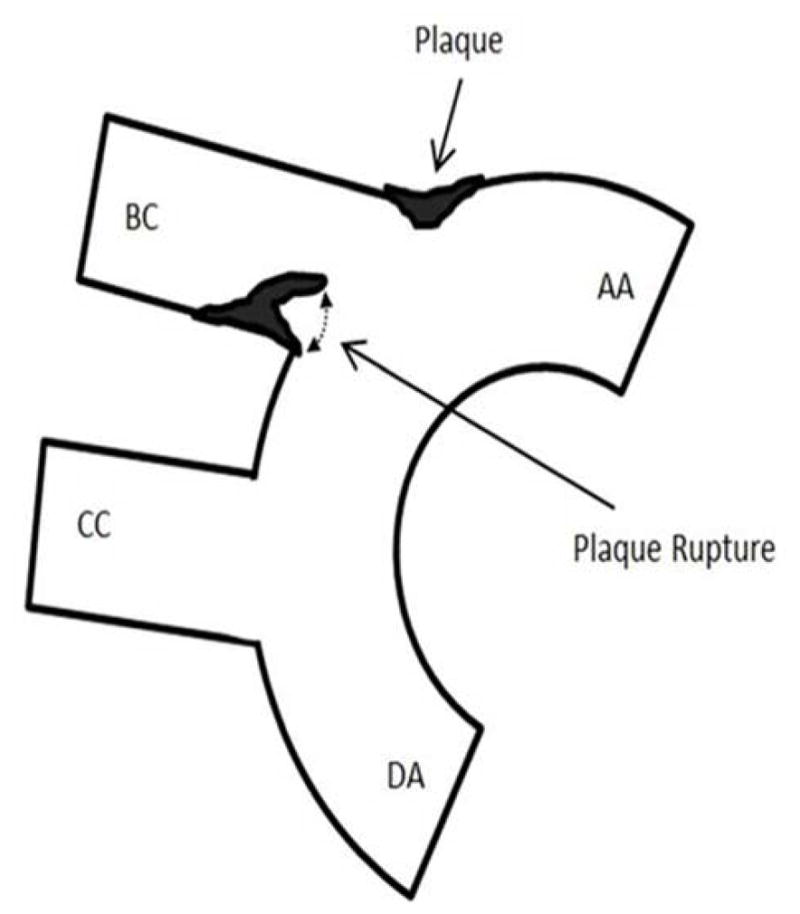

A. Schematic providing orientation of ultrasound snapshot still frames to assist for examining still frames in (B). Components of the aortic arch: AA-ascending aorta, DA-descending aorta, BC-brachiocephalic artery. CC-common carotid artery. Plaque indicated by arrow forms at the bifurcation of the BC and AA. A ruptured plaque is seen flapping in the BC lumen as indicated by dashed line on the inferior wall of the BC.
B. Still frame snapshots of a cine loop of ultrasound images. Cine loop was 300 images per second with chosen still frames at 2.967 sec/3.174 sec/4.278 sec taken from a 20 second cine loop provided as an on-line video supplement. Components of the aortic arch: AA-ascending aorta, DA-descending aorta, BC-brachiocephalic artery. CC-common carotid artery. Yellow arrow points to plaque formation on superior wall of BC at the bifurcation of the BC with the AA. Red arrow highlights cap flap moving in the plaque lumen during the cardiac cycle with the three chosen still frames showing from left to right a flap which is not obstructing the lumen/half obstructing the lumen/occluding the BC lumen.
Serum vitamin E is decreased in Hp 2-2 ApoE−/− mice
Serum vitamin E concentration was measured in Hp 1-1 ApoE−/− and Hp 2-2 Apo E−/− mice on a normal chow diet at 6 months of age. Serum vitamin E concentration was significantly lower in Hp 2-2 Apo E−/− mice as compared to Hp 1-1 ApoE−/− mice (37.71±4.95 umole/l vs. 22.66±1.14 umole/l, n=5 in each group, p=0.018).
Interaction between the Hp genotype and vitamin E on plaque growth and stability
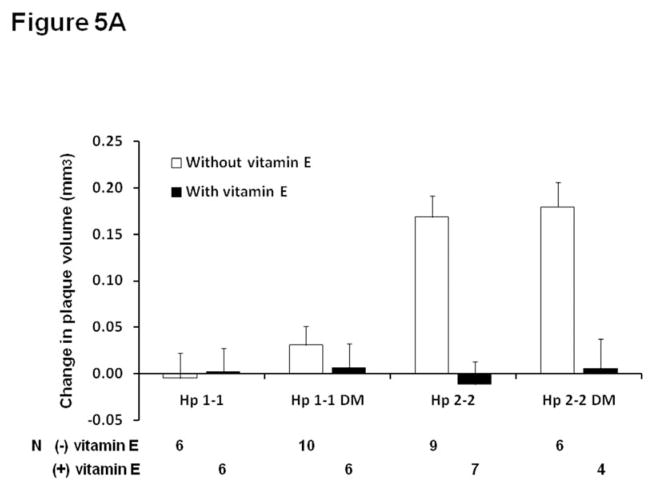
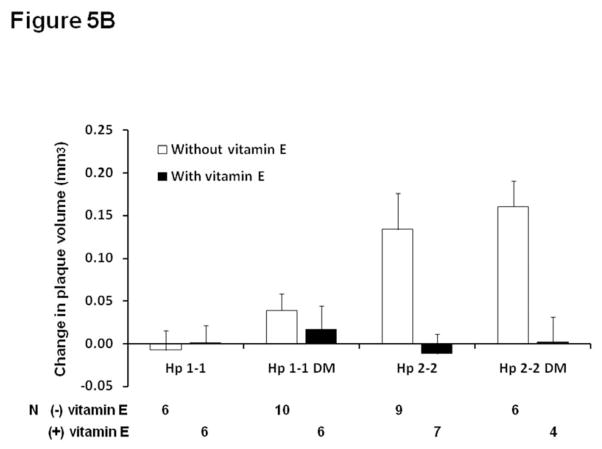
Vitamin E or placebo was administered to Hp 1-1 or Hp 2-2 mice between 4 and 6 months of age as described in methods. In Hp 2-2 mice only, vitamin E significantly inhibited plaque volume growth assessed by ultrasound (Figure 5A). There was a statistically significant interaction between vitamin E and the Hp genotype on atherosclerotic plaque growth (p<0.0001). At six months of age, in the plaque of Hp 2-2 mice which received vitamin E there was no iron detected by Perl’s stain, no intraplaque hemorrhage and no plaque rupture. As demonstrated in supplementary Table 1, while there were no significant differences in the lipid profile between Hp 1-1 and Hp 2-2 DM without vitamin E supplementation, in mice which received vitamin E there was a Hp genotype dependent response with Hp 1-1 DM mice demonstrating a significant increase in total cholesterol with vitamin E (supplementary appendix, Table 3). However, adjustment for total cholesterol levels did not significantly change the relationship between Hp genotype and vitamin E on plaque growth (after adjustment for cholesterol p for interaction=0.0006) (Figure 5B).
Figure 5. Vitamin E arrests plaque volume growth in Hp 2-2 mice.
A. Change in plaque volume between 3 and 6 months of age in Hp 1-1 and Hp 2-2 mice with and without DM and with and without vitamin E supplementation initiated at 4 months of age. Vitamin E significantly reduced plaque volume growth in Hp 2-2 mice only (p<0.001 comparing Hp 2-2 mice with and without vitamin E and p<0.001 comparing Hp 2-2 DM mice with and without vitamin E). There was no significant effect of vitamin E on plaque volume growth in Hp 1-1 mice (p=0.932 in Hp 1-1 and p=0.576 in Hp 1-1 DM mice). There was a statistically significant interaction between the Hp genotype and vitamin E on plaque volume growth (p<0.0001). N, number of mice for which plaque volume could be assessed at both 3 and 6 months for mice of a particular genotype, DM status and treatment group.
B. Change in plaque volume as described in (A) after adjustment for cholesterol. Vitamin E significantly reduced plaque volume growth in Hp 2-2 mice only (p<0.001 comparing Hp 2-2 and Hp 2-2 DM mice with and without vitamin E). There was no significant effect of vitamin E on plaque volume growth in Hp 1-1 mice (p=0.807 in Hp 1-1 and p=0.452 in Hp 1-1 DM mice). There was a statistically significant interaction between the Hp genotype and vitamin E on plaque volume growth (p=0.0006).
Discussion
This study has demonstrated in vivo using repeated measurements of the brachiocephalic plaque that plaques in Hp 2-2 ApoE−/− mice grow more rapidly and exhibit more unstable characteristics and rupture as compared to plaques from Hp 1-1 ApoE −/− mice. Vitamin E was shown to arrest plaque progression and increase plaque stability in Hp 2-2 mice while providing no benefit on these parameters in Hp 1-1 mice. These data may provide an explanation for why human studies have shown that vitamin E is protective against coronary heart disease and atherothrombosis only in Hp 2-2 individuals [6].
The association of the Hp genotype with plaque progression and stability in man appears to be directly due to Hp genotype dependent differences in the trafficking of extracorpuscular Hb [28]. Every day over 6 g of Hb are released into the plasma as a result of the normal turnover of red blood cells and this may be increased in DM [9]. In the atherosclerotic plaque, nascent vessels are more susceptible to micro hemorrhages, particularly in the setting of DM, resulting in the appearance of free Hb in the plaque [34,35]. There exist major differences in the ability of the Hp 1 and Hp 2 proteins to block oxidation mediated by free Hb. The Hp 2-2 protein is inferior to the Hp 1-1 protein in blocking Hb induced oxidation of a variety of lipid and protein moieties [10,11] in vitro, particularly in those oxidation targets with which the Hp-Hb complex may directly bind [28]. For example, the Hp 2-2 protein can bind directly to helix 6 of apoA1 on HDL and thereby tether Hb to HDL resulting in the oxidation of HDL [28]. In vivo, both in Hp transgenic mice and in man, the Hp 2-2 genotype has been associated with increased oxidation of HDL and depressed HDL function [28,36,37]. In addition the Hp 1-1-Hb and Hp 2-2-Hb complexes are recognized and processed differently by macrophages, resulting in increased redox active iron load (both in the plaque and tethered to HDL) in Hp 2-2 [22,23,29]. The Hp-Hb complex binds with high affinity to the monocyte/macrophage CD163 receptor allowing clearance of Hb from the plasma or the vessel wall. Clearance of the Hp 2-2-Hb complex by CD163 [38] mediated receptor mediated endocytosis [22,28] and processing of the Hp 2-2-Hb complex within the lysosome is impaired leading to accumulation of iron in the lysosome and lysosomal injury [39]. Furthermore, the binding of Hp 1-1-Hb to CD163 results in the release of anti-inflammatory cytokines (i.e. Il-10) from the macrophage while this response is markedly blunted when Hp 2-2-Hb binds to CD163 [25].
Why does their exist an interaction between Hp genotype and vitamin E on plaque growth? Three complementary lines of evidence suggest that this may be related to a deficiency in vitamin E in Hp 2-2 [40]. First, there appears to be decreased levels of vitamin E present in Apo E−/− Hp 2-2 mice as compared to Apo E−/− Hp 1-1 mice. A similar relationship between serum vitamin E and Hp genotype has been recently described in humans with DM. In the HAPE study serum vitamin E was significantly decreased in Hp 2-2 type I DM individuals as compared to Hp 1-1 type I DM individuals with an intermediate serum concentration found in Hp 2-1 type I DM individuals (p<0.02 for trend) [37]. In a Mediterranean cohort of individuals with type II DM and elevated HbA1c (>8.0) Hp 2-2 DM individuals were found to have decreased serum vitamin E as compared to Hp 1-1 DM individuals (p<0.01, unpublished data). Second, we have demonstrated a pharmacogenomic interaction between the Hp genotype and vitamin E on HDL function in man (and in mice). In three independent studies in man vitamin E has been shown to prevent HDL oxidation and thereby improve HDL function in Hp 2-2 DM but not in non Hp 2-2 DM [28,36,37]. The ability of vitamin E to prevent HDL oxidation and improve HDL function in Hp 2-2 DM may be related to a relative vitamin E deficiency in Hp 2-2 HDL. Preliminary studies have shown that vitamin E in Hp 2-2 HDL is decreased over 50% compared to Hp 1-1 HDL (both in murine and human HDL, unpublished data). This vitamin E deficiency in Hp 2-2 HDL may be due either to an increased consumption of the vitamin E in Hp 2-2 HDL due to Hb being tethered to the HDL or due to Hp genotype differences in HDL phospholipid transfer protein (PLTP) [41]. Finally, vitamin E supplementation has been shown to down-regulate the production of several endogenous anti oxidant proteins (i.e., paraoxonase) [42–43]. Redox status is finely tuned and supplementation with high dose antioxidants in non-Hp 2-2 individuals with lower degrees of oxidative stress may produce an overshoot of antioxidant status resulting in the down regulation of endogenous antioxidant proteins (and iron regulatory proteins) rendering the patient more susceptible to acute oxidative injury from Hb after an intraplaque hemorrhage. Indeed we have recently demonstrated that HDL paraoxonase was significantly reduced by vitamin E in non Hp 2-2 individuals but not in Hp 2-2 individuals (unpublished data).
In conclusion substantial preclinical evidence exists demonstrating Hp and DM dependent differences in protecting against Hb induced oxidative injury. The present study provides translation of these studies to the in vivo setting and relates them to plaque growth and stability. Moreover, the demonstration of a pharmacogenomic interaction between the Hp genotype and vitamin E on plaque growth and stability in mice provides solid support for the finding that vitamin E provides CVD benefit in Hp 2-2 DM but not in non Hp 2-2 DM individuals. We hope that these studies will help to encourage a pharmacogenomic study in man that will allow for implementation of an algorithm whereby all DM individuals will be typed for Hp followed by recommendation of vitamin E therapy for those carrying the Hp 2-2 genotype.
Supplementary Material
Table 1. Characteristics of Hp 1-1 and Hp 2-2 mice with and without DM on placebo (mean ± SE). Comparison of these 4 groups by ANOVA for the lipid profile demonstrated significant differences in total cholesterol (p=0.019) and in HDL (p=0.009). Pairwise comparisons demonstrated that DM resulted in a significant increase in cholesterol and HDL both in Hp 1-1 and Hp 2-2 mice (p=0.024 and p=0.005 for cholesterol comparing Hp 1-1±DM and Hp 2-2 ±DM respectively and p=0.015 and p=0.005 for HDL comparing Hp 1-1±DM and Hp 2-2 ±DM respectively).
Table 2. Iron is increased in Hp 2-2 plaques. The area of the brachiocephalic plaque staining for iron as assessed using Perl’s stain was increased over 200 fold in Hp 2-2 mice as compared to Hp 1-1 mice (ANOVA p=0.009; pairwise comparison Hp 1-1 DM vs. Hp 2-2 DM p=0.036). Intensity of Perl’s iron stain (arbitrary intensity units) was significantly increased in Hp 2-2 mice as compared to Hp 1-1 mice (ANOVA p=0.009; pairwise comparisons Hp 1-1 DM vs. Hp 2-2 DM p=0.047). N indicates number of mice in which plaque was stained for Perl’s and in which iron was assessed.
Table 3. Characteristics of Hp 1-1 and Hp 2-2 mice with and without DM on vitamin E (mean ± SE) Comparison of these 4 groups by ANOVA for the lipid profile demonstrated significant differences in total cholesterol (p<0.001) and in HDL (p<0.001). Pairwise comparisons demonstrated that DM resulted in a significant increase in cholesterol and HDL both in Hp 1-1 and Hp 2-2 mice (p<0.024 and p=0.005 for cholesterol comparing Hp 1-1±DM and Hp 2-2 ±DM respectively and p<0.015 and p=0.005 for HDL comparing Hp 1-1±DM and Hp 2-2 ±DM respectively).
Assessment of the effect of vitamin E on the lipid profile of Hp 1-1 or Hp 2-2 mice with or without DM (i.e. comparing mice with the same genotype and DM status in tables 1 and 3) demonstrated that total cholesterol and HDL were significantly increased in Hp 1-1 DM mice with vitamin E (p=0.001 and p=0.005, respectively for cholesterol and HDL). All other comparisons between parallel groups of mice with and without vitamin E were not significant.
Highlights.
Plaque volume can be assessed serially in the same mouse over time by high resolution ultrasound.
Hp genotype is a determinant of atherosclerotic plaque volume growth development
Hp 2-2 plaques have more unstable features including more iron, thinner caps and more hemorrhage.
Vitamin E is decreased in Hp 2-2 plasma.
Vitamin E can prevent plaque volume growth in Hp 2-2 mice.
Acknowledgments
Sources of funding: This work was supported by grants from NIH RO1DK085226, Israel Science Foundation and the Rappaport Family Medical Research Institute to APL. APL is recipient of the Frances Brody Chair in Life Sciences at the Technion. TB was the recipient of a research internship between U Toronto and Technion.
Footnotes
Author Contribution: HLV, RG, MV, GD, RML, YZ, ES, RA, NSL, LJG, TAB, TH, HS, EST, AK, MK, RT, AZ, APL researched the data and performed the analysis and reviewed the manuscript; APL wrote the manuscript and takes responsibility for the contents of this article.
Disclosures: The institution of APL is the owner of a patent which claims that vitamin E can reduce diabetic vascular complications
Publisher's Disclaimer: This is a PDF file of an unedited manuscript that has been accepted for publication. As a service to our customers we are providing this early version of the manuscript. The manuscript will undergo copyediting, typesetting, and review of the resulting proof before it is published in its final citable form. Please note that during the production process errors may be discovered which could affect the content, and all legal disclaimers that apply to the journal pertain.
References
- 1.Steinberg D, Parthasarathy S, Carew TW, Khoo JC, Witztum JL. Beyond cholesterol: modification of low density lipoprotein that increases its atherogenicity. N Engl J Med. 1989;320:915–924. doi: 10.1056/NEJM198904063201407. [DOI] [PubMed] [Google Scholar]
- 2.Lonn ME, Dennis JM, Stocker R. Actions of “antioxidants” in the protection against atherosclerosis. Free Rad Biol Med. 2012;53:863–884. doi: 10.1016/j.freeradbiomed.2012.05.027. [DOI] [PubMed] [Google Scholar]
- 3.Heart Outcomes Prevention Evaluation (HOPE) Study Investigators. Vitamin E supplementation and cardiovascular events in high risk patients. N Engl J Med. 2000;342:154–160. doi: 10.1056/NEJM200001203420302. [DOI] [PubMed] [Google Scholar]
- 4.Lee IM, Cook NR, Gaziano JM, Gordon D, Ridker PM, Manson JE, Hennekens CH, Buring JH. Vitamin E in the primary prevention of cardiovascular disease and cancer. The Women’s Health Study: a randomized controlled clinical trial. JAMA. 2005;294:56–65. doi: 10.1001/jama.294.1.56. [DOI] [PubMed] [Google Scholar]
- 5.Miller ER, Barriuso RP, Dalal D, Riemersma RA, Appel LJ, Guallar E. Meta-analysis: high dosage vitamin E supplementation may increase all cause mortality. Ann Int Med. 2005;142:37–46. doi: 10.7326/0003-4819-142-1-200501040-00110. [DOI] [PubMed] [Google Scholar]
- 6.Vardi M, Levy NS, Levy AP. Vitamin E in the prevention of cardiovascular disease-the importance of proper patient selection. J Lipid Research. 2013;54:2307–2314. doi: 10.1194/jlr.R026641. [DOI] [PMC free article] [PubMed] [Google Scholar]
- 7.Rother RP, Bell L, Hillmen P, Gladwin MT. The clinical sequalae of intravascular hemolysis and extracellular plasma hemoglobin: a novel mechanism of human disease. JAMA. 2005;293:1653–1662. doi: 10.1001/jama.293.13.1653. [DOI] [PubMed] [Google Scholar]
- 8.Bowman BH, Kurosky A. Haptoglobin: the evolutionary product of duplication, unequal crossing over and point mutation. Adv Human Genet. 1982;12:189–261. doi: 10.1007/978-1-4615-8315-8_3. [DOI] [PubMed] [Google Scholar]
- 9.Levy AP, Asleh R, Blum S, Levy NS, Miller-Lotan R, Kalet-Litman S, et al. Haptoglobin: basic and clinical aspects. Antioxidant redox signaling. 2010;12:293–304. doi: 10.1089/ars.2009.2793. [DOI] [PubMed] [Google Scholar]
- 10.Frank M, Lache O, Enav B, Szafranek T, Levy NS, Ricklis RM, Levy AP. Structure/function analysis of the anti-oxidant properties of haptoglobin. Blood. 2001;98:3693–3698. doi: 10.1182/blood.v98.13.3693. [DOI] [PubMed] [Google Scholar]
- 11.Bamm VV, Tsemakhovich VA, Shaklai M, Shaklai N. Haptoglobin phenotypes differ in their ability to inhibit heme transfer from hemoglobin to LDL. Biochemistry. 2004;43:3899–3906. doi: 10.1021/bi0362626. [DOI] [PubMed] [Google Scholar]
- 12.Levy AP, Hochberg I, Jablonski K, Resnick H, Best L, Lee ET, Howard BV. Haptoglobin phenotype and the risk of cardiovascular disease in individuals with diabetes: The Strong Heart Study. J Am Coll Card. 2002;40:1984–1990. doi: 10.1016/s0735-1097(02)02534-2. [DOI] [PubMed] [Google Scholar]
- 13.Roguin A, Koch W, Kastrati A, Aronson D, Schomig A, Levy AP. Haptoglobin genotype is predictive of major adverse cardiac events in the one year period after PTCA in individuals with diabetes. Diab Care. 2003;26:2628–2631. doi: 10.2337/diacare.26.9.2628. [DOI] [PubMed] [Google Scholar]
- 14.Suleiman M, Aronson D, Asleh R, Kapelovich MR, Roguin A, Meisel SR, et al. Haptoglobin polymorphism predicts 30-day mortality and heart failure in patients with diabetes and acute myocardial infarction. Diabetes. 2005;54:2802–2806. doi: 10.2337/diabetes.54.9.2802. [DOI] [PubMed] [Google Scholar]
- 15.Milman U, Blum S, Shapira C, Aronson D, Miller-Lotan R, Anbinder Y, et al. Vitamin E supplementation reduces cardiovascular events in a subgroup of middle-aged individuals with both Type 2 Diabetes Mellitus and the Haptoglobin 2–2 genotype: a prospective, double-blinded clinical trial. Art Thromb Vasc Biol. 2008;28:341–347. doi: 10.1161/ATVBAHA.107.153965. [DOI] [PubMed] [Google Scholar]
- 16.Cahill LE, Levy AP, Chiuve SE, Jensen MK, Wang H, Shara NW, et al. Haptoglobin genotype is a consistent marker of coronary heart disease risk among individuals with elevated hemoglobin A1c. J Am Coll Card. 2012;61:728–737. doi: 10.1016/j.jacc.2012.09.063. [DOI] [PMC free article] [PubMed] [Google Scholar]
- 17.Simpson M, Snell-Bergeon JK, Kinney GL, Lache O, Miller-Lotan R, Anbinder Y, et al. Haptoglobin genotype predicts development of coronary artery calcification in a prospective cohort of patients with Type I Diabetes Mellitus. Card Diab. 2012;10:99. doi: 10.1186/1475-2840-10-99. [DOI] [PMC free article] [PubMed] [Google Scholar]
- 18.Blum S, Vardi M, Brown JB, Russell A, Milman U, Shapira C, et al. Vitamin E reduces cardiovascular disease in individuals with Diabetes Mellitus and the Haptoglobin 2–2 genotype. Pharmacogenomics. 2010;11:675–684. doi: 10.2217/pgs.10.17. [DOI] [PMC free article] [PubMed] [Google Scholar]
- 19.Blum S, Vardi M, Levy NS, Miller-Lotan R, Levy AP. The effect of vitamin E supplementation on cardiovascular risk in diabetic individuals with different haptoglobin phenotypes. Atherosclerosis. 2010;211:25–27. doi: 10.1016/j.atherosclerosis.2010.02.018. [DOI] [PMC free article] [PubMed] [Google Scholar]
- 20.Costacou T, Ferrell RE, Orchard TJ. Haptoglobin genotype: a determinant of cardiovascular complication risk in type I diabetes. Diabetes. 2008;57:1702–1706. doi: 10.2337/db08-0095. [DOI] [PubMed] [Google Scholar]
- 21.Adams JN, Cox AJ, Freedman BI, Langefeld CD, Carr J, Bowden DW. Genetic analysis of Haptoglobin polymorphisms with cardiovascular disease and type 2 diabetes in the diabetes heart study. Card Diab. 2013;12:31. doi: 10.1186/1475-2840-12-31. [DOI] [PMC free article] [PubMed] [Google Scholar]
- 22.Asleh R, Marsh S, Shiltruck M, Binah O, Guetta J, Lejbkowicz F, et al. Genetically determined heterogeneity in hemoglobin scavenging and susceptibility to diabetic cardiovascular disease. Circ Res. 2003;92:1193–1200. doi: 10.1161/01.RES.0000076889.23082.F1. [DOI] [PubMed] [Google Scholar]
- 23.Asleh R, Guetta J, Kalet-Litman S, Miller-Lotan R, Levy AP. Haptoglobin genotype and diabetes dependent differences in iron mediated oxidative stress in vitro and in vivo. Circ Res. 2005;96:435–441. doi: 10.1161/01.RES.0000156653.05853.b9. [DOI] [PubMed] [Google Scholar]
- 24.Levy AP, Moreno PR. Intraplaque hemorrhage. Curr Mol Med. 2006;6:479–488. doi: 10.2174/156652406778018626. [DOI] [PubMed] [Google Scholar]
- 25.Guetta J, Strauss M, Levy NS, Fahoum L, Levy AP. Haptoglobin genotype modulates the balance of Th1/Th2 cytokines produced by macrophages exposed to free hemoglobin. Atherosclerosis. 2007;91:48–53. doi: 10.1016/j.atherosclerosis.2006.04.032. [DOI] [PubMed] [Google Scholar]
- 26.Levy AP, Purosothaman KR, Levy NS, Purosothaman M, Strauss M, Asleh R, et al. Downregulation of the hemoglobin scavenger receptor in individuals with diabetes and the Hp 2–2 genotype: implications for the response to intraplaque hemorrhage and plaque vulnerability. Circ Res. 2007;101:106–110. doi: 10.1161/CIRCRESAHA.107.149435. [DOI] [PubMed] [Google Scholar]
- 27.Asleh R, Miller-Lotan R, Aviram M, Hayek T, Yulish M, Levy JE, et al. Haptoglobin Genotype is a Regulator of Reverse Cholesterol Transport in Diabetes In Vitro and In Vivo. Circ Res. 2006;99:1419–1425. doi: 10.1161/01.RES.0000251741.65179.56. [DOI] [PubMed] [Google Scholar]
- 28.Asleh R, Blum S, Kalet-Litman S, Alsheik J, Miller-Lotan R, Asaf R, et al. Correction of HDL dysfunction in individuals with Diabetes and the Haptoglobin 2–2 genotype. Diabetes. 2008;57:2794–2800. doi: 10.2337/db08-0450. [DOI] [PMC free article] [PubMed] [Google Scholar]
- 29.Levy AP, Levy JE, Kalet-Litman S, Miller-Lotan R, Levy NS, Asaf R, et al. Haptoglobin genotype is a determinant of iron, lipid peroxidation and macrophage accumulation in the atherosclerotic plaque. Arteriosclerosis Thromb Vasc Biol. 2007;27:134–140. doi: 10.1161/01.ATV.0000251020.24399.a2. [DOI] [PubMed] [Google Scholar]
- 30.Moreno PR, Purushothaman KR, Purushothaman M, Muntner P, Levy NS, Fuster V, et al. Haptoglobin genotype is a major determinant of the amount of iron in the human atherosclerotic plaque. J Am Coll Card. 2008;52:1049–1051. doi: 10.1016/j.jacc.2008.06.029. [DOI] [PubMed] [Google Scholar]
- 31.Kolodgie FD, Gold HK, Burke AP, Fowler DR, Kruth HS, Weber DK, et al. Intraplaque hemorrhage and progression of coronary atheroma. N Engl J Med. 2003;349:2316–2325. doi: 10.1056/NEJMoa035655. [DOI] [PubMed] [Google Scholar]
- 32.Shah PK. Mechanisms of plaque vulnerability and rupture. J Am Coll Card. 2003;41:15S–22S. doi: 10.1016/s0735-1097(02)02834-6. [DOI] [PubMed] [Google Scholar]
- 33.Michel JB, Delbosc S, Ho-Tin-Noe B, Leseche G, Nicoletti A, Meilhac O, Martin-Ventura JL. From intraplaque hemorrhages to plaque vulnerability: biological consequences of intraplaque hemorrhages. J Cardiovasc Med. 2012;13:628–634. doi: 10.2459/JCM.0b013e328357face. [DOI] [PubMed] [Google Scholar]
- 34.Virmani R, Kolodgie FD, Burke AP, Finn AV, Gold HK, Tulenko TN, et al. Atherosclerotic plaque progression and vulnerability to rupture: angiogenesis as a source of intraplaque hemorrhage. Ath Thromb Vasc Biol. 2005;25:2054–2061. doi: 10.1161/01.ATV.0000178991.71605.18. [DOI] [PubMed] [Google Scholar]
- 35.Nagy E, Eaton JW, Jeney V, Soares MP, Varga Z, Galajda Z, et al. Red cells, hemoglobin, heme, iron and atherogenesis. Ath Thromb Vasc Biol. 2010;30:1347–1353. doi: 10.1161/ATVBAHA.110.206433. [DOI] [PMC free article] [PubMed] [Google Scholar]
- 36.Farbstein D, Blum S, Pollak M, Asaf R, Viener HL, Lache O, et al. Vitamin E therapy results in a reduction in HDL function in individuals with Diabetes and the Haptoglobin 2-1 genotype. Atherosclerosis. 2011;219:240–244. doi: 10.1016/j.atherosclerosis.2011.06.005. [DOI] [PMC free article] [PubMed] [Google Scholar]
- 37.Costacou T, Levy AP, Asleh R, Farbstein D, Miller R, Fickley CE, et al. Vitamin E improves HDL function in type I diabetes with the Hp 2–2 genotype. Diabetes. 2013;62:1416. abstract. [Google Scholar]
- 38.Kristiansen M, Graverson JH, Jacobsen C, Sonne O, Hoffman HJ, Law SK, Moestrup SK. Identification of the hemoglobin scavenger receptor. Nature. 2001;409:198–201. doi: 10.1038/35051594. [DOI] [PubMed] [Google Scholar]
- 39.Asleh R, Ward J, Levy NS, Safuri S, Aronson D, Levy AP. Haptoglobin genotype dependent differences in macrophage lysosomal oxidative injury. J Biol Chem. 2014;289:16313–16325. doi: 10.1074/jbc.M114.554212. [DOI] [PMC free article] [PubMed] [Google Scholar]
- 40.Suarna C, Wu BJ, Choy K, Mori T, Croft K, Cynshi O, Stocker R. Protective effects of vitamin E supplements on experimental atherosclerosis is modest and depends on preexisting vitamin E deficiency. Free Rad Bio Med. 2006;41:722–30. doi: 10.1016/j.freeradbiomed.2006.05.013. [DOI] [PubMed] [Google Scholar]
- 41.Henderson RJ, Wasan KM, Leon CG. Haptoglobin inhibits phospholipid transfer protein activity in hyperlipidemic human plasma. Lipids Health Dis. 2009;8:27. doi: 10.1186/1476-511X-8-27. [DOI] [PMC free article] [PubMed] [Google Scholar]
- 42.Ristow M, Zarse K, Oberbach A, Kloting N, Birringer N, Kiehntopf M, et al. Antioxidants prevent health promoting effects of physical exercise in humans. Proc Natl Acad Sci. 2009;106:8665–8670. doi: 10.1073/pnas.0903485106. [DOI] [PMC free article] [PubMed] [Google Scholar]
- 43.Rainwater DL, Mahaney MC, VandeBerg JL, Wang XL. Vitamin E dietary supplementation significantly affects multiple risk factors for cardiovascular disease in baboons. Am J Clin Nutr. 2007;86:597–603. doi: 10.1093/ajcn/86.3.597. [DOI] [PubMed] [Google Scholar]
Associated Data
This section collects any data citations, data availability statements, or supplementary materials included in this article.
Supplementary Materials
Table 1. Characteristics of Hp 1-1 and Hp 2-2 mice with and without DM on placebo (mean ± SE). Comparison of these 4 groups by ANOVA for the lipid profile demonstrated significant differences in total cholesterol (p=0.019) and in HDL (p=0.009). Pairwise comparisons demonstrated that DM resulted in a significant increase in cholesterol and HDL both in Hp 1-1 and Hp 2-2 mice (p=0.024 and p=0.005 for cholesterol comparing Hp 1-1±DM and Hp 2-2 ±DM respectively and p=0.015 and p=0.005 for HDL comparing Hp 1-1±DM and Hp 2-2 ±DM respectively).
Table 2. Iron is increased in Hp 2-2 plaques. The area of the brachiocephalic plaque staining for iron as assessed using Perl’s stain was increased over 200 fold in Hp 2-2 mice as compared to Hp 1-1 mice (ANOVA p=0.009; pairwise comparison Hp 1-1 DM vs. Hp 2-2 DM p=0.036). Intensity of Perl’s iron stain (arbitrary intensity units) was significantly increased in Hp 2-2 mice as compared to Hp 1-1 mice (ANOVA p=0.009; pairwise comparisons Hp 1-1 DM vs. Hp 2-2 DM p=0.047). N indicates number of mice in which plaque was stained for Perl’s and in which iron was assessed.
Table 3. Characteristics of Hp 1-1 and Hp 2-2 mice with and without DM on vitamin E (mean ± SE) Comparison of these 4 groups by ANOVA for the lipid profile demonstrated significant differences in total cholesterol (p<0.001) and in HDL (p<0.001). Pairwise comparisons demonstrated that DM resulted in a significant increase in cholesterol and HDL both in Hp 1-1 and Hp 2-2 mice (p<0.024 and p=0.005 for cholesterol comparing Hp 1-1±DM and Hp 2-2 ±DM respectively and p<0.015 and p=0.005 for HDL comparing Hp 1-1±DM and Hp 2-2 ±DM respectively).
Assessment of the effect of vitamin E on the lipid profile of Hp 1-1 or Hp 2-2 mice with or without DM (i.e. comparing mice with the same genotype and DM status in tables 1 and 3) demonstrated that total cholesterol and HDL were significantly increased in Hp 1-1 DM mice with vitamin E (p=0.001 and p=0.005, respectively for cholesterol and HDL). All other comparisons between parallel groups of mice with and without vitamin E were not significant.


