

Abstract
Exposure to intense, nanosecond-duration electric pulses (nsEP) opens small but long-lived pores in the plasma membrane. We quantified the cell uptake of two membrane integrity marker dyes, YO-PRO-1 (YP) and propidium (Pr), in order to test whether the pore size is affected by the number of nsEP. The fluorescence of the dyes was calibrated against their concentrations by confocal imaging of stained homogenates of the cells. The calibrations revealed a two-phase dependence of Pr emission on the concentration (with a slower rise at < 4 µM), and a linear dependence for YP. CHO cells were exposed to nsEP trains (1 to 100 pulses, 60 ns, 13.2 kV/cm, 10 Hz) with Pr and YP in the medium, and the uptake of the dyes was monitored by time-lapse imaging for 3 min. Even a single nsEP triggered a modest but detectable entry of both dyes, which increased linearly when more pulses were applied. The influx of Pr per pulse was constant and independent of the pulse number. The influx of YP per pulse was highest with 1- and 2-pulse exposures, decreasing to about twice the Pr level for trains from 5 to 100 pulses. The constant YP/Pr influx ratio for trains of 5 to 100 pulses suggests that increasing the number of pulses permeabilizes cells to a greater extent by increasing the pore number and not the pore diameter.
Keywords: Nanosecond pulses, Electroporation, Electropermeabilization, Nanopores, nsEP, propidium, Membrane permeability
1. Introduction
Uptake of propidium (Pr) by cells exposed to intense, pulsed electric fields is among the most common methods for revealing cell membrane permeabilization [1-16]. This dye is essentially non-fluorescent in the extracellular medium, but the emission increases 20-30 fold upon entering cells and binding to nucleic acids [17] . In contrast to conventional electroporation with milli- and microsecond electric pulses, early studies with nanosecond electric pulses (nsEP) reported diverse cellular effects (calcium activation, apoptosis, swelling, phosphatidylserine externalization) that occurred in the absence of detectable Pr uptake [18-23] or only with a delayed (secondary) Pr uptake [18,23,24]. These results were interpreted as a proof of a direct intracellular impact of nsEP, consistent with theoretical predictions [1,22,25,26]. However, later studies demonstrated permeabilization of the cell membrane exposed to nsEP by measuring its electrical conductance [10,15,27,28], the uptake of Tl+ [6,17], Ca2+ [29-31], water [4,10], YO-PRO-1 (YP) dye (which is smaller than Pr) [21,32], and bleomycin [33]. These data suggested that pores formed by nsEP are permeable to smaller solutes but not to Pr. Hence, nsEP-opened pores were thought to be smaller than about 1.5 nm, which is the estimated minimum diameter for the passage of Pr2+ cation [6].
An independent and arguably more accurate approach for estimation of the pore size is based on the blocking of colloid-osmotic cell swelling [4,34]. In brief, only small, pore-permeable solutes leak out of electroporated cells, whereas larger molecules remain trapped in the cell. Concurrently, small solutes from the extracellular medium enter the cell down the electric and/or concentration gradients. The osmotic pressure inside (small solutes plus trapped large solutes) exceeds the outside pressure, leading to water uptake and cell swelling. This process can be blocked, and swelling turned into shrinking, by replacing small solutes outside the cell with larger ones which do not pass into the cell through nanopores. "Titrating" the blocking of cell swelling with sugars and polyethylene glycols of different sizes has set the average diameter of pores opened by 60- and 600-ns pulses at 0.9-1.3 nm [4], consistent with dye uptake findings. Finally, recent in silico modeling of nsEP effects predicts the formation of large numbers of nanometer-sized pores both in the plasma membrane and in internal cell membranes, termed "supraelectroporation" [35].
With that said, pore populations are not necessarily uniform, so individual pores can experience stochastic (thermal) size fluctuations and become Pr-permeable. Intense nsEP treatments make Pr uptake easily detectable [12,13,18,26], although it remains orders of magnitude weaker than in dead or chemically permeabilized cells. The primary Pr influx through nsEP-opened pores should also be clearly distinguished from a downstream, massive, delayed Pr entry due to membrane rupture in swollen cells [36,37], or due to Ca2+-mediated secondary pore opening or enlargement [38].
Pr entry after intense nsEP treatments could result from increasing either the pore size or the pore number, or both. In the case of the size increase, pores will likely lose the salient features of nanopores, such as voltage and current sensitivity and ion selectivity [14,15]. Alternatively, producing larger numbers of long-lived nanopores without changing their permeability could be an attractive tool both for biophysical studies of nanopore properties and for biotechnological applications.
In this study, we evaluated pore size by comparing the influx of two dye molecules of different size, namely YP and Pr. We used stained homogenates of lysed cells and confocal imaging to calibrate the fluorescence intensity against dye concentration. We found that YP fluorescence is linearly proportional to dye concentration, whereas Pr fluorescence is linear only down to 4 µM and disproportionally reduced at lower Pr concentrations. This "lag" hampers the detection of low Pr levels and can explain, at least in part, why many studies with nsEP report no detectable Pr entry. After the correction of fluorescence data by the calibrations, we found that (a) uptake of both YP and Pr increases linearly with pulse number, and (b) the molecular ratio of YP and Pr uptake is constant and independent of the pulse number (at least for 5 to 100 pulses). These data are consistent with increasing the long-lived nanopore population without changing the size or permeability of individual pores.
2. Materials and Methods
Cell culture methods, nsEP generation and delivery to cells, dosimetry, and image acquisition and processing were essentially the same as reported earlier [6,15,37,39] and will only be described in brief here. A novel method of calibrating the emission of DNA stains against their concentrations is introduced and discussed in section 3.2 under "Results".
2.1. Cells and media
CHO-K1 cells (Chinese hamster ovary) were obtained from the American Type Culture Collection (ATCC, Manassas, VA) and propagated as described elsewhere [6,37]. For the passage immediately preceding experiments, cells were transferred onto glass coverslips pretreated with poly-L-lysine to improve adhesion. The media and its components were purchased from Mediatech Cellgro (Herdon, VA) except for the serum (Atlanta Biologicals, Norcross, GA).
2.2. Cell imaging
A cover slip with cells was transferred into a glass-bottomed chamber (Warner Instruments, Hamden, CT) mounted on an Olympus IX81 inverted microscope equipped with an FV 1000 confocal laser scanning system (Olympus America, Center Valley, PA). The chamber was filled with a buffer composed of (in mM): 136 NaCl, 5 KCl, 2 MgCl2, 2 CaCl2, 10 HEPES, and 10 glucose (pH 7.4), with the addition of 5 µg/ml (7.5 µM) of Pr iodide and 1 µM of YP iodide. This ratio of concentrations was established empirically, in order to account for the different brightness of the dyes, enable their reliable detection, and minimize the chance of quenching (see section 3.2). The same concentrations are commonly used in membrane permeabilization studies with these dyes. For one experiment illustrated in Fig. 2, the buffer contained 43 µg/ml of Pr and no YP.
Fig. 2.

Effect of detector sensitivity on the detection of propidium uptake after nsEP exposures (600 ns, 3.75 kV/cm, 1 Hz). From left to right: The cells were exposed sequentially to 1, 5, 50, and again to 50 pulses (as indicated in the legends), and then permeabilized with 0.04% digitonin. The images were taken at about 3 min after each nsEP exposure. Top row: differential-interference contrast (DIC) images. Next rows: propidium fluorescence recorded at different photomultiplier tube (PMT) voltages. Images in the bottom row were obtained with Kalman noise filtering (n=3) and digitally enhanced. Note that propidium entry can be detected even after a single nsEP, although at the expense of greatly narrowing the dynamic range of detection.
The buffer osmolality was at 290–300 mOsm/kg, as measured with a freezing point microosmometer (Advanced Instruments, Inc., Norwood, MA). The chemicals were obtained from Sigma–Aldrich (St. Louis, MO) and Invitrogen (Eugene, OR).
Images were acquired with a 40×, NA 0.95 dry objective. YP and Pr were excited at 488 and 543 nm, and the emission was collected at 505–525 nm and 560–660 nm, respectively. The lasers were operated in a line sequence mode to avoid the “cross-talking” of the dyes.
The sensitivity of emission detectors (photomultiplier tubes, PMT) was chosen individually for different sets of experiments. For those summarized in Fig. 1, the sensitivity was relatively low, to cover a broad range of Pr uptake with possible pixel saturation only in digitonin-permeabilized cells. For Fig. 2, the PMT sensitivity was tuned as indicated in the figure legend. For experiments in Figs. 3-6 and Fig. 8, the sensitivity was set constant at the highest level which still prevented pixel saturation after the most intense nsEP treatment (100 pulses). Experiments presented in Fig. 7 were performed separately from the rest of the study and utilized somewhat different laser and PMT settings; calibrations shown if Fig. 3 do not apply to these data.
Fig. 1.

Propidium uptake triggered by sequential nsEP treatments (vertical dashed lines in A and B) is modest compared to cell permeabilization by digitonin (A). Panel B shows the same data as panel A, but on a 50-fold expanded vertical scale. All exposures are with 60 ns pulses delivered at 12 kV/cm, 10 Hz; the number of pulses is indicated in the labels ("1 p", "5 p", etc.). The mean effect of digitonin was taken as 100%. CHO cells, n=38, mean +/− s.e. Panel C shows the dye uptake by each of the exposures, measured as a difference in emission immediately prior to each exposure and at 30 s after it. All changes (except the drop after 1 pulse) are statistically significant at least at p<0.01 (one-sample t-test). The inset shows the shape of a 60-ns pulse.
Fig. 3.

Calibration of the emission of propidium (left panel) and YO-PRO-1 in CHO cell lysate. The dyes were added to the lysate at different concentrations but at a constant molar ratio of 7.5. The concentrations are shown both in µM and in molecules per µm3. The DNA content in the lysates was from 0.6 to 2.4 mg/ml, as shown by different symbols. Solid lines show the best fits which were used for calculations in Figs. 5 and 6. See text for more details.
Fig. 6.

The molecular uptake of YO-PRO-1 and propidium (Pr) normalized to the number of pulses. The graphs use the data from Fig. 5C, D to show that each nsEP in trains of 5 or more pulses allows for the entry of a constant number of molecules of each of the dyes. Dashed lines are the best fit linear functions (disregarding the data for fewer than 5 pulses). Shaded areas are the 95% confidence intervals.
Fig. 8.

Lower ratio of propidium/Yo-PRO-1 emissions in nanoporated cells compared to the cell lysate reflects the retardation of propidium entry. The "cell lysate" data were obtained for different concentrations of the dyes in the lysate with 2.4 mg/ml DNA; for all datapoints the Pr concentration was 7.5 times higher than YO-PRO-1. The best fit by a power function (dashed line) corresponds to the emission ratio under the conditions when both dyes had equal and unrestricted access to the substrate. The emission ratios for nanoporated cells at 22 s and 192 s after nsEP, and also for different pulse numbers (from 5 to 100), could also be approximated a power fit (dotted line). The YO-PRO-1/Pr emission ratios were calculated from raw data (in a.u.) without correction for the non-linearity of the Pr response (see Fig. 3). The exposure conditions and the numbers of experiments are the same as in Figs. 4 and 5. See text for more details.
Fig. 7.

Gradual increase of YO-PRO-1 and propidium emission in nanoporated cells is determined by long-lasting transmembrane influx of the dyes. Cells were exposed to 50 pulses (60 ns, 21 kV/cm, 5 Hz) starting at 28 s into the experiment (vertical dashed lines). YP and Pr were both present in the medium either throughout the experiment (a), or only in the beginning of the experiment (b), or only in the end of it (c). The medium with the dyes was replaced by the one without dyes (b) or vice versa (c) by a 30s superfusion at 8 ml/min (68 to 98 s, shown by shaded rectangles). Mean +/− s.e., 13 to 30 cells per group (error bars are shown in direction for clarity). The emission gain in (c) proves that cell membrane remains permeable to the dyes long after nsEP exposure. Cessation of the growth of emission after the removal of dyes in (b) shows that this growth resulted from the continued dye influx through the membrane. Note that dye calibrations (Fig. 3) are not applicable to data in this figure.
Stacks of images captured before and after pulsing (in most experiments, at regular 10-s intervals) were quantified with MetaMorph Advanced v.7.7.10.0 (Molecular Devices, Foster City, CA).
2.3. nsEP exposure and dosimetry
The exposure procedures were similar to those described recently [6,15,39,40]. Nearly rectangular 60- or 600-ns pulses were generated in a custom-made transmission line circuit. The electrical energy was stored in an RG 58 (50 Ohm) coaxial cable and released in a pulse upon closing of a fast MOSFET switch (DE275-102N06A). The duration of the electric pulse equaled the round-trip time of the electromagnetic wave in the coaxial cable, and therefore was proportional to the length of the cable. The amplitude of nsEP generated in this transmission line and measured across a matched 50 Ohm load was about one half of the charging voltage. The amplitudes and shapes of nsEP were captured and measured with a TDS 3052 oscilloscope (Tektronix, Beaverton, OR). The nsEP rise time (10 to 90%) was 3.4 and 6.2 ns for 60- and 600-ns pulses, respectively. The shape of a 60-ns pulse is illustrated in Fig. 1C (inset).
Pulses were triggered externally by a TTL pulse protocol using Digidata 1322A board and Clampex v. 10.2 software (Molecular Devices, Sunnyvale, CA). The nsEP repetition rate, the number of nsEP, and synchronization of nsEP exposure with image acquisitions were all programmed in pClamp.
Throughout this paper, the reported time intervals between nsEP and imaging are those between the onset of exposure and the onset of image acquisition. It should be kept in mind that each image acquisition could take up to 5 s, and nsEP exposures could take up to 10 s (depending on the number of pulses).
Pulses were delivered to a selected cell (or a group cells) with a pair of tungsten rod electrodes (100 μm diameter, 100 or 175 μm gap) driven by a robotic manipulator (MP-225, Sutter Instruments, Novato, CA). The electrodes were positioned precisely at 30 or 50 μm above the coverslip surface at a 40o angle to it. Selected cells were in the middle of the gap between the tips of the electrodes. The cells were randomly oriented with respect to each other and the electrodes; we did not notice any consistent impact of cell orientation or size on the effect of nsEP. For sham exposures, all procedures were identical, but no pulses were triggered.
The electric field at the cell location between the electrodes was determined by 3D simulations as described earlier [15], with a finite-element Maxwell equation solver Amaze 3D (Field Precision, Albuquerque, NM). The calculations use a Laplace equation and are based on an electrostatic model (either dielectric or conductive). For bath buffer resistivity on the order of 100 Ohm × cm, a dielectric relaxation time would be on the order of 1 ns. Since the nsEP duration was much greater than the relaxation time, we disregarded dispersive properties of the medium [41] and used the conductive model. A closed, grounded boundary using the Dirichlet condition was set 10 times gap distance away from the nsEP-delivering electrodes. The grid size was chosen at 1 or 2 µm, and the accuracy of calculations was verified by comparing the modeled electric field with an analytical solution for a canonical electrode configuration (a two-cylinder electrode submerged in the bath buffer medium).
A similar nsEP delivery setup, with the only major difference being a bend at the end of delivering electrodes (to make them parallel to the coverslip), has recently been characterized in great detail [42].
3. Results
3.1. Pr uptake can be detected near the threshold of cell permeabilization by nsEP
These experiments were intended to test whether Pr uptake is indeed triggered by only the most intense nsEP treatments, or whether it also occurs near the threshold of cell permeabilization. While multiple studies reported "the lack of Pr uptake", this could actually mean the "lack of detectable uptake" when the measuring devices (such as flow cytometers and fluorescence microscopes) were routinely adjusted for the detection of cells which are fully permeable to Pr (e.g., dead cells).
In the first set of experiments, CHO cells were subjected to sequential nsEP exposures (60 ns, 12 kV/cm, 10Hz) at 40-s intervals, starting with a single pulse and increasing the number of pulses per exposure to 50 (Fig. 1A). At the end of the experiment, cells were permeabilized by the addition of digitonin, and the average post-digitonin Pr emission was taken as 100%. Fig. 1A shows that even after 86 nsEP (1 + 5 + 10 + 20 + 50), the entry of Pr was essentially at zero when compared to digitonin. However, a simple expansion of the vertical scale reveals a minuscule but reproducible Pr entry already after 5 and 10 pulses (0.036+/−0.012% and 0.11+/− 0.016%, respectively, p < 0.01; Fig. 1B, C). Below in section 3.3 (Fig. 6) we show significant uptake of both Pr and YP (p<0.01) after a single 60-ns pulse at 13.2 kV/cm, which is essentially at the threshold for Ca2+ entry [30].
Confocal imaging at the highest detector sensitivity narrows the measurement range, but enables the detection of intracellular Pr even when its fluorescence is weaker than in the medium (Fig. 2). Pr entry could be visualized after a single 600-ns pulse at 3.75 kV/cm (Fig. 2, bottom), which is close to the threshold for the uptake of a much smaller species, Tl+ (1-2 kV/cm [6]). Thus we conclude that membrane pores opened by 60- and 600-ns pulses near the threshold for cell permeabilization to Tl+ and Ca2+ already have the ability to admit Pr, albeit in modest amounts.
3.2. Calibrations of Pr and YP fluorescence versus dye concentrations
Intracellular Pr and YP fluorescence is primarily associated with dye-DNA complexes, but these dyes can also bind to cytoplasmic RNA, which increases their fluorescence to a smaller extent [17]. One cannot exclude also that some other intracellular compounds may bind these dyes with unpredictable impact on their emission. A dense homogenate of cells provides what is probably the closest practical approximation of the milieu encountered by the dye molecules upon entering into cells and therefore was used for calibration.
A total of about 108 CHO cells in 1.5 ml were disrupted by sonication on ice with a Misonix 4000 ultrasonic processor (Misonix, Farmingdale, NY). The DNA density in the cell-free homogenate was 3 mg/ml as measured by absorbance at 260 nm with a NanoVue Spectrophotometer (GE Healthcare Bio-Sciences, Pittsburgh, PA). Aliquots of the homogenate were equally diluted with buffer containing mixtures of the iodide salts of Pr and YP at a constant molar ratio of 7.5:1 (the same ratio that was used in experiments with cells). Concentrations of Pr and YP in the homogenate ranged from 0 to 15 and from 0 to 2 µM, respectively, and the DNA content in the samples with dyes ranged from 0.6 to 2.4 mg/ml.
After careful mixing, a 40-µl drop of the homogenate was placed on a coverslip and imaged with the FV 1000 microscope using precisely the same settings that were used for cell imaging. The focal plane was chosen at approximately the center of the drop, and images were acquired promptly to avoid evaporation and sedimentation of cell debris. The average values of fluorescence over the image were determined by MetaMorph and plotted against the dye concentrations (Fig. 3).
The emission of Pr increased linearly, except for the concentration range under 4 µM where the emission gain was disproportionally low. This "lag" could be a result of Pr scavenging without increasing its emission, perhaps by unknown cellular constituents present in the homogenate in small quantities. This lag is not likely to result from a non-linearity of the detector, since similar measurements with YP showed a strictly linear dependence.
The responses of the dyes also showed different dependence on the concentration of the homogenate. Pr fluorescence was the same regardless of the homogenate dilution (from 2.4 to 0.6 mg/ml DNA), which proves that even at 0.6 mg/ml there was no shortage of DNA binding sites for up to at least 15 µM of Pr; further increase in DNA content had no effect. In contrast, the emission of YP fell in less concentrated homogenates when using high concentrations of the dye (note that the Pr concentration increased concurrently). The quenching of YP by Pr was observed previously [38]. YP quenching by Förster resonance energy transfer (FRET) might be expected, because the emission of YP is in the excitation range for Pr, and both dyes are likely to be located closely together on DNA or RNA.
The linear range of YP emission (0-0.25 µM YP in the lysate with 2.4 mg/ml DNA; Fig. 3) was taken as the region in which the dye response is unaffected by quenching. The potential inaccuracy in the measured dye concentration introduced by quenching was under 10% at 4-5 µM of Pr and under 20% at 7-8 µM of Pr. Considering that the maximum Pr emission observed in experiments with cells (section 3.3 and Fig. 4) corresponded to a Pr concentration of about 5 µM, the maximum inaccuracy of calibration of YP due to quenching was estimated at under 10%. In actuality, the DNA concentration in live cells is higher than even in the densest homogenate, which minimizes the possible impact of quenching on the dye uptake measurements in live cells.
Fig. 4.
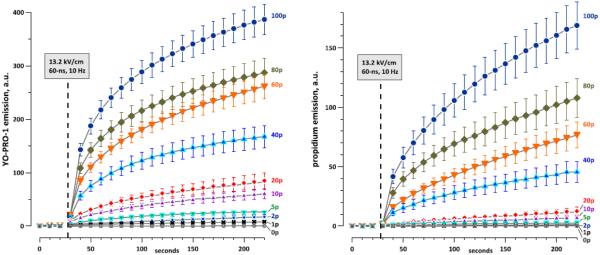
Time dynamics of YO-PRO-1 (left panel) and propidium uptake by CHO cells exposed to different numbers of nsEP (60 ns, 13.2 kV/cm, 10 Hz). The number of pulses is shown in the legends ("0p" is sham exposure). The exposures started at 28 s into the experiment (dashed line), after acquiring 3 pre-exposure images as a background. Mean +/− s.e., 25-35 cells per each group from 4-8 independent experiments.
In summary, the best fits, shown by the solid lines in Fig. 3, were used as calibrations of Pr and YP emissions against their concentrations. For Pr, the dependence followed a power function at lower concentrations and a linear function at higher concentrations. For YP, the dependence was linear throughout the studied range.
3.3. Pr and YP influx as a function of nsEP number and time after the treatment
To avoid possible cumulative and delayed effects from sequential nsEP treatments, cells were exposed only once (60 ns, 13.2 kV/cm, 10 Hz; from 0 to 100 pulses, where 0 pulses was a sham exposed control). Dye influx was monitored by taking images every 10 s for about 3 min after the exposure.
As shown in Fig. 4, dye influx was fastest immediately after the exposure and gradually slowed down. Quantitative comparisons of YP and Pr influxes were performed for two representative time points, early and late after the exposure (22 s and 192 s, Fig.5A, B). While the emission of YP increased linearly with increasing the pulse number, the emission of Pr could not be fit with a single linear function. Instead, we observed a slower emission gain at the lowest pulse numbers, and a faster gain for exposures to 40-100 pulses. However, applying the calibration factors from Fig. 3 corrected the Pr uptake curves into a clearly linear dependence (Fig. 5C, D).
Fig. 5.

The effect of pulse number on the uptake of YO-PRO-1 and propidium (Pr) at 22 s (A, C) and 192 s (B, D) after nsEP exposure. The exposure conditions and the data are the same as in Fig. 4. The dashed lines are the best fits with linear function. In A and B, the Pr data could not be fitted with a single line. C, D: The same data as in A and B after applying the calibration factors from Fig. 3. The molecular uptake of both dyes increases linearly with the number of pulses. Note separate vertical scales for YO-PRO-1 and Pr; the scales are different by a factor of 7.5, which is corresponds to the difference in the bath concentrations of the dyes. See text for further details.
In these two panels, the influxes of Pr and YP are plotted on different vertical scales. In absolute numbers, the influx of Pr was always higher than YP, but a fair comparison must take into account the 7.5 times higher Pr concentration in the medium. Therefore, the vertical axes were scaled by the same factor of 7.5. Since essentially all dye molecules entering the cell will be bound to the substrate, the dye flux into the cell can be assumed to be linearly proportional to its concentration in the medium. The y-axis for YP in Fig. 5C, D can then be also used to estimate the Pr uptake if the concentration of Pr in the medium was the same as YP (1 µM). Likewise, the y-axis for Pr can be applied for both dyes at a concentration of 7.5 µM. Thus, assuming equal concentrations in the external medium, YP uptake by nanoporated cells was about 2-fold faster, regardless of the number of pulses applied.
This finding is corroborated in Fig. 6, which assumes a 1 µM concentration in the medium for both dyes. The dye uptake per pulse is constant throughout the studied range, possibly with the exception of 1- and 2-pulse exposures (which are discussed below). For example, each pulse in a 10-pulse train was just as efficient as each pulse in a 100-pulse train. YP traveled through the electropermeabilized membrane about two times faster than Pr, irrespective of the pulse number.
As an alternative explanation, one might argue that most of the dye uptake happened promptly during nsEP treatments, and the gradual increase of emission afterwards reflected just the process of dye diffusion in the cytoplasm and binding to nucleic acids. This hypothesis was tested and disproved by demonstrating the continual transmembrane dye traffic long after nsEP exposure (Fig. 7).
In these experiments, the dyes were present in the medium all the time; or they were present until 40-70 s post exposure and then washed away; or they were absent initially and made available with the same 40-70 s delay post exposure. The removal and addition of dyes were accomplished by replacing the bath solution (flow by gravity at 8 ml/min for 30 s, with the bath volume being about 0.5 ml). No gain in fluorescence was observed when there was no dye in the medium, i.e., in the absence of transmembrane dye traffic. These data are consistent with our earlier reports of minutes-long transport through nsEP-opened membrane pores [6,14]. Indeed, cytoplasmic diffusion of the dyes and binding to nucleic acids occurs on the scale of seconds or faster (e.g., see the application of digitonin in Fig. 1A), and it was truly their permeability through the membrane that limited the rates of uptake.
Specifically, for nsEP trains from 5 to 100 pulses and assuming 1 µM concentrations of both dyes in the medium, each pulse increased the intracellular concentrations of YP and Pr , respectively, by 3.7+/−0.15 and 1.9+/−0.1 molecules/µm3 at 22 s after nsEP (ratio: 1.93); and by 7.5+/−0.34 and 3.76+/−0.16 molecules/µm3 at 192 s (ratio: 1.99). These ratios were slightly higher than the ratio of the best-fit slopes in Fig. 5C, D, which equaled 1.75 for both time points; this difference resulted from a greater weight of the data for low pulse numbers after normalization (Fig. 6).
If Pr and YP enter into the cells through long-lived nanopores opened by nsEP, the difference in their entry can be reasonably attributed to the pore size (see Discussion for a more formal analysis). The Pr molecule, which is larger than YP, will be more restricted by the pore size. A reduction in the pore size will increase the difference in the permeability, until the entry of Pr is fully blocked. Conversely, an in increase in pore size will reduce the difference (unless pores are already too large to restrict the entry). The experimentally measured constant ratio of YP and Pr uptake indicates that the pore size was not affected by either the time after the exposure or the nsEP number. Instead, increasing the number of pulses increased the number of pores by a certain constant value per each applied pulse, without changing the pore size. Likewise, the gradual decline of dye uptake rate with time after nsEP (Fig. 4) was likely a result of resealing of a fraction of pores rather than of gradual shrinking of individual pores.
For 1- and 2- pulse exposures, the influx of YP per pulse was higher than for 5 pulses and more (Fig. 6). Consequently, the ratio of Pr/YP influxes normalized to the number of pulses increased to 2.5-3, possibly indicating a smaller average pore size than with 5- to 100- pulse trains. However, this result should be taken with caution because of high data variability and low accuracy of measurements made too close to the detection threshold. Similarly, a drop in Pr uptake with 2 pulses at 22 s after nsEP was likely an artifact from measuring a very weak Pr signal. The question whether a single nsEP applied to a yet untreated cell is more efficient at creation of YP-permeable pores than the same nsEP within a multi-pulse train requires further investigation.
3.4. Further evidence for the greater obstruction of Pr uptake by the electroporated membrane
An independent proof that the nsEP-treated cell membrane limits Pr entry more than YP entry comes from the comparison of staining of electroporated cells with staining of the cell homogenate (Fig. 8). The homogenate (2.5 mg/ml DNA) was stained with mixtures of Pr and YP at a constant molar ratio of 7.5. The respective dye concentrations (from 0 to 6 µM of Pr and from 0 to 0.8 µM of YP) were low enough to avoid YP quenching by FRET (see Fig. 3 and section 3.2). With the increase in the concentration of the dyes and the consequent increase in the Pr emission, the ratio of emissions (Pr/YP, both in a. u.) increased, as approximated by the dashed line in Fig. 8. This increase is explained by the nonlinear "lag" of Pr fluorescence at low concentrations (Fig.3). In the homogenate, the Pr/YP emission ratio was determined solely by the dye concentrations, as there was no barrier between the dyes and the nucleic acids. In other words, the dashed line (homogenate data) reflects the fluorescence ratios of the dyes when there is unobstructed access to the substrate. A greater obstruction of the access to the substrate for one of the dyes will shift the Pr/YP emission ratio from the dashed line, either to the left (higher Pr entry) or to the right (higher YP entry).
The emission ratios in cells treated with 5- to 100-nsEP were uniformly shifted to the right, both at 22 and 192 s after nsEP (a dotted line, Fig. 8). Throughout the range of nsEP treatments and with the exception of 1- and 2-pulse exposures (which were omitted from the graph due to high data variability), the emission ratio PI/YP in cells was 1.5-1.6 times lower than in the homogenate. Thus, the data in Fig. 8 confirm that the electroporated cell membrane posed a greater barrier to Pr than to YP. The approach employed to generate Fig. 8 shows that the relative permeability of different dyes can be evaluated even without calibrating the concentration-emission dependence.
4. Discussion
The thresholds for reliable detection of YP and Pr uptake in our experimental conditions were, respectively, about 20 and 200 molecules/µm3. For a fairly large CHO cell (~2 × 104 µm3) and assuming, for simplicity, a uniform Pr distribution, this Pr concentration translates into 4 × 10⁵ Pr molecules per cell. Thus the sensitivity achieved with our set-up was about two orders of magnitude higher than reported previously by Kennedy et al. [9], who measured 5 × 10⁷ Pr molecules per cell by a traditional widefield microscopy and using a CCD camera (cooled by 15 °C). Increasing the PMT voltage along with a slower image acquisition and noise filtering (Fig. 2, bottom) will likely boost the detection limits by additional 1-2 orders of magnitude.
While we confirmed Pr entry even at nsEP intensities close to the permeabilization threshold, it comes as no surprise that this small effect was overlooked by many earlier nsEP studies. The non-linear "lag" in the concentration-emission dependence for Pr (Fig. 3, left panel) further hinders the ability to detect low amounts of intracellular Pr. Our analysis suggests that it was probably not only the size difference between YP and Pr molecules, but also the difference in their fluorescence response at low intracellular concentrations that led to the conclusion that Pr does not enter nanoporated cells.
Pore diameter can be extracted from the permeability ratio of two permeant solute species using excluded volume theory [43,44], as shown by the following relationship,
where Px and Py and δx and δy are the permeabilities and cross-sectional dimensions of two solute species and dpore is the diameter of the pore. To a first approximation for ions as large as Pr and YP, the geometric mean of the three sides of the smallest rectangular solid that holds a space-filling model of the ion can be substituted for δ [43-47]. Using δx = 1.19 nm for YP and δy = 1.26 nm for Pr (extracted with Corina, Molecular Networks GmBH, Erlangen, https://www.molecular-networks.com/products/corina ) and the permeability ratio reported here, Px/Py = 2, and assuming no significant interaction between Pr or YP and the walls of the nanopores, dpore is 1.4 nm. Note that because of the assumptions made, this is an estimate of the minimum pore size that is consistent with the observed permeabilities for Pr and YP. This value is close to but slightly larger than what we expect from observations of pulse-induced osmotic swelling [4,48] and from the predictions of molecular and mathematical models [49,50], which indicate that high-intensity nanosecond pulses produce pores with diameters around 1 nm.
It may be that this small discrepancy falls within the margins of error introduced by the assumptions inherent in our analyses of osmotic swelling and dye influx data, in our application of excluded area theory to the present permeability observations, and in molecular simulations of electroporation. On the other hand, the larger pore diameter calculated from the relative permeabilities of Pr and YP is consistent with the presence of some 1.4 nm diameter pores in the population of pores produced by the 60 ns pulse exposures described here. However, to be consistent with osmotic swelling experiments and molecular models, the percentage of these larger pores in the 60 ns pulse-induced pore population must be relatively small, since they have no significant effect on colloidal osmotic balance [4]. Another interpretation would entail an upward adjustment of the pore-blocking dimensions of the solutes used in [4,48].
Two recent analyses based on numerical models of molecular transport into nanoporated cells reached highly contradictory conclusions. In one study [51], the authors found that nsEP-created pores "begin to shrink immediately after the pulse ceases, and the majority of them vanish between 180 and 200 ns"; they concluded that the electrophoresis during the pulse plays a dominant role in Pr uptake. However, a different model predicted that "essentially all transmembrane molecular transport occurs post-pulse" [52], which is fully consistent with our experimental data. We found earlier that Tl+ uptake by nanoporated cells continues for minutes post pulse[6,14], tracking the recovery of the membrane resistance [28]. Now this observation has been extended to the transport of larger molecules (YP and Pr), which also occurs largely if not exclusively post-pulse (Fig. 7).
Molecular dynamics models of electropores in simple phospholipid membranes [50] have dimensions that are consistent with the nsEP pore populations described here. The lifetime of these simulated pores, however, is less than 1 µs [53,54], which cannot be reconciled with experimental data at this time. This discrepancy between the properties of lipid pores in model phospholipid bilayers and the long pore lifetimes observed in experiments with living cells remains to be resolved. The most likely explanation is that the electropores formed in homogenous lipid bilayers are not the structures responsible for long-term cell membrane permeabilization. Hypothetical long-lived permeabilizing structures include lipid electropores that are prevented from closing by constraining associations with other membrane constituents (membrane or cytoskeletal proteins, for example) and leaky regions of the membrane caused by peroxidation or electromechanically induced mixing. Investigation of these possibilities and others promises to lead to not only a better understanding of electroporation but also to a deeper knowledge of the biophysics of stressed membranes.
Membrane pores produced by nsEP are expected to form and to grow in diameter while the voltage is on, and to collapse to about 1 nm diameter shortly after the pulse [55]. It is not known whether the next pulse in a train can contribute to pore enlargement. Our data show that either this multiple-pulse enlargement does not happen, or it is too short-lived to affect the uptake of dyes. The constant value of dye uptake per pulse for each dye (Fig. 6) suggests that each pulse in the train opens a certain number of pores of a certain diameter range and distribution, and that neither the number nor the diameter of the pores depend on the sequential number of the nsEP in the train (possibly with the exception of the 1 and 2 pulse exposures). This conclusion is somewhat unexpected; for conventional electroporation with long (µs and ms) pulses, the membrane of already permeabilized cells is not charged as efficiently as in intact cells, making them less susceptive to "additional" electroporation. Our results suggest that electroporation by 60-ns pulses is different and only modestly dependent or independent on the presence of pores formed by the preceding pulses.
As a final note, the conclusion that the number of pores and not their size is affected by the number of pulses is consistent with other experimental and theoretical studies, but we do not exclude more complex scenarios and different interpretations of the data. We noted earlier that the Pr-permeable pores are probably just a minor fraction of the total pore population created by nsEP [4]; our present data do not permit any definitive statement about the existence or the number of smaller pores which are fully impermeable to both YP and Pr. One can also argue that the permeability ratio is a function of probability of a brief and stochastic enlargement of small pores to the diameter permeable to YP or Pr, rather than a reflection of a fixed diameter of these pores. Alternatively, the Pr- and YP-permeable pores are not necessarily the fixed structures that were once created by nsEP and which then exist for many minutes; instead, they may stochastically appear and disappear in the cell membrane that was modified by nsEP. While we cannot consider all possible scenarios here, we can postulate that at the functional level (transport of YP, Pr, or similar solutes) they should all be equivalent to an increase in pore number without a change in pore size.
Highlights
> Nanoelectroporated cells are permeable to propidium and YO-PRO-1
> Dye influx is dominated by slow diffusion after nanosecond pulsing
> Dye influx into nanoporated cells increases linearly with the number of pulses
> Multiple pulses increase the number of pores but not their size
Acknowledgements
The study was supported by R01GM088303 from the National Institute of General Medical Sciences. We also thank J.C. Weaver for stimulating and encouraging discussions of the data.
Abbreviations
- DIC
differential-interference contrast
- nsEP
nanosecond electric pulse(s)
- PMT
photomultiplier tube
- Pr
propidium
Footnotes
Publisher's Disclaimer: This is a PDF file of an unedited manuscript that has been accepted for publication. As a service to our customers we are providing this early version of the manuscript. The manuscript will undergo copyediting, typesetting, and review of the resulting proof before it is published in its final citable form. Please note that during the production process errors may be discovered which could affect the content, and all legal disclaimers that apply to the journal pertain.
References
- [1].Pakhomov AG, Miklavcic D, Markov MS, editors. Advanced Electroporation Techniques in Biology in Medicine. CRC Press; Boca Raton: 2010. [Google Scholar]
- [2].Muller KJ, Sukhorukov VL, Zimmermann U. Reversible electropermeabilization of mammalian cells by high-intensity, ultra-short pulses of submicrosecond duration. J Membr Biol. 2001;184:161–170. doi: 10.1007/s00232-001-0084-3. [DOI] [PubMed] [Google Scholar]
- [3].Rols MP, Delteil C, Golzio M, Dumond P, Cros S, Teissie J. In vivo electrically mediated protein and gene transfer in murine melanoma. Nat Biotechnol. 1998;16:168–171. doi: 10.1038/nbt0298-168. [DOI] [PubMed] [Google Scholar]
- [4].Nesin OM, Pakhomova ON, Xiao S, Pakhomov AG. Manipulation of cell volume and membrane pore comparison following single cell permeabilization with 60- and 600-ns electric pulses. Biochim Biophys Acta. 2011;3:792–801. doi: 10.1016/j.bbamem.2010.12.012. [DOI] [PMC free article] [PubMed] [Google Scholar]
- [5].Tekle E, Astumian RD, Chock PB. Selective and asymmetric molecular transport across electroporated cell membranes. Proc Natl Acad Sci U S A. 1994;91:11512–11516. doi: 10.1073/pnas.91.24.11512. [DOI] [PMC free article] [PubMed] [Google Scholar]
- [6].Bowman AM, Nesin OM, Pakhomova ON, Pakhomov AG. Analysis of plasma membrane integrity by fluorescent detection of Tl(+) uptake. J Membr Biol. 2010;236:15–26. doi: 10.1007/s00232-010-9269-y. [DOI] [PMC free article] [PubMed] [Google Scholar]
- [7].Djuzenova CS, Zimmermann U, Frank H, Sukhorukov VL, Richter E, Fuhr G. Effect of medium conductivity and composition on the uptake of propidium iodide into electropermeabilized myeloma cells. Biochim Biophys Acta. 1996;1284:143–152. doi: 10.1016/s0005-2736(96)00119-8. [DOI] [PubMed] [Google Scholar]
- [8].Pucihar G, Miklavcic D, Kotnik T. A time-dependent numerical model of transmembrane voltage inducement and electroporation of irregularly shaped cells. IEEE Trans Biomed Eng. 2009;56:1491–1501. doi: 10.1109/TBME.2009.2014244. [DOI] [PubMed] [Google Scholar]
- [9].Kennedy SM, Ji Z, Hedstrom JC, Booske JH, Hagness SC. Quantification of electroporative uptake kinetics and electric field heterogeneity effects in cells. Biophys J. 2008;94:5018–5027. doi: 10.1529/biophysj.106.103218. [DOI] [PMC free article] [PubMed] [Google Scholar]
- [10].Andre FM, Rassokhin MA, Bowman AM, Pakhomov AG. Gadolinium blocks membrane permeabilization induced by nanosecond electric pulses and reduces cell death. Bioelectrochemistry. 2010;79:95–100. doi: 10.1016/j.bioelechem.2009.12.007. [DOI] [PMC free article] [PubMed] [Google Scholar]
- [11].Sadik MM, Li J, Shan JW, Shreiber DI, Lin H. Quantification of propidium iodide delivery using millisecond electric pulses: experiments. Biochim Biophys Acta. 2013;1828:1322–1328. doi: 10.1016/j.bbamem.2013.01.002. [DOI] [PubMed] [Google Scholar]
- [12].Wang YT, Efimov IR, Cheng Y. Electroporation induced by internal defibrillation shock with and without recovery in intact rabbit hearts. Am J Physiol Heart Circ Physiol. 2012;303:H439–449. doi: 10.1152/ajpheart.01121.2011. [DOI] [PMC free article] [PubMed] [Google Scholar]
- [13].Golzio M, Teissie J, Rols MP. Direct visualization at the single-cell level of electrically mediated gene delivery. Proc Natl Acad Sci U S A. 2002;99:1292–1297. doi: 10.1073/pnas.022646499. [DOI] [PMC free article] [PubMed] [Google Scholar]
- [14].Pakhomov AG, Pakhomova ON. Nanopores: A distinct transmembrane passageway in electroporated cells. In: Pakhomov AG, Miklavcic D, Markov MS, editors. Advanced Electroporation Techniques in Biology in Medicine. CRC Press; Boca Raton: 2010. pp. 178–194. [Google Scholar]
- [15].Pakhomov AG, Bowman AM, Ibey BL, Andre FM, Pakhomova ON, Schoenbach KH. Lipid nanopores can form a stable, ion channel-like conduction pathway in cell membrane. Biochem Biophys Res Commun. 2009;385:181–186. doi: 10.1016/j.bbrc.2009.05.035. [DOI] [PMC free article] [PubMed] [Google Scholar]
- [16].Pucihar G, Kotnik T, Miklavcic D, Teissie J. Kinetics of transmembrane transport of small molecules into electropermeabilized cells. Biophys J. 2008;95:2837–2848. doi: 10.1529/biophysj.108.135541. [DOI] [PMC free article] [PubMed] [Google Scholar]
- [17].Suzuki T, Fujikura K, Higashiyama T, Takata K. DNA staining for fluorescence and laser confocal microscopy. J Histochem Cytochem. 1997;45:49–53. doi: 10.1177/002215549704500107. [DOI] [PubMed] [Google Scholar]
- [18].Chen N, Schoenbach KH, Kolb JF, James Swanson R, Garner AL, Yang J, Joshi RP, Beebe SJ. Leukemic cell intracellular responses to nanosecond electric fields. Biochem Biophys Res Commun. 2004;317:421–427. doi: 10.1016/j.bbrc.2004.03.063. [DOI] [PubMed] [Google Scholar]
- [19].White JA, Blackmore PF, Schoenbach KH, Beebe SJ. Stimulation of capacitative calcium entry in HL-60 cells by nanosecond pulsed electric fields. J Biol Chem. 2004;279:22964–22972. doi: 10.1074/jbc.M311135200. [DOI] [PubMed] [Google Scholar]
- [20].Chen N, Garner AL, Chen G, Jing Y, Deng Y, Swanson RJ, Kolb JF, Beebe SJ, Joshi RP, Schoenbach KH. Nanosecond electric pulses penetrate the nucleus and enhance speckle formation. Biochem Biophys Res Commun. 2007;364:220–225. doi: 10.1016/j.bbrc.2007.09.125. [DOI] [PubMed] [Google Scholar]
- [21].Vernier PT, Sun Y, Gundersen MA. Nanoelectropulse-driven membrane perturbation and small molecule permeabilization. BMC Cell Biol. 2006;7:37. doi: 10.1186/1471-2121-7-37. [DOI] [PMC free article] [PubMed] [Google Scholar]
- [22].Vernier PT, Sun Y, Marcu L, Salem S, Craft CM, Gundersen MA. Calcium bursts induced by nanosecond electric pulses. Biochemical and Biophysical Research Communications. 2003;310:286–295. doi: 10.1016/j.bbrc.2003.08.140. [DOI] [PubMed] [Google Scholar]
- [23].Deng J, Schoenbach KH, Buescher ES, Hair PS, Fox PM, Beebe SJ. The effects of intense submicrosecond electrical pulses on cells. Biophys J. 2003;84:2709–2714. doi: 10.1016/s0006-3495(03)75076-0. [DOI] [PMC free article] [PubMed] [Google Scholar]
- [24].Ford WE, Ren W, Blackmore PF, Schoenbach KH, Beebe SJ. Nanosecond pulsed electric fields stimulate apoptosis without release of pro-apoptotic factors from mitochondria in B16f10 melanoma. Archives of Biochemistry and Biophysics. 2010;497:82–89. doi: 10.1016/j.abb.2010.03.008. [DOI] [PubMed] [Google Scholar]
- [25].Schoenbach KS, Hargrave B, Joshi RP, Kolb J, Osgood C, Nuccitelli R, Pakhomov AG, Swanson J, Stacey M, White JA, Xiao S, Zhang J, Beebe SJ, Blackmore PF, Buescher ES. Bioelectric Effects of Nanosecond Pulses. IEEE Transactions on Dielectrics and Electrical Insulation. 2007;14:1088–1109. [Google Scholar]
- [26].Schoenbach KH, Beebe SJ, Buescher ES. Intracellular effect of ultrashort electrical pulses. Bioelectromagnetics. 2001;22:440–448. doi: 10.1002/bem.71. [DOI] [PubMed] [Google Scholar]
- [27].Ibey BL, Xiao S, Schoenbach KH, Murphy MR, Pakhomov AG. Plasma membrane permeabilization by 60- and 600-ns electric pulses is determined by the absorbed dose. Bioelectromagnetics. 2009;30:92–99. doi: 10.1002/bem.20451. [DOI] [PMC free article] [PubMed] [Google Scholar]
- [28].Pakhomov AG, Kolb JF, White JA, Joshi RP, Xiao S, Schoenbach KH. Long-lasting plasma membrane permeabilization in mammalian cells by nanosecond pulsed electric field (nsPEF) Bioelectromagnetics. 2007;28:655–663. doi: 10.1002/bem.20354. [DOI] [PubMed] [Google Scholar]
- [29].Pakhomov AG, Semenov I, Xiao S, Pakhomova ON, Gregory B, Schoenbach KH, Ullery JC, Beier HT, Rajulapati SR, Ibey BL. Cancellation of cellular responses to nanoelectroporation by reversing the stimulus polarity. Cell Mol Life Sci. 2014 doi: 10.1007/s00018-014-1626-z. [DOI] [PMC free article] [PubMed] [Google Scholar]
- [30].Semenov I, Xiao S, Pakhomova ON, Pakhomov AG. Recruitment of the intracellular Ca by ultrashort electric stimuli: The impact of pulse duration. Cell Calcium. 2013;54:145–150. doi: 10.1016/j.ceca.2013.05.008. [DOI] [PMC free article] [PubMed] [Google Scholar]
- [31].Semenov I, Xiao S, Pakhomov AG. Primary pathways of intracellular Ca(2+) mobilization by nanosecond pulsed electric field. Biochim Biophys Acta. 2013;1828:981–989. doi: 10.1016/j.bbamem.2012.11.032. [DOI] [PMC free article] [PubMed] [Google Scholar]
- [32].Napotnik TB, Wu YH, Gundersen MA, Miklavcic D, Vernier PT. Nanosecond electric pulses cause mitochondrial membrane permeabilization in Jurkat cells. Bioelectromagnetics. 2012;33:257–264. doi: 10.1002/bem.20707. [DOI] [PubMed] [Google Scholar]
- [33].Silve A, Leray I, Mir LM. Demonstration of cell membrane permeabilization to medium-sized molecules caused by a single 10 ns electric pulse. Bioelectrochemistry. 2012;87:260–264. doi: 10.1016/j.bioelechem.2011.10.002. [DOI] [PubMed] [Google Scholar]
- [34].Kinosita K, Jr., Tsong TY. Formation and resealing of pores of controlled sizes in human erythrocyte membrane. Nature. 1977;268:438–441. doi: 10.1038/268438a0. [DOI] [PubMed] [Google Scholar]
- [35].Gowrishankar TR, Weaver JC. Electrical behavior and pore accumulation in a multicellular model for conventional and supra-electroporation. Biochem Biophys Res Commun. 2006;349:643–653. doi: 10.1016/j.bbrc.2006.08.097. [DOI] [PMC free article] [PubMed] [Google Scholar]
- [36].Pakhomova ON, Gregory BW, Semenov I, Pakhomov AG. Two modes of cell death caused by exposure to nanosecond pulsed electric field. PLoS One. 2013;8:e70278. doi: 10.1371/journal.pone.0070278. [DOI] [PMC free article] [PubMed] [Google Scholar]
- [37].Pakhomova ON, Gregory BW, Khorokhorina VA, Bowman AM, Xiao S, Pakhomov AG. Electroporation-induced electrosensitization. PLoS One. 2011;6:e17100. doi: 10.1371/journal.pone.0017100. [DOI] [PMC free article] [PubMed] [Google Scholar]
- [38].Pakhomova ON, Gregory B, Semenov I, Pakhomov AG. Calcium-mediated pore expansion and cell death following nanoelectroporation. Biochim Biophys Acta. 2014;1838:2547–2554. doi: 10.1016/j.bbamem.2014.06.015. [DOI] [PMC free article] [PubMed] [Google Scholar]
- [39].Pakhomov AG, Xiao S, Pakhomova ON, Semenov I, Kuipers MA, Ibey BL. Disassembly of actin structures by nanosecond pulsed electric field is a downstream effect of cell swelling. Bioelectrochemistry. 2014 doi: 10.1016/j.bioelechem.2014.01.004. [DOI] [PMC free article] [PubMed] [Google Scholar]
- [40].Ibey BL, Mixon DG, Payne JA, Bowman A, Sickendick K, Wilmink GJ, Roach WP, Pakhomov AG. Plasma membrane permeabilization by trains of ultrashort electric pulses. Bioelectrochemistry. 2010;79:114–121. doi: 10.1016/j.bioelechem.2010.01.001. [DOI] [PMC free article] [PubMed] [Google Scholar]
- [41].Merla C, Denzi A, Paffi A, Casciola M, d'Inzeo G, Apollonio F, Liberti M. Novel Passive Element Circuits for Microdosimetry of Nanosecond Pulsed Electric Fields. Ieee Transactions on Biomedical Engineering. 2012;59:2302–2311. doi: 10.1109/TBME.2012.2203133. [DOI] [PubMed] [Google Scholar]
- [42].Wu YH, Arnaud-Cormos D, Casciola M, Sanders JM, Leveque P, Vernier PT. Moveable Wire Electrode Microchamber for Nanosecond Pulsed Electric-Field Delivery. Ieee Transactions on Biomedical Engineering. 2013;60:489–496. doi: 10.1109/TBME.2012.2228650. [DOI] [PubMed] [Google Scholar]
- [43].Dwyer TM, Adams DJ, Hille B. The permeability of the endplate channel to organic cations in frog muscle. J Gen Physiol. 1980;75:469–492. doi: 10.1085/jgp.75.5.469. [DOI] [PMC free article] [PubMed] [Google Scholar]
- [44].Dyachok O, Zhabyeyev P, McDonald TF. Electroporation-induced inward current in voltage-clamped guinea pig ventricular myocytes. J Membr Biol. 2010;238:69–80. doi: 10.1007/s00232-010-9320-z. [DOI] [PubMed] [Google Scholar]
- [45].Adams DJ, Dwyer TM, Hille B. The permeability of endplate channels to monovalent and divalent metal cations. J. Gen. Physiol. 1980;75:493–510. doi: 10.1085/jgp.75.5.493. [DOI] [PMC free article] [PubMed] [Google Scholar]
- [46].Cohen BN, Labarca C, Davidson N, Lester HA. Mutations in M2 alter the selectivity of the mouse nicotinic acetylcholine receptor for organic and alkali metal cations. J Gen Physiol. 1992;100:373–400. doi: 10.1085/jgp.100.3.373. [DOI] [PMC free article] [PubMed] [Google Scholar]
- [47].Wu SN, Wu PY, Tsai ML. Characterization of TRPM8-like channels activated by the cooling agent icilin in the macrophage cell line RAW 264.7. J Membr Biol. 2011;241:11–20. doi: 10.1007/s00232-011-9358-6. [DOI] [PubMed] [Google Scholar]
- [48].Romeo S, Wu YH, Levine ZA, Gundersen MA, Vernier PT. Water influx and cell swelling after nanosecond electropermeabilization. Biochim Biophys Acta. 2013;1828:1715–1722. doi: 10.1016/j.bbamem.2013.03.007. [DOI] [PubMed] [Google Scholar]
- [49].Son RS, Smith KC, Gowrishankar TR, Vernier PT, Weaver JC. Basic Features of a Cell Electroporation Model: Illustrative Behavior for Two Very Different Pulses. J Membr Biol. 2014 doi: 10.1007/s00232-014-9699-z. [DOI] [PMC free article] [PubMed] [Google Scholar]
- [50].Levine ZA, Vernier PT. Life cycle of an electropore: field-dependent and field-independent steps in pore creation and annihilation. J Membr Biol. 2010;236:27–36. doi: 10.1007/s00232-010-9277-y. [DOI] [PubMed] [Google Scholar]
- [51].Li J, Tan W, Yu M, Lin H. The effect of extracellular conductivity on electroporation-mediated molecular delivery. Biochim Biophys Acta. 2013;1828:461–470. doi: 10.1016/j.bbamem.2012.08.014. [DOI] [PubMed] [Google Scholar]
- [52].Smith KC, Weaver JC. Transmembrane molecular transport during versus after extremely large, nanosecond electric pulses. Biochem Biophys Res Commun. 2011;412:8–12. doi: 10.1016/j.bbrc.2011.06.171. [DOI] [PMC free article] [PubMed] [Google Scholar]
- [53].Tieleman DP. The molecular basis of electroporation. BMC Biochem. 2004;5:10. doi: 10.1186/1471-2091-5-10. [DOI] [PMC free article] [PubMed] [Google Scholar]
- [54].Tarek M. Membrane electroporation: a molecular dynamics simulation. Biophysical Journal. 2005;88:4045–4053. doi: 10.1529/biophysj.104.050617. [DOI] [PMC free article] [PubMed] [Google Scholar]
- [55].Smith KC, Son RS, Gowrishankar TR, Weaver JC. Emergence of a large pore subpopulation during electroporating pulses. Bioelectrochemistry. 2014;100:3–10. doi: 10.1016/j.bioelechem.2013.10.009. [DOI] [PubMed] [Google Scholar]