Abstract
Expression profiling of distinct central nervous system (CNS) cell populations has been employed to facilitate disease classification and to provide insights into the molecular basis of brain pathology. One important cell type implicated in a wide variety of CNS disease states is the resident brain macrophage (microglia). In these studies, microglia are often isolated from dissociated brain tissue by flow sorting procedures (FACS) or from postnatal glial cultures by mechanic isolation. Given the highly dynamic and state-dependent functions of these cells, the use of FACS or short-term culture methods may not accurately capture the biology of brain microglia. In the current study, we performed RNA-sequencing using Cx3cr1+/GFP labeled microglia isolated from the brainstem of 6-week old mice to compare the transcriptomes of FACS-sorted versus laser-captured (LCM) microglia. While both isolation techniques resulted in a large number of shared (common) transcripts, we identified transcripts unique to FACS-isolated and LCM-captured microglia. In particular, ~50% of these LCM-isolated microglial transcripts represented genes typically associated with neurons and glia. While these transcripts clearly localized to microglia using complementary methods, they were not translated into protein. Following the induction of murine experimental autoimmune encephalomyelitis (EAE), increased oligodendrocyte and neuronal transcripts were detected in microglia, while only the myelin basic protein oligodendrocyte transcript was increased in microglia after traumatic brain injury (TBI). Collectively, these findings have implications for the design and interpretation of microglia transcriptome-based investigations.
Keywords: laser-capture microdissection, fluorescence-activated cell sorting, macrophage
Introduction
Advances in RNA-sequencing methodologies now enable researchers to study the individual contributions of select cell types to disease (Ozsolak and Milos 2011). In the setting of central nervous system (CNS) pathology, microglia both respond to and participate in neurological disease. Microglia resemble immune system-like cells (macrophages) that originate either from the bone marrow during post-natal life (monocytes) or mature within the developing brain during embryogenesis (microglia). As such, microglia have been implicated in the pathogenesis of numerous disorders affecting the CNS, including brain tumors (Graeber et al. 2002; Roggendorf et al. 1996), multiple sclerosis (Jack et al. 2005; Matsumoto et al. 1992), amyotrophic lateral sclerosis (Lewis et al. 2012), Alzheimer’s disease (Davis et al. 1992; Meda et al. 1995; Sasaki et al. 1997), and traumatic brain injury (Hernandez-Ontiveros et al. 2013; Ramlackhansingh et al. 2011). Their seminal roles in initiating and promoting CNS disease have resulted in early phase clinical studies that target microglia function using non-selective inhibitors (e.g., minocycline). Unfortunately, these trials failed to demonstrate efficacy (Casha et al. 2012), highlighting the need to target the specific products elaborated by these stromal cell types.
The development of therapeutic strategies that target microglia-produced factors requires the identification of microglia transcripts in both health and in the context of neurological disease. Several methods are now typically employed for these studies, including microglia culture in vitro (Hassan et al. 1991; Ohtaki et al. 2013; Szabo and Gulya 2013), fluorescence-activated cell sorting (FACS) (Hassan et al. 1991), laser capture microdissection (LCM) (Waller et al. 2012), and ribosome mRNA-trap (BacTRAP and Ribo-Tag) technologies (Heiman et al. 2008; Sanz et al. 2009). While each of these approaches has its strengths and limitations, there are two major barriers to these discovery efforts: First, the RNA routinely isolated from microglia is in low abundance and frequently of low quality, necessitating new methods for RNA isolation and analysis (Pong et al. 2013b; Tariq et al. 2011).
Second, microglia are highly dynamic cells (Parkhurst and Gan 2010), which change their morphology and expression profile in response to their local environment. In this regard, in vitro adaptation results in microglia activation and expression of transcripts not found in vivo (Hurley et al. 1999). Moreover, these activated microglia produce an enhanced inflammatory response which is toxic to neurons, and likely does not accurately recapitulate their natural state in the brain (Dheen et al. 2007; Kaindl et al. 2012; Kettenmann et al. 2013). For this reason, it is important to study microglia in situ. Since microglia-specific Ribo-TRAP mice are not currently available, there has been a heavy reliance on LCM- or FACS-based methodologies.
In the current report, we sought to leverage optimized RNA-sequencing methods to compare the transcriptomes obtained from LCM- versus FACS-isolated Cx3cr1+/GFP microglia. While both isolation techniques revealed a majority of shared transcripts, we were able to identify transcripts unique to either FACS- or LCM-isolated microglia. Of the LCM-specific microglial transcripts, the majority represented genes typically associated with neurons or glia. While these transcripts were shown to localize to microglia, they were not translated into protein. Moreover, in the setting of two experimental mouse models of CNS pathology, neuronal and oligodendroglial transcripts were increased in microglia following the induction of experimental allergic encephalomyelitis (EAE), whereas the myelin basic protein oligodendrocyte transcript was increased after traumatic brain injury (TBI).
Materials and Methods
Mice
Wild type (WT; C57Bl/6), Cx3cr1+/GFP (Jung et al. 2000), and Iba1-EGFP (Hirasawa et al. 2005) mice were maintained on a C57Bl/6 background and used in accordance with approved Animal Study Committee protocols at the Washington University School of Medicine. Mice were euthanized at 6 weeks of age, and tissues were collected for histological analyses, RNA expression, LCM, and FACS.
EAE was induced by injecting myelin oligodendrocyte glycoprotein (MOG) peptide fragment 35-55 (MEVGWYRSPFSRVVHLYRNGK) (CS Bio Company, Menlo Park, CA) dissolved in complete Freund’s adjuvant (CFA) into Iba1-EGFP mice (n=4), followed by two injections of 200ng Pertussis toxin (Enzo Life Sciences, Farmingdale, NY). Neurological functional tests were performed using a five-point standardized rating scale: 0 = no clinical signs; 1 = tail paralysis; 2 = mild hind limb weakness; 3 = moderate to severe hind limb paresis; 4 = complete hind limb paralysis and partial forelimb weakness; 5 = moribund state or death (Racke 2001). Animals were collected post-immunization day 10-14 at clinical score 2. Control animals (n=4) received CFA-only injections.
Controlled cortical impact (CCI) experimental traumatic brain injury (TBI) was induced in 8-week-old Iba1-EGFP mice (n=4). Following induction of anesthesia with isoflurane (5% induction, 2% maintenance) and positioning on a stereotaxic frame, a 5.0mm left lateral craniotomy was performed. The CCI injury was produced by impacting a 3.0mm diameter metal tip onto the cortex (5m/s, 100ms dwell time) centered at 2.7mm lateral to midline and 3.0mm anterior to lambda with an impact depth of 2.0mm. This produces a moderately severe contusion in the left sensorimotor cortex and underlying hippocampus. The sham group consisted of mice that received a craniotomy, but not a cortical impact (n=4). Following the injury, a plastic skull cap was secured over the craniotomy, and the skin incision was sutured. Mice were kept at 37°C throughout the procedure and during recovery until return of normal ambulation (Tran et al. 2011). Animals were euthanized at 7 days following the experimental injury, when numbers of microglia were observed to be the highest (Jiang and Brody 2012).
Isolation of microglial cells for fluorescence-activated cell sorting
Pools of 6-10 mouse brainstems per experiment were collected, triturated and passed through a pre-wetted 70μm cell strainer. Enzymatic dissociation was performed by incubation of tissue with collagenase and DNase I (Sigma, St. Louis, MO) for 1hr at room temperature while gently rocking. The digested brain tissue was then passed through a 40μm cell strainer and collected by centrifugation at 300xg for 10min at 4°C.
For microglia enrichment, cells were applied to a Percoll density-gradient. Percoll solutions with different densities have been used. To yield a stock isotonic Percoll solution (90%, density 1.123g/ml), nine volume parts of Percoll (density 1.13g/ml; Sigma) were mixed with one volume part of 1.5M NaCl (density 1.058g/ml). Percoll solutions with various percentages (70% [1.1g/ml], 37% [1.05g/ml], and 30% [1.04g/ml]) were prepared via dilution of 90% Percoll with 1x PBS or HBSS with phenol red. The gradient was then centrifuged for 30min at 1200xg without braking.
For FACS, the cell layer at the 70%/37% interface was collected, washed with PBS (containing 1% fetal bovine serum and 0.1% sodium azide) to dilute the contaminating Percoll, followed by centrifugation for 10min at 300xg. Microglia were then processed for antibody-mediated flow sorting (Supp. Table 1) using appropriate controls for gating, as previously described (Simmons et al. 2011). Brainstem microglia from WT mice were CD11b+ CD45low and microglia from Cx3cr1+/GFP mice were CD11b+ CD45low GFP+. FACS samples were sorted directly into TRIzol (Life Technologies Corporation, Carlsbad, CA) for total RNA extraction (Supp. Table 2). Sorting was performed at the High-Speed Cell Sorter Core Facility at the Siteman Cancer Center, Washington University, and data were subsequently analyzed using FlowJo (Tree Star, Inc., Ashland, OR).
For RNA FISH analysis, both interfaces (70%/37% and 37%/30%) were collected.
Laser-capture microdissection
Brainstems dissected from anesthetized and Ringer’s solution-perfused Cx3cr1+/GFP mice were sectioned into 1mm thick sections on ice and placed immediately into cold 4% paraformaldehyde in phosphate buffered saline (PBS) containing ProtectRNA™ RNase Inhibitor (Sigma, St. Louis, MO) for 5 minutes. Sections were washed, embedded in Tissue-Tek O.C.T. Compound (Tissue-Tek, Miles, Inc., Elkhart, IN), cryosectioned at 7μm thickness, and mounted on PEN-membrane slides for collection on a LMD7000 system (Leica Microsystems, Wetzlar, Germany). A total oval area of 170-175μm2 was collected for each GFP+ cell and approximately 1000 cells per sample were collected for RNA extraction in lysis buffer (10 mM Tris-HCl [pH 7.9], 50 mM EDTA [pH 7.9], 0.2M NaCl, 2.2% SDS, 1000 μg/mL proteinase K, 2U/μL RNaseOUT [Invitrogen, Grand Island, NY]) (Supp. Table 2).
RNA isolation
TRIzol-chloroform extraction was used to isolate total RNA from flow sorted cell pellets. Extracted RNA samples were resuspended in Ambion Nuclease-free water (Life Technologies Corporation), snap frozen, and stored at −80°C. An optimized proteinase K/acid phenol protocol was used to extract RNA from LCM samples (Khodosevich et al. 2007). Briefly, cells collected in lysis buffer were incubated at 55°C overnight, and the RNA was isolated in 1:1 phenol (pH 4.2) and chloroform. Total RNA was resuspended in Ambion Nuclease-free water (Life Technologies Corporation), and treated with DNAse prior to storage at −80°C and quality assessment.
RNA was treated with TURBO DNA-free kit (Invitrogen, Grand Island, NY) to eliminate residual DNA prior to quality and yield analysis using the Agilent Eukaryotic Total RNA 6000. RNA quantification was performed using the Quant-iT™ RNA assay kit on a Qubit™ Fluorometer (Life Technologies Corporation).
RNA-Seq
The Ovation® RNA-Seq method was employed for cDNA synthesis according to the manufacturer’s instructions (NuGen, San Carlos, CA). cDNA was then concentrated and suspended in 10mM Tris-HCl (pH 7.6) using the MinElute spin column (Qiagen, Valencia, CA), followed by assessment of the concentration, using the Quant-iT™ dsDNA HS Assay (Life Technologies Corporation), and the molecular weight distribution, using the BioAnalyzer 2100 and the Agilent DNA 7500 Chip Assay (Agilent Technologies, Santa Clara, CA).
500ng cDNA (10ng/μl) was used for Illumina library construction with the Illumina paired-end LT indexing protocol as previously published (Govindan et al. 2012; Mardis et al. 2009). For each library ligation, PCR-optimization was performed to prevent over amplification. For LCM-isolated samples, 120218_LCM_F, 120324_LCM_M, 120414_LCM_F, and 120530_LCM_M (Supp. Table 2), the PCR optimization procedure used 1μL of ligated sample into the KAPA SYBRFAST Universal 2X qPCR Master Mix protocol (Kapa Biosystems, Inc, Woburn, MA.) and the universal Illumina library primers P5 (5′ AATGATACGGCGACCACCGAGATCTA) and P7 (5′ CAAGCAGAAGACGGCATACGAGAT), and samples were amplified using the Eppendorf epigradient S qPCR instrument (98° x 2 minutes, 30 cycles of 98° x 10 seconds, and 65°C x 30 seconds). The optimal PCR cycle for each sample was determined based on the inflection point of the Ct curve and was assessed as 11 cycles for all samples.
The FACS-isolated samples, 1135739, 1135740, 1135741, 1135742, 1135743, and 1135744 (Supp. Table 2), were processed prior to qPCR-based cycle optimizations. Thus, 1μl of each ligated product was amplified using 2X Phusion High-Fidelity PCR Master Mix with HF Buffer (New England BioLabs, Ipswich, MA.) and 200nM P5 and P7 primers and cycled as follows: 98° x 2 minutes, 20 cycles of 98° x 10 seconds, 65°C x 30 seconds, and 72°C x 30 seconds, with a final hold at 72°C. 5μl aliquots were removed from the reactions at cycle numbers 8, 10, 12, 14, 16, and 18. Each aliquot was qualitatively assessed for both amplification product and size using the 2.2% FlashGel™ System (Lonza Group Ltd., Basel, Switzerland). The optimal cycle number was determined based on the presence of amplified library with minimal over-cycled by-products. For each library, the optimal cycle numbers were between 13 and 18.
For all library amplifications, nine PCR reactions per sample were performed using the 2X Phusion High-Fidelity PCR Master Mix as described above and cycled as follows: 98° x 2 minutes, “N” cycles of 98° x 10 seconds, 65°C x 30 seconds, and 72°C x 30 seconds with a final hold at 72°C; where “N” is the optimal cycle number, which had been determined in the prior amplification reaction. Each PCR-amplified library was combined and purified using MinElute PCR Purification columns according to manufacturer’s protocol (Qiagen). Each amplified ligation was then assessed for concentration using Quant-iT™ dsDNA HS Assay (Life Technologies Corporation) and for size using the BioAnalyzer 2100 and the Agilent DNA 1000 Assay (Agilent Technologies, Santa Clara, CA).
500ng of each library from FACS- or LCM-isolated samples were used for SureSelectXT Mouse All Exon capture (Agilent Technologies, Santa Clara, CA). This reagent targets 221,784 exons (49.6Mb) based on the NCBI37/mm9 Mouse genome assembly. Capture libraries were subsequently sized to ~300-500bp using a 1:0.6 sample to AMpureXP bead ratio to which the supernatants were added to 0.9X volumes of beads. The resulting supernatants were discarded, the beads washed, and size-fractioned capture libraries were eluted and diluted to 2nM stocks for subsequent Illumina sequencing. Corresponding RNA-Seq paired end reads were processed using the TopHat (Trapnell et al. 2009) and Cufflinks suite (Trapnell et al., 2010; Roberts et al., 2011a, 2011b). FPKM (fragments per kilobase per million mapped reads) values for each transcript and gene were used to generate transcript levels for comparisons between the different sample types: FACS_WT (wild-type microglia isolated by FACS), FACS_GFP (Cx3cr1+/GFP microglia isolated by FACS) and LCM_GFP (Cx3cr1+/GFP microglia isolated by LCM). Due to FPKM values of zero that can naturally result from Exome capture experiments, calculations were facilitated by adding a value of 1 to all FPKM (FPKM+1) prior to fold change calculations and log2 transformation (FC).
Immunofluorescence
Following anesthetization, mice were transcardially perfused with Ringer’s solution and 4% paraformaldehyde in phosphate buffer. Dissected tissues were postfixed overnight and processed for O.C.T. Compound embedding. Immunofluorescence was performed using appropriate antibodies (Supp. Table 1) and Tyramide Signal Amplification (TSA) kits (Life Technologies Corporation), followed by DAPI counterstaining. Images of the medulla region of the brainstem (Supp. Fig. 1) were subsequently acquired on a Nikon Eclipse TE300 fluorescence inverted microscope (Nikon, Tokyo, Japan) equipped with an optical camera (Optronics, Goleta, CA) and MetaMorph image analysis software (Molecular Devices, Dowingtown, PA).
RNA fluorescence in situ hybridization (RNA FISH)
FISH was performed using QuantiGene ViewRNA kit (Affymetrix Inc., Frederick, MD) according to the manufacturer’s instructions with minor modifications. The conditions were optimized to include a 10min protease treatment. The oligonucleotide probes were commercially designed using the murine Mbp (Accession number NM_001025245.1), Mobp (NM_001039364.2, Mag (NM_010758.2), Syn2 (NM_001111015.1), Crmp1 (NM_001136058.2), Nmnat2 (NM_175460.3) sequences. Representative images of the medulla region of the brainstem (Supp. Fig. 1) were obtained on a Nikon Eclipse TE300 fluorescence inverted microscope (Nikon) and analyzed using MetaMorph image analysis software (Molecular Devices). Individual mRNA punctae in the GFP-positive cells were manually counted, and mRNA molecules per GFP+ microglia and total cells were calculated. All analyses were performed in a blinded fashion.
To verify the localization of the mRNA molecules, representative z-stack images were obtained using a confocal microscope (Olympus FV-500) in green (argon laser) and red (krypton laser) channels and subsequently z-projected.
Statistical analysis
Statistical analysis was performed using GraphPad Prism 5.0 software (GraphPad, La Jolla, CA). Data are represented as mean values ± S.E.M. Statistical significance (set at P<0.05) was assessed by using the Student’s two-tailed t-test. The Grubbs’ outlier test was used to determine statistical outliers.
Results
To compare the RNA expression profiles of microglial cells obtained by FACS and LCM, microglia were isolated from wild-type (CD11b+ CD45low) and Cx3cr1+/GFP (CD11b+ CD45low GFP+) brainstems using FACS (Supp. Fig. 2A) or LCM, based on GFP expression (Supp. Fig. 2B). Histological sections obtained from brain tissue of Cx3cr1+/GFP transgenic mice confirmed specific GFP expression in Iba1-expressing cells (microglia; Supp. Fig. 2C). To generate an accurate transcriptome from extremely limited material (e.g. LCM-isolated samples), combined exome capture enrichment and Illumina RNA-sequencing (cDNA-Capture sequencing) was performed on all samples (Supp. Table 2).
Samples were analyzed using the Cufflinks platform (Roberts et al. 2011a; Roberts et al. 2011b; Trapnell et al. 2010) to calculate differential expression of genes from each sample. Fewer than 0.5% of the genes detected differed between wild-type (WT_FACS) and Cx3cr1+/GFP microglia isolated by FACS (GFP_FACS) (Supp. Fig. 2D), while a greater number of genes differed between microglia of either genotype collected by FACS relative to those collected by LCM (Fig. 1A). Because we were unable to accurately and rapidly detect wild-type microglia lacking GFP expression by LCM, we utilized a combination of differential gene expression methods to identify transcripts uniquely expressed in LCM-collected microglia, regardless of genotype. First, Cx3cr1+/GFP microglia isolated by LCM (GFP_LCM) were compared to WT_FACS, resulting in 526 transcripts enriched in GFP_LCM (2.4%). Similarly, microglia transcripts from GFP_LCM compared to GFP_FACS resulted in 519 transcripts enriched in GFP_LCM (2.3%). The intersection of these two transcript lists allowed us to identify 516 transcripts shared between LCM-collected microglia, independent of the Cx3cr1 genotype (Fig. 1A and Supp. Table 3). The intersection of transcripts that are highly expressed in FACS-isolated microglia resulted in 21 transcripts (0.09%) (Fig. 1A and Supp. Table 4).
Fig. 1. Selection of transcripts for validation.
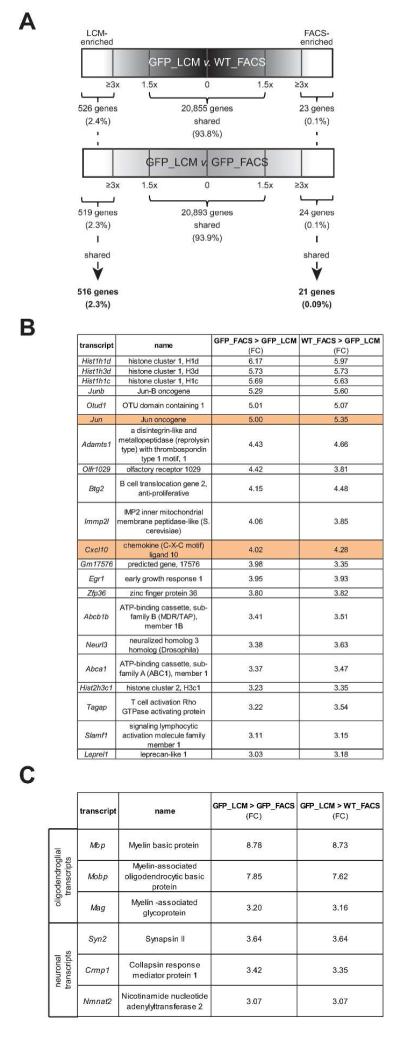
(A) Schematic representation of the transcripts shared and differentially expressed in LCM- and FACS-isolated microglia. The black bar denotes comparisons between WT microglia isolated by FACS (WT_FACS) and Cx3cr1+/GFP microglia isolated by LCM (GFP_LCM), while the gray bar denotes Cx3cr1+/GFP microglia isolated by FACS (GFP_FACS) and Cx3cr1+/GFP microglia isolated by LCM (GFP_LCM). ~94% of the transcripts were shared between microglia isolated by FACS and LCM. Transcripts with a ≥3 fold change (FC) were classified as enriched for LCM-isolated (516 transcripts; 2.3%) or FACS-isolated (21 transcripts; 0.09%) microglia. Candidate transcripts were selected for validation based on a range of FC, importance in microglia function, and cell-type specificity. (B) Transcripts in FACS-sorted microglia show enrichment of transcripts that are involved in several different biological processes, whereas (C) transcripts in LCM-collected microglia are associated with the enrichment of transcripts that are linked to neurons and oligodendrocytes.
We next prioritized transcripts by filtering the lists such that there was a difference in expression of at least FPKM>1 between the FACS-isolated and LCM-isolated samples, resulting in 1047 transcripts with greater expression in LCM-collected microglia (Supp. Table 3) and 125 transcripts with higher expression in FACS-sorted microglia (Supp. Table 4). We then focused on transcripts expressed at a range of ≥3 fold change for further RNA validation as well as protein expression by immunofluorescence.
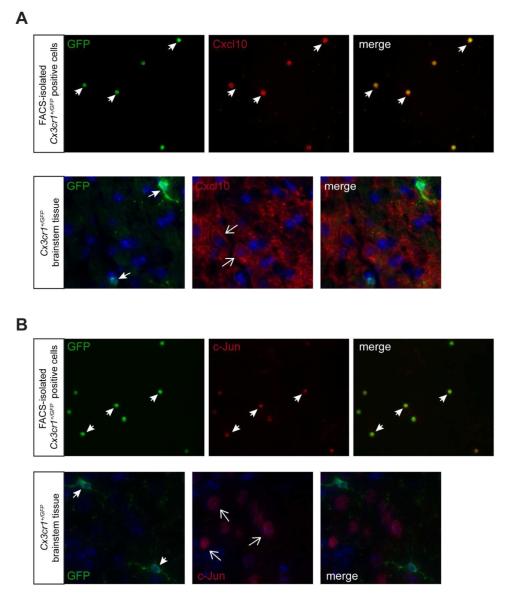
Analysis of the transcripts enriched in FACS-isolated microglia showed high expression of genes implicated in transcriptional control, including four genes belonging to the histone cluster family important for chromatin structure (e.g., Hist1h1d, Hist1h3d, Hist1h1c, Hist2h3c1) (Izzo et al. 2008) and three involved in the regulation of transcription (e.g. Jun-B, Jun and Egr1) (Petersohn and Thiel 1996; Windak et al. 2013). Other transcripts included those relevant to lymphocyte function (e.g., Slamf1, Tagap) (Veillette et al. 2007), cholesterol transport (e.g., Abcb1b, Abca1) (Oram and Vaughan 2000), and inflammatory processes (e.g., Cxcl10, Adamts1) (Klein 2004; Lemarchant et al. 2013) (Fig. 1B). To validate the differential expression of a subset of these transcripts, we performed immunostaining of FACS-sorted GFP+ microglial cells or Cx3cr1+/GFP brainstem sections using commercially-available Cxcl10 and c-Jun antibodies, and confirmed the protein expression of these transcripts in FACS-isolated microglia, but not in normal brain microglia in situ (Fig. 2).
Fig. 2. FACS-enriched transcripts are not expressed in GFP+ microglia in situ.
Immunofluorescence analysis of FACS-sorted Cx3cr1+/GFP microglia and Cx3cr1+/GFP tissue cryosections using Cxcl10 (A) and c-Jun (B) antibodies shows that FACS-sorted GFP-positive microglia express these proteins, whereas GFP-positive microglia in Cx3cr1+/GFP tissue sections do not express these proteins. The nuclei were counterstained with DAPI (blue). Representative images are shown.
Conversely, LCM-isolated microglia expressed transcripts typically found in neurons and glia (Fig. 1C and Supp. Table 5). The majority of transcripts discovered were neuron-specific (e.g., Crmp1, Syn2, Nmnat2) (Cahoy et al. 2008; Doyle et al. 2008; Wang and Strittmatter 1996) or involved in oligodendrocyte function (e.g. Mbp, Mobp, Mag) (Cahoy et al. 2008; Doyle et al. 2008) (Fig. 1C). This cell type specificity was confirmed by immunohistochemistry on normal brain, demonstrating Mobp protein expression in APC-labeled oligodendrocytes and Nmnat2 protein expression in NeuN-labeled neurons (Supp. Fig. 3).
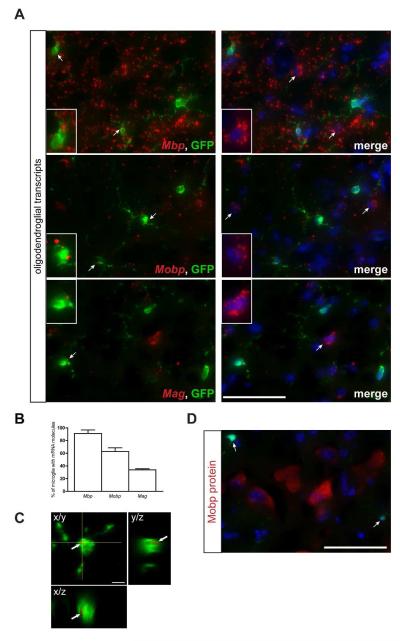
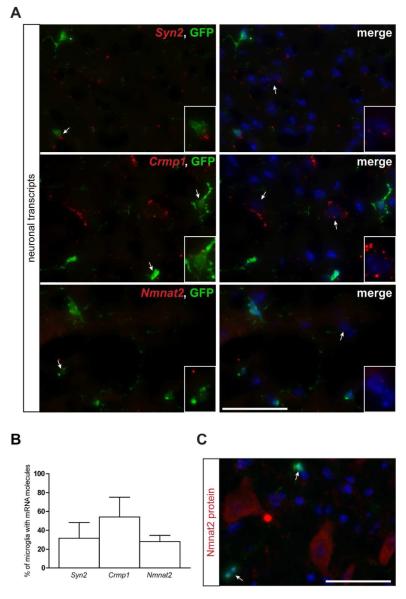
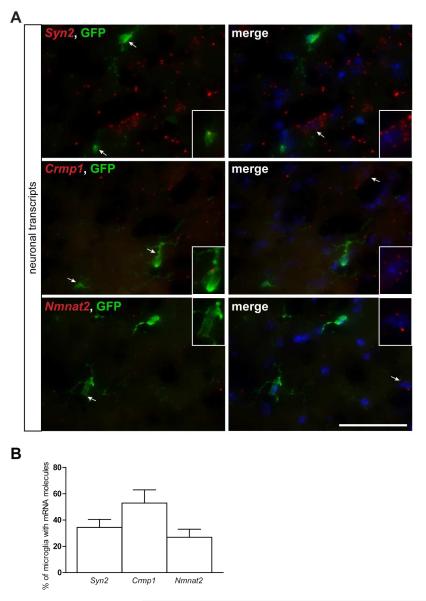
To determine whether the neuron or oligodendrocyte-specific transcripts were localized and expressed in Cx3cr1+/GFP microglia, we performed RNA FISH and immunohistochemistry, respectively. RNA FISH revealed RNA punctae within cell bodies in 28 to 91% of GFP+ microglia, depending on the transcript (Fig. 3 and 4). This was confirmed using high resolution z-stack confocal microscopy (Fig. 3C). In contrast, Mobp and Nmnat2 protein expression was not detected in GFP+ microglia in situ (Fig. 3D and 4C).
Fig. 3. Fluorescent in situ hybridization confirms the localization of oligodendrocyte-specific transcripts in Cx3cr1+/GFP microglia.
(A) RNA FISH reveals oligodendrocyte-specific (Mbp, Mobp, Mag) mRNA punctae (red) in 34-91% (B) of GFP+ microglia. Representative images are shown with insets of GFP-positive microglia as well as GFP-negative cells containing mRNA molecules. Scale bar, 50μm. (C) A representative high resolution confocal z-stack projection demonstrates Mag mRNA puncta in GFP-positive microglia. Arrow points to the co-localization of mRNA and GFP fluorescence (yellow color). x/y, x/z and y/z projections are shown to confirm the intracellular localization of mRNA within a microglial cell body. Scale bar, 5μm. (D) Immunofluorescence analysis of paraformaldehyde-fixed tissue cryosections using Mobp antibodies (red) and endogenous GFP (green) shows that the Mobp mRNA present in Cx3cr1+/GFP microglia is not translated (arrows). The nuclei were counterstained with DAPI (blue). Representative images are shown. Scale bar, 50μm.
Fig. 4. Fluorescent in situ hybridization confirms the localization of neuron-specific transcripts in Cx3cr1+/GFP microglia.
(A) RNA FISH reveals neuron-specific (Syn2, Crmp1, Nmnat2) mRNA punctae (red) in 28-54% (B) of GFP+ microglia. Representative images are shown with insets of GFP-positive microglia as well as GFP-negative cells containing mRNA molecules. Scale bar, 50μm. (C) Immunofluorescence analysis of paraformaldehyde-fixed tissue cryosections using Nmnat2 antibodies (red) and endogenous GFP (green) shows that the Nmnat2 mRNA present in Cx3cr1+/GFP microglia is not translated (arrows). The nuclei were counterstained with DAPI (blue). Representative images are shown. Scale bar, 50μm.
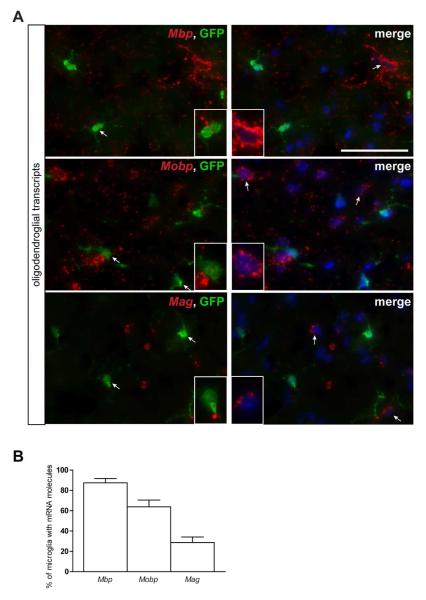
Based on previous experiments in our laboratory and others suggesting that impaired Cx3cr1 expression in Cx3cr1+/GFP mice has consequences for microglia function in the retina (Liang et al. 2009) and is associated with low-grade brain tumors (Pong et al. 2013a), we next employed Iba1-EGFP mice (Hirasawa et al. 2005) as a complementary microglia-specific reporter strain for transcript validation by RNA FISH. Similar to the results obtained using Cx3cr1+/GFP mice, 27-87% of Iba1-EGFP microglia also contained mRNA punctae (Fig. 4 and 5). In addition, we also performed experiments to demonstrate that these oligodendrocytic and neuronal transcripts were also localized to microglia from other regions of the central nervous system: As observed in the brainstem, these transcripts were also found in microglia within the spinal cord and hippocampus of Iba1-EGFP mice (Suppl. Fig. 4 and 5).
Fig. 5. Fluorescent in situ hybridization confirms the localization of oligodendrocyte-specific transcripts in Iba1-EGFP microglia.
(A) RNA FISH reveals oligodendrocyte-specific (Mbp, Mobp, Mag) mRNA punctae (red) in 29-87% (B) of GFP+ microglia. The nuclei were counterstained with DAPI (blue). Representative images are shown with insets of GFP-positive microglia as well as GFP-negative cells containing mRNA molecules. Scale bar, 50μm.
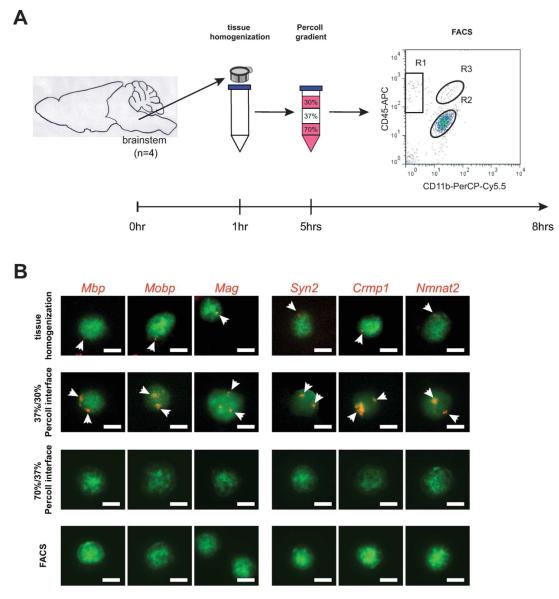
To determine at what stage during tissue processing microglial neuron- and oligodendrocyte-specific transcript localization was lost, Cx3cr1+/GFP cells were subjected to RNA FISH at various times during processing. In these experiments, RNA FISH was performed (1) immediately following the trituration and cell strainer step, (2) after Percoll density gradient centrifugation, and (3) at the end of FACS isolation (Fig. 6A). mRNA punctae were only detected following tissue homogenization, but not in the 70%/37% interface after Percoll density gradient centrifugation or FACS isolation (Fig. 6B). Previous studies have suggested that macrophages from different Percoll fractions are functionally heterogeneous (Bielefeldt Ohmann and Babiuk 1986; O’Neill et al. 1984; Plasman and Vray 1993; Rasmussen et al. 1983), we additionally isolated and analyzed microglia from the 37%/30% Percoll interface, and found that these harbored increased mRNA punctae for all transcripts (Fig. 6B).
Fig. 6. Fluorescent in situ hybridization confirms the localization of neuron-specific transcripts in Iba1-EGFP microglia.
(A) RNA FISH reveals neuron-specific (Syn2, Crmp1, Nmnat2) mRNA punctae (red) in 27-53% (B) of GFP+ microglia. The nuclei were counterstained with DAPI (blue). Representative images are shown with insets of GFP-positive microglia as well as GFP-negative cells containing mRNA molecules. Scale bar, 50μm.
To determine whether the abundance of these oligodendrocyte- and neuron-specific transcripts was influenced by nervous system disease states characterized by microglial infiltration, we analyzed their expression in two experimental murine neurological disease models (EAE and TBI).
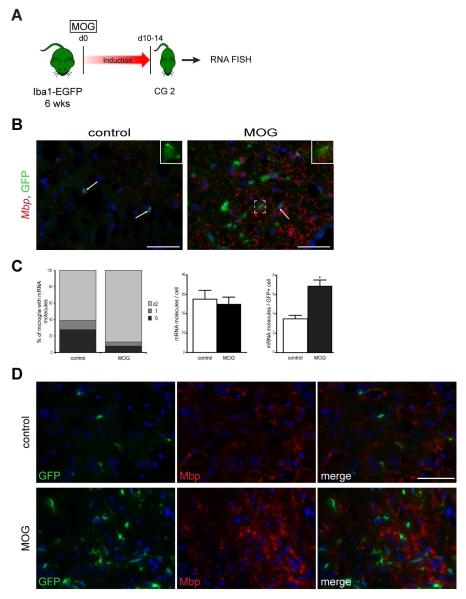
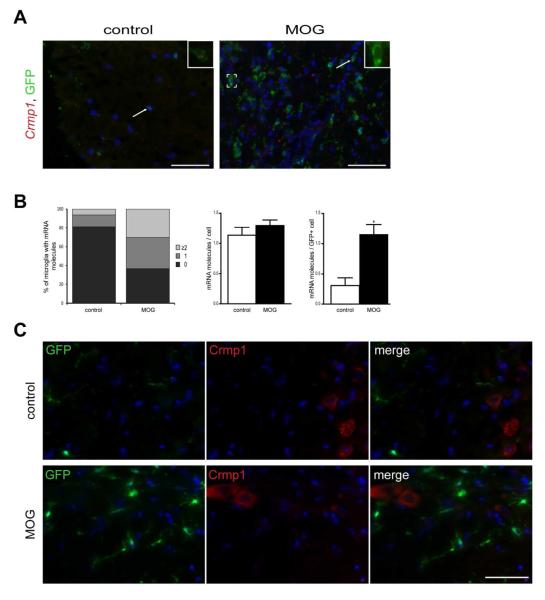
In the setting of EAE, spinal cords of Iba1-EGFP mice were analyzed by RNA FISH at a clinical grade of 2 (Fig. 7A). RNA FISH revealed oligodendroglial (Mbp and Mobp) (Fig. 7B and Supp. Fig. 7) and neuronal (Crmp1 and Nmnat2) (Fig. 8A and Supp. Fig. 6) mRNA punctae in GFP+ microglia at baseline and in response to EAE. Following MOG induction, more microglia with ≥2 mRNA molecules per GFP+ cell were observed (Fig. 7C and 8B, left panels). The increase of Mbp and Crmp1 transcripts in MOG-treated mice was specific to microglia and was not seen in the surrounding cells (Fig. 7C and 8B, right and middle panels). Despite a greater abundance of Mbp and Crmp1 transcripts in MOG-treated mice, neither Mbp nor Crmp1 were translated into protein in GFP+ microglia, as assessed by antibody-based immunofluorescence (Fig. 7D and 8C).
Fig. 7. RNA FISH analysis of Cx3cr1+/GFP microglia during FACS isolation.
(A) Sequence and timing of the steps used in the preparation of GFP+ microglia. Microglia were analyzed after (1) the brainstems were triturated and passed through a cell strainer, (2) Percoll density gradient centrifugation, and (3) FACS isolation. (B) Following each step, isolated cells were subjected to RNA FISH. Microglia show mRNA punctae (arrow; yellow) only at the beginning of the FACS process (following tissue homogenization), and in the 37%/30% Percoll interface, but not in the 37%/70% Percoll interface or after FACS isolation. Representative images are shown. Scale bar, 5μm.
Fig. 8. Fluorescent in situ hybridization shows increased Mbp transcript expression after EAE induction.
(A) Following EAE induction, mice were euthanized 10-14 days post-injection (clinical grade (CG) 2) for RNA FISH. (B) Fluorescent images of RNA-FISH reveal Mbp mRNA punctae (red) in GFP+ microglia (green). Representative images are shown with insets of microglia with RNA transcript expression. (C) MOG treatment results in more microglia with ≥2 mRNA molecules per GFP+ cell relative to control mice (left panels). The increase of Mbp transcripts in MOG-treated mice is microglia-specific (right panels) and was not seen in the surrounding cells (middle panels). Each error bar represents the mean ± S.E.M. Asterisks denote statistically significant differences (*) P <0.0306. (D) Despite a greater abundance of Mbp transcripts in MOG-treated mice, Mbp is not translated into protein in GFP+ microglia as assessed by antibody-based immunofluorescence. The nuclei were counterstained with DAPI (blue). Scale bar, 50μm.
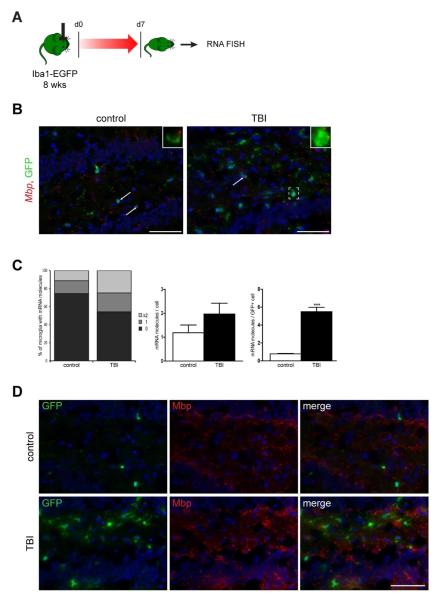
Next, we employed a moderately severe controlled cortical impact TBI model, which generates contusions in the left sensorimotor cortex and hippocampus. Brains were removed for RNA FISH analysis 7 days post-injury from eight-week-old Iba1-EGFP mice (Fig. 9A). In contrast to the EAE model, RNA FISH revealed only increased Mbp transcripts in hippocampal GFP+ microglia (Fig. 9B), with injured mice demonstrating ≥2 mRNA Mbp molecules per GFP+ cell relative to control mice (Fig. 9C, left panel). The increase of Mbp transcripts in injured mice was only observed in the microglia, and not in the surrounding cells (Fig. 9C, right and middle panel). Similar to EAE, there were no GFP+ microglia expressing Mbp, using antibody-based immunofluorescence (Fig. 9D).
Fig. 9. Fluorescent in situ hybridization shows increased Crmp1 transcript expression after EAE induction.
(A) Fluorescent images of RNA-FISH reveal Crmp1 mRNA punctae (red) in GFP+ microglia (green). Representative images are shown with insets of microglia with RNA transcript expression. (B) MOG treatment results in more microglia with ≥2 mRNA molecules per GFP+ cell relative to control mice (left panels). The increase of Crmp1 transcripts in MOG-treated mice is microglia-specific (right panels) and was not seen in the surrounding cells (middle panels). Each error bar represents the mean ± S.E.M. Asterisks denote statistically significant differences (*) P <0.0306. (C) Despite a greater abundance of Crmp1 transcripts in MOG-treated mice, Crmp1 is not translated into protein in GFP+ microglia as assessed by antibody-based immunofluorescence. The nuclei were counterstained with DAPI (blue). Scale bar, 50μm.
Discussion
Faithful representation of the in vivo global transcriptional state of any given class of neural cells using expression profiling techniques is encumbered by the underlying structure of brain tissue, which is typified by heterogeneous, spatially intermingled cell types, distributed in varying proportions. To study cell type-specific gene expression, it is critical to employ methods that optimize selectivity for one class of cells relative to all others, while minimizing the potential for artificially perturbing transcript expression in the process. To this end, we sought to examine and compare the global transcriptional profiles of microglia isolated either by FACS or LCM. To generate an accurate transcriptome from extremely limited material (e.g. LCM-isolated samples), combined exome capture enrichment and Illumina RNA-sequencing (cDNA-Capture sequencing) was performed. The combination of exome capture and RNA-Seq has been shown to offer improved results over conventional RNA-Seq by enriching for coding regions. It is specifically designed to increase the representation of the lowest expressed genes in the transcriptome, while minimizing over-sequencing of the most highly expressed genes (Cabanski et al. 2014). The development of this advanced technology herein has revealed several important findings.
First, the vast majority of transcripts (94%) were identified using both methods, suggesting that either technique is useful for global discovery efforts. In this regard, genes previously reported as microglia-expressed transcripts were detected, including Aif1 (Iba1) (Imai et al. 1996), Cx3cr1 (Boddeke et al. 1999), CD68 (Penfold et al. 1991), Emr1 (F4/80) (Perry et al. 1985) and Itgam (Cd11b) (Morimura et al. 1990).
Second, we identified a small number of transcripts enriched in FACS-isolated microglia. These included genes involved in chromatin structure, such as histone cluster proteins and transcriptional regulators, like Egr1, Jun, and Junb. In addition, other transcripts were found, encompassing a wide variety of potential functions, ranging from lymphocyte activation (T cell activation GTPase activating protein or CD150) to the CXCL10 chemokine and the ADAM metalloproteinase. While the increased expression of these genes is intriguing, it would be premature to conclude that they connote a different state of microglia function. Further mechanistic studies are required to determine whether these FACS-isolated microglia are functionally different than their native counterparts in situ.
Third, 50% of the transcripts enriched in LCM-isolated microglia represent genes typically expressed by other differentiated cell types in the brain. Of these cell type-specific transcripts, the majority were neuronal (60%), with remainder generally found in oligodendrocytes or astrocytes. Using a combination of complementary methods (RNA FISH and z-stack confocal microscopy), these transcripts were demonstrated to be contained within the microglia themselves. However, within the microglia, they are not translated into protein. While their role in microglia physiology is not clear, it is possible that their location in microglia reflect phagocytosis of RNA from cells in their local surround. Support for this hypothesis derives from the Percoll gradient experiments, in which RNA-FISH punctae were found in microglia at the 37%/30% interface, where the majority of phagocytic cells are typically located (Chandler et al. 1986). As such, microglia have been reported to engulf exosomes through macropinocytosis, a process similar to phagocytosis, but occurring without evidence of microglial activation (Fitzner et al. 2011). These exosomes have been shown to contain nucleic acids, including mRNAs (Miranda et al. 2014). In this manner, macropinocytosis clearance could be an important mechanism by which microglia participate in the degradation of mRNA both during normal brain homeostasis and in the setting of CNS pathology. Additional mechanistic studies beyond the scope of this study will be necessary to conclusively demonstrate that microglia mRNA transcript uptake occurs through this process.
Fourth, we showed that some of these oligodendrocyte and neuron mRNA transcripts are increased in microglia in the setting of two murine models of CNS pathology, EAE and TBI, which are both characterized by destruction of myelin sheets and axonal loss. The finding that these transcripts are increased in EAE and TBI is also consistent with a phagocytic process (Davalos et al. 2012; Gitik et al. 2011; Rinner et al. 1995; Venkatesan et al. 2010), but does not prove that this is the mechanism underlying the enrichment of these neuronal or oligodendroglial transcripts within microglia. Further investigation will be required to define the causative reason for the acquisition of these transcripts in microglia both in health and following CNS injury.
In summary, these findings underscore the importance of appreciating the impact of different isolation methods on microglia transcriptomal analyses. Current and future studies that focus on dynamic and potentially phagocytic cell types isolated from primary tissue should be optimized to provide an accurate representation of the resulting transcriptomes. Future work using BacTrap mice (L10a:EGFP; Heiman et al. 2008), instead of GFP as a reporter, could be employed to enable the capture of transcripts directly from microglia with shorter processing times. The use of this strategy and others should enable the isolation of RNA species associated with ribosomes, potentially facilitating the identification of transcripts actively being translated at the time the tissue is analyzed. Such Iba1 transgenic strains are currently under development.
Supplementary Material
Main points.
RNA-sequencing revealed that the method of microglia isolation (FACS, LCM) yields unexpected differences in expression patterns, such that oligodendrocyte- and neuron-associated RNA transcripts are increased in microglia in the setting of CNS pathology.
Fig. 10. Fluorescent in situ hybridization shows increased microglia transcript expression after TBI.
(A) Following CCI induction, mice were euthanized 7 days post-injury for RNA FISH. (B) Fluorescent images of RNA-FISH reveal Mbp mRNA punctae (red) in ipsilateral hippocampal GFP+ microglia (green). Representative images are shown with insets of microglia with RNA transcript expression. (C) TBI results in more microglia with ≥2 mRNA molecules per GFP+ cell relative to control mice (left panel). The increase of Mbp transcripts in injured mice is microglia-specific (right panel) and was not seen in the surrounding cells (middle panel). Each error bar represents the mean ± S.E.M. Asterisks denote statistically significant differences (***) P = 0.0001. (D). Despite a greater abundance of Mbp transcripts in hippocampal microglia of injured mice, Mbp is not translated into protein in GFP+ microglia as assessed by antibody-based immunofluorescence. The nuclei were counterstained with DAPI (blue). Scale bar, 50μm.
Acknowledgements
We thank the Alvin J. Siteman Cancer Center at Washington University School of Medicine and Barnes-Jewish Hospital in St. Louis, MO. for the use of the Siteman Flow Cytometry Core, which provided FACS services, the Washington University Siteman Cancer Center Tumor Tissue Repository. The Siteman Cancer Center is supported in part by the NCI Cancer Center Support Grant #P30 CA91842. We additionally thank Amy Ly, Angela S. Archambault, Dennis Oakley and Thomas J. Esparza for technical expertise. This work was supported by a grant from the National Institutes of Health (RC4 NS072916 to DHG). WWP was partly supported by a grant from the W.M. Keck Foundation.
Footnotes
Authors’ contributions WWP, VM, ERM, DHG jointly supervised research. WWP, ACS, ERM, DHG conceived and designed the experiments. JW, TW, VM, GFW, DLB contributed to experimental design. WWP, ACS, AJA performed the experiments. WWP, ACS, JW, TW, VM, MG, OLG analyzed the data. VM, GFW, SK, ERM, DLB, DHG contributed reagents/materials/analysis tools. WWP, ACS, JW, TW, VM, MG, OLG contributed to the preparation of the manuscript. WWP, ACS, DHG wrote the manuscript. All authors edited and approved the manuscript.
Conflict of Interest The authors declare no conflict of interest.
References
- Bielefeldt Ohmann H, Babiuk LA. Bovine alveolar macrophages: phenotypic and functional properties of subpopulations obtained by Percoll density gradient centrifugation. J Leukoc Biol. 1986;39(2):167–81. doi: 10.1002/jlb.39.2.167. [DOI] [PubMed] [Google Scholar]
- Boddeke EW, Meigel I, Frentzel S, Biber K, Renn LQ, Gebicke-Harter P. Functional expression of the fractalkine (CX3C) receptor and its regulation by lipopolysaccharide in rat microglia. Eur J Pharmacol. 1999;374(2):309–13. doi: 10.1016/s0014-2999(99)00307-6. [DOI] [PubMed] [Google Scholar]
- Cabanski CR, Magrini V, Griffith M, Griffith OL, McGrath S, Zhang J, Walker J, Ly A, Demeter R, Fulton RS. cDNA hybrid capture improves transcriptome analysis on low-input and archived samples. J Mol Diagn. 2014;16(4):440–51. doi: 10.1016/j.jmoldx.2014.03.004. others. [DOI] [PMC free article] [PubMed] [Google Scholar]
- Cahoy JD, Emery B, Kaushal A, Foo LC, Zamanian JL, Christopherson KS, Xing Y, Lubischer JL, Krieg PA, Krupenko SA. A transcriptome database for astrocytes, neurons, and oligodendrocytes: a new resource for understanding brain development and function. J Neurosci. 2008;28(1):264–78. doi: 10.1523/JNEUROSCI.4178-07.2008. others. [DOI] [PMC free article] [PubMed] [Google Scholar]
- Casha S, Zygun D, McGowan MD, Bains I, Yong VW, Hurlbert RJ. Results of a phase II placebo-controlled randomized trial of minocycline in acute spinal cord injury. Brain. 2012;135(Pt 4):1224–36. doi: 10.1093/brain/aws072. [DOI] [PubMed] [Google Scholar]
- Chandler DB, Fuller WC, Jackson RM, Fulmer JD. Fractionation of rat alveolar macrophages by isopycnic centrifugation: morphological, cytochemical, biochemical, and functional properties. J Leukoc Biol. 1986;39(4):371–83. doi: 10.1002/jlb.39.4.371. [DOI] [PubMed] [Google Scholar]
- Davalos D, Ryu JK, Merlini M, Baeten KM, Le Moan N, Petersen MA, Deerinck TJ, Smirnoff DS, Bedard C, Hakozaki H. Fibrinogen-induced perivascular microglial clustering is required for the development of axonal damage in neuroinflammation. Nat Commun. 2012;3:1227. doi: 10.1038/ncomms2230. others. [DOI] [PMC free article] [PubMed] [Google Scholar]
- Davis JB, McMurray HF, Schubert D. The amyloid beta-protein of Alzheimer’s disease is chemotactic for mononuclear phagocytes. Biochem Biophys Res Commun. 1992;189(2):1096–100. doi: 10.1016/0006-291x(92)92317-q. [DOI] [PubMed] [Google Scholar]
- Dheen ST, Kaur C, Ling EA. Microglial activation and its implications in the brain diseases. Curr Med Chem. 2007;14(11):1189–97. doi: 10.2174/092986707780597961. [DOI] [PubMed] [Google Scholar]
- Doyle JP, Dougherty JD, Heiman M, Schmidt EF, Stevens TR, Ma G, Bupp S, Shrestha P, Shah RD, Doughty ML. Application of a translational profiling approach for the comparative analysis of CNS cell types. Cell. 2008;135(4):749–62. doi: 10.1016/j.cell.2008.10.029. others. [DOI] [PMC free article] [PubMed] [Google Scholar]
- Fitzner D, Schnaars M, van Rossum D, Krishnamoorthy G, Dibaj P, Bakhti M, Regen T, Hanisch UK, Simons M. Selective transfer of exosomes from oligodendrocytes to microglia by macropinocytosis. J Cell Sci. 2011;124(Pt 3):447–58. doi: 10.1242/jcs.074088. [DOI] [PubMed] [Google Scholar]
- Gitik M, Liraz-Zaltsman S, Oldenborg PA, Reichert F, Rotshenker S. Myelin down-regulates myelin phagocytosis by microglia and macrophages through interactions between CD47 on myelin and SIRPalpha (signal regulatory protein-alpha) on phagocytes. J Neuroinflammation. 2011;8:24. doi: 10.1186/1742-2094-8-24. [DOI] [PMC free article] [PubMed] [Google Scholar]
- Govindan R, Ding L, Griffith M, Subramanian J, Dees ND, Kanchi KL, Maher CA, Fulton R, Fulton L, Wallis J. Genomic landscape of non-small cell lung cancer in smokers and never-smokers. Cell. 2012;150(6):1121–34. doi: 10.1016/j.cell.2012.08.024. others. [DOI] [PMC free article] [PubMed] [Google Scholar]
- Graeber MB, Scheithauer BW, Kreutzberg GW. Microglia in brain tumors. Glia. 2002;40(2):252–9. doi: 10.1002/glia.10147. [DOI] [PubMed] [Google Scholar]
- Hassan NF, Rifat S, Campbell DE, McCawley LJ, Douglas SD. Isolation and flow cytometric characterization of newborn mouse brain-derived microglia maintained in vitro. J Leukoc Biol. 1991;50(1):86–92. doi: 10.1002/jlb.50.1.86. [DOI] [PubMed] [Google Scholar]
- Heiman M, Schaefer A, Gong S, Peterson JD, Day M, Ramsey KE, Suarez-Farinas M, Schwarz C, Stephan DA, Surmeier DJ. A translational profiling approach for the molecular characterization of CNS cell types. Cell. 2008;135(4):738–48. doi: 10.1016/j.cell.2008.10.028. others. [DOI] [PMC free article] [PubMed] [Google Scholar]
- Hernandez-Ontiveros DG, Tajiri N, Acosta S, Giunta B, Tan J, Borlongan CV. Microglia activation as a biomarker for traumatic brain injury. Front Neurol. 2013;4:30. doi: 10.3389/fneur.2013.00030. [DOI] [PMC free article] [PubMed] [Google Scholar]
- Hirasawa T, Ohsawa K, Imai Y, Ondo Y, Akazawa C, Uchino S, Kohsaka S. Visualization of microglia in living tissues using Iba1-EGFP transgenic mice. J Neurosci Res. 2005;81(3):357–62. doi: 10.1002/jnr.20480. [DOI] [PubMed] [Google Scholar]
- Hurley SD, Walter SA, Semple-Rowland SL, Streit WJ. Cytokine transcripts expressed by microglia in vitro are not expressed by ameboid microglia of the developing rat central nervous system. Glia. 1999;25(3):304–9. doi: 10.1002/(sici)1098-1136(19990201)25:3<304::aid-glia10>3.0.co;2-w. [DOI] [PubMed] [Google Scholar]
- Imai Y, Ibata I, Ito D, Ohsawa K, Kohsaka S. A novel gene iba1 in the major histocompatibility complex class III region encoding an EF hand protein expressed in a monocytic lineage. Biochem Biophys Res Commun. 1996;224(3):855–62. doi: 10.1006/bbrc.1996.1112. [DOI] [PubMed] [Google Scholar]
- Izzo A, Kamieniarz K, Schneider R. The histone H1 family: specific members, specific functions? Biol Chem. 2008;389(4):333–43. doi: 10.1515/BC.2008.037. [DOI] [PubMed] [Google Scholar]
- Jack C, Ruffini F, Bar-Or A, Antel JP. Microglia and multiple sclerosis. J Neurosci Res. 2005;81(3):363–73. doi: 10.1002/jnr.20482. [DOI] [PubMed] [Google Scholar]
- Jiang Y, Brody DL. Administration of COG1410 reduces axonal amyloid precursor protein immunoreactivity and microglial activation after controlled cortical impact in mice. J Neurotrauma. 2012;29(13):2332–41. doi: 10.1089/neu.2012.2362. [DOI] [PMC free article] [PubMed] [Google Scholar]
- Jung S, Aliberti J, Graemmel P, Sunshine MJ, Kreutzberg GW, Sher A, Littman DR. Analysis of fractalkine receptor CX(3)CR1 function by targeted deletion and green fluorescent protein reporter gene insertion. Mol Cell Biol. 2000;20(11):4106–14. doi: 10.1128/mcb.20.11.4106-4114.2000. [DOI] [PMC free article] [PubMed] [Google Scholar]
- Kaindl AM, Degos V, Peineau S, Gouadon E, Chhor V, Loron G, Le Charpentier T, Josserand J, Ali C, Vivien D. Activation of microglial N-methyl-D-aspartate receptors triggers inflammation and neuronal cell death in the developing and mature brain. Ann Neurol. 2012;72(4):536–49. doi: 10.1002/ana.23626. others. [DOI] [PubMed] [Google Scholar]
- Kettenmann H, Kirchhoff F, Verkhratsky A. Microglia: new roles for the synaptic stripper. Neuron. 2013;77(1):10–8. doi: 10.1016/j.neuron.2012.12.023. [DOI] [PubMed] [Google Scholar]
- Khodosevich K, Inta D, Seeburg PH, Monyer H. Gene expression analysis of in vivo fluorescent cells. PLoS One. 2007;2(11):e1151. doi: 10.1371/journal.pone.0001151. [DOI] [PMC free article] [PubMed] [Google Scholar]
- Klein RS. Regulation of neuroinflammation: the role of CXCL10 in lymphocyte infiltration during autoimmune encephalomyelitis. J Cell Biochem. 2004;92(2):213–22. doi: 10.1002/jcb.20052. [DOI] [PubMed] [Google Scholar]
- Lemarchant S, Pruvost M, Montaner J, Emery E, Vivien D, Kanninen K, Koistinaho J. ADAMTS proteoglycanases in the physiological and pathological central nervous system. J Neuroinflammation. 2013;10:133. doi: 10.1186/1742-2094-10-133. [DOI] [PMC free article] [PubMed] [Google Scholar]
- Lewis CA, Manning J, Rossi F, Krieger C. The Neuroinflammatory Response in ALS: The Roles of Microglia and T Cells. Neurol Res Int. 2012;2012:803701. doi: 10.1155/2012/803701. [DOI] [PMC free article] [PubMed] [Google Scholar]
- Liang KJ, Lee JE, Wang YD, Ma W, Fontainhas AM, Fariss RN, Wong WT. Regulation of dynamic behavior of retinal microglia by CX3CR1 signaling. Invest Ophthalmol Vis Sci. 2009;50(9):4444–51. doi: 10.1167/iovs.08-3357. [DOI] [PMC free article] [PubMed] [Google Scholar]
- Mardis ER, Ding L, Dooling DJ, Larson DE, McLellan MD, Chen K, Koboldt DC, Fulton RS, Delehaunty KD, McGrath SD. Recurring mutations found by sequencing an acute myeloid leukemia genome. N Engl J Med. 2009;361(11):1058–66. doi: 10.1056/NEJMoa0903840. others. [DOI] [PMC free article] [PubMed] [Google Scholar]
- Matsumoto Y, Ohmori K, Fujiwara M. Microglial and astroglial reactions to inflammatory lesions of experimental autoimmune encephalomyelitis in the rat central nervous system. J Neuroimmunol. 1992;37(1-2):23–33. doi: 10.1016/0165-5728(92)90152-b. [DOI] [PubMed] [Google Scholar]
- Meda L, Cassatella MA, Szendrei GI, Otvos L, Jr., Baron P, Villalba M, Ferrari D, Rossi F. Activation of microglial cells by beta-amyloid protein and interferon-gamma. Nature. 1995;374(6523):647–50. doi: 10.1038/374647a0. [DOI] [PubMed] [Google Scholar]
- Miranda KC, Bond DT, Levin JZ, Adiconis X, Sivachenko A, Russ C, Brown D, Nusbaum C, Russo LM. Massively parallel sequencing of human urinary exosome/microvesicle RNA reveals a predominance of non-coding RNA. PLoS One. 2014;9(5):e96094. doi: 10.1371/journal.pone.0096094. [DOI] [PMC free article] [PubMed] [Google Scholar]
- Morimura T, Neuchrist C, Kitz K, Budka H, Scheiner O, Kraft D, Lassmann H. Monocyte subpopulations in human gliomas: expression of Fc and complement receptors and correlation with tumor proliferation. Acta Neuropathol. 1990;80(3):287–94. doi: 10.1007/BF00294647. [DOI] [PubMed] [Google Scholar]
- O’Neill SJ, Hoehn SK, Lesperance E, Klass DJ. Functional heterogeneity of isopycnic fractions of rat alveolar macrophages. Infect Immun. 1984;46(1):282–4. doi: 10.1128/iai.46.1.282-284.1984. [DOI] [PMC free article] [PubMed] [Google Scholar]
- Ohtaki H, Tsumuraya T, Song D, Sato A, Ohara K, Miyamoto K, Nakano H, Kiriyama K, Dohi K, Hiraizumi Y. Establishment and characterization of primary adult microglial culture in mice. Acta Neurochir. 2013;118(Suppl):49–54. doi: 10.1007/978-3-7091-1434-6_8. others. [DOI] [PubMed] [Google Scholar]
- Oram JF, Vaughan AM. ABCA1-mediated transport of cellular cholesterol and phospholipids to HDL apolipoproteins. Curr Opin Lipidol. 2000;11(3):253–60. doi: 10.1097/00041433-200006000-00005. [DOI] [PubMed] [Google Scholar]
- Ozsolak F, Milos PM. RNA sequencing: advances, challenges and opportunities. Nat Rev Genet. 2011;12(2):87–98. doi: 10.1038/nrg2934. [DOI] [PMC free article] [PubMed] [Google Scholar]
- Parkhurst CN, Gan WB. Microglia dynamics and function in the CNS. Curr Opin Neurobiol. 2010;20(5):595–600. doi: 10.1016/j.conb.2010.07.002. [DOI] [PMC free article] [PubMed] [Google Scholar]
- Penfold PL, Madigan MC, Provis JM. Antibodies to human leucocyte antigens indicate subpopulations of microglia in human retina. Vis Neurosci. 1991;7(4):383–8. doi: 10.1017/s0952523800004879. [DOI] [PubMed] [Google Scholar]
- Perry VH, Hume DA, Gordon S. Immunohistochemical localization of macrophages and microglia in the adult and developing mouse brain. Neuroscience. 1985;15(2):313–26. doi: 10.1016/0306-4522(85)90215-5. [DOI] [PubMed] [Google Scholar]
- Petersohn D, Thiel G. Role of zinc-finger proteins Sp1 and zif268/egr-1 in transcriptional regulation of the human synaptobrevin II gene. Eur J Biochem. 1996;239(3):827–34. doi: 10.1111/j.1432-1033.1996.0827u.x. [DOI] [PubMed] [Google Scholar]
- Plasman N, Vray B. Mouse peritoneal macrophages: characterization of functional subsets following Percoll density gradients. Res Immunol. 1993;144(2):151–63. doi: 10.1016/0923-2494(93)80070-f. [DOI] [PubMed] [Google Scholar]
- Pong WW, Higer SB, Gianino SM, Emnett RJ, Gutmann DH. Reduced microglial CX3CR1 expression delays neurofibromatosis-1 glioma formation. Ann Neurol. 2013a;73(2):303–8. doi: 10.1002/ana.23813. [DOI] [PMC free article] [PubMed] [Google Scholar]
- Pong WW, Walker J, Wylie T, Magrini V, Luo J, Emnett RJ, Choi J, Cooper ML, Griffith M, Griffith OL. F11R is a novel monocyte prognostic biomarker for malignant glioma. PLoS One. 2013b;8(10):e77571. doi: 10.1371/journal.pone.0077571. others. [DOI] [PMC free article] [PubMed] [Google Scholar]
- Racke MK. Experimental autoimmune encephalomyelitis (EAE) Curr Protoc Neurosci. 2001. Chapter 9:Unit9 7. [DOI] [PubMed]
- Ramlackhansingh AF, Brooks DJ, Greenwood RJ, Bose SK, Turkheimer FE, Kinnunen KM, Gentleman S, Heckemann RA, Gunanayagam K, Gelosa G. Inflammation after trauma: microglial activation and traumatic brain injury. Ann Neurol. 2011;70(3):374–83. doi: 10.1002/ana.22455. others. [DOI] [PubMed] [Google Scholar]
- Rasmussen SE, Rhodes JM, Bennedsen J, Larsen SO. Fractionation of untreated and inflammatory murine peritoneal macrophages on discontinuous Percoll density gradients. Acta Pathol Microbiol Immunol Scand C. 1983;91(4):299–304. [PubMed] [Google Scholar]
- Rinner WA, Bauer J, Schmidts M, Lassmann H, Hickey WF. Resident microglia and hematogenous macrophages as phagocytes in adoptively transferred experimental autoimmune encephalomyelitis: an investigation using rat radiation bone marrow chimeras. Glia. 1995;14(4):257–66. doi: 10.1002/glia.440140403. [DOI] [PubMed] [Google Scholar]
- Roberts A, Pimentel H, Trapnell C, Pachter L. Identification of novel transcripts in annotated genomes using RNA-Seq. Bioinformatics. 2011a;27(17):2325–9. doi: 10.1093/bioinformatics/btr355. [DOI] [PubMed] [Google Scholar]
- Roberts A, Trapnell C, Donaghey J, Rinn JL, Pachter L. Improving RNA-Seq expression estimates by correcting for fragment bias. Genome Biol. 2011b;12(3):R22. doi: 10.1186/gb-2011-12-3-r22. [DOI] [PMC free article] [PubMed] [Google Scholar]
- Roggendorf W, Strupp S, Paulus W. Distribution and characterization of microglia/macrophages in human brain tumors. Acta Neuropathol. 1996;92(3):288–93. doi: 10.1007/s004010050520. [DOI] [PubMed] [Google Scholar]
- Sanz E, Yang L, Su T, Morris DR, McKnight GS, Amieux PS. Cell-type-specific isolation of ribosome-associated mRNA from complex tissues. Proc Natl Acad Sci U S A. 2009;106(33):13939–44. doi: 10.1073/pnas.0907143106. [DOI] [PMC free article] [PubMed] [Google Scholar]
- Sasaki A, Yamaguchi H, Ogawa A, Sugihara S, Nakazato Y. Microglial activation in early stages of amyloid beta protein deposition. Acta Neuropathol. 1997;94(4):316–22. doi: 10.1007/s004010050713. [DOI] [PubMed] [Google Scholar]
- Simmons GW, Pong WW, Emnett RJ, White CR, Gianino SM, Rodriguez FJ, Gutmann DH. Neurofibromatosis-1 heterozygosity increases microglia in a spatially and temporally restricted pattern relevant to mouse optic glioma formation and growth. J Neuropathol Exp Neurol. 2011;70(1):51–62. doi: 10.1097/NEN.0b013e3182032d37. [DOI] [PMC free article] [PubMed] [Google Scholar]
- Szabo M, Gulya K. Development of the microglial phenotype in culture. Neuroscience. 2013;241:280–95. doi: 10.1016/j.neuroscience.2013.03.033. [DOI] [PubMed] [Google Scholar]
- Tariq MA, Kim HJ, Jejelowo O, Pourmand N. Whole-transcriptome RNAseq analysis from minute amount of total RNA. Nucleic Acids Res. 2011;39(18):e120. doi: 10.1093/nar/gkr547. [DOI] [PMC free article] [PubMed] [Google Scholar]
- Tran HT, LaFerla FM, Holtzman DM, Brody DL. Controlled cortical impact traumatic brain injury in 3xTg-AD mice causes acute intra-axonal amyloid-beta accumulation and independently accelerates the development of tau abnormalities. J Neurosci. 2011;31(26):9513–25. doi: 10.1523/JNEUROSCI.0858-11.2011. [DOI] [PMC free article] [PubMed] [Google Scholar]
- Trapnell C, Pachter L, Salzberg SL. TopHat: discovering splice junctions with RNA-Seq. Bioinformatics. 2009;25(9):1105–11. doi: 10.1093/bioinformatics/btp120. [DOI] [PMC free article] [PubMed] [Google Scholar]
- Trapnell C, Williams BA, Pertea G, Mortazavi A, Kwan G, van Baren MJ, Salzberg SL, Wold BJ, Pachter L. Transcript assembly and quantification by RNA-Seq reveals unannotated transcripts and isoform switching during cell differentiation. Nat Biotechnol. 2010;28(5):511–5. doi: 10.1038/nbt.1621. [DOI] [PMC free article] [PubMed] [Google Scholar]
- Veillette A, Dong Z, Latour S. Consequence of the SLAM-SAP signaling pathway in innate-like and conventional lymphocytes. Immunity. 2007;27(5):698–710. doi: 10.1016/j.immuni.2007.11.005. [DOI] [PubMed] [Google Scholar]
- Venkatesan C, Chrzaszcz M, Choi N, Wainwright MS. Chronic upregulation of activated microglia immunoreactive for galectin-3/Mac-2 and nerve growth factor following diffuse axonal injury. J Neuroinflammation. 2010;7:32. doi: 10.1186/1742-2094-7-32. [DOI] [PMC free article] [PubMed] [Google Scholar]
- Waller R, Woodroofe MN, Francese S, Heath PR, Wharton SB, Ince PG, Sharrack B, Simpson JE. Isolation of enriched glial populations from post-mortem human CNS material by immuno-laser capture microdissection. J Neurosci Methods. 2012;208(2):108–13. doi: 10.1016/j.jneumeth.2012.04.014. [DOI] [PubMed] [Google Scholar]
- Wang LH, Strittmatter SM. A family of rat CRMP genes is differentially expressed in the nervous system. J Neurosci. 1996;16(19):6197–207. doi: 10.1523/JNEUROSCI.16-19-06197.1996. [DOI] [PMC free article] [PubMed] [Google Scholar]
- Windak R, Muller J, Felley A, Akhmedov A, Wagner EF, Pedrazzini T, Sumara G, Ricci R. The AP-1 transcription factor c-Jun prevents stress-imposed maladaptive remodeling of the heart. PLoS One. 2013;8(9):e73294. doi: 10.1371/journal.pone.0073294. [DOI] [PMC free article] [PubMed] [Google Scholar]
Associated Data
This section collects any data citations, data availability statements, or supplementary materials included in this article.


