

Abstract
The present study examines concentrations and risks of polycyclic aromatic hydrocarbons (PAHs), nitro-PAHs (NPAHs), steranes, and hopanes in lake trout collected in Lake Michigan. A total of 74 fish were collected in 2 seasons at 3 offshore sites. The total PAH concentration (Σ9PAH) in whole fish ranged from 223 pg/g to 1704 pg/g wet weight, and PAH concentrations and profiles were similar across season, site, and sex. The total NPAH (Σ9NPAH) concentrations ranged from 0.2 pg/g to 31 pg/g wet weight, and carcinogenic compounds, including 1-nitropyrene and 6-nitrochrysene, were detected. In the fall, NPAH concentrations were low at the Illinois site (0.2–0.5 pg/g wet wt), and site profiles differed considerably; in the spring, concentrations and profiles were similar across sites, possibly reflecting changes in fish behavior. In the fall, the total sterane (Σ5Sterane) and total hopane (Σ2Hopane) levels reached 808 pg/g and 141 pg/g wet weight, respectively, but concentrations in the spring were 10 times lower. Concentrations in eggs (fall only) were on the same order of magnitude as those in whole fish. These results demonstrate the presence of target semivolatile organic compounds in a top predator fish, and are consistent with PAH biodilution observed previously. Using the available toxicity information for PAHs and NPAHs, the expected cancer risk from consumption of lake trout sampled are low. However, NPAHs contributed a significant portion of the toxic equivalencies in some samples. The present study provides the first measurements of NPAHs in freshwater fish, and results suggest that additional assessment is warranted.
Keywords: Bioaccumulation, Lake trout, Polycyclic aromatic hydrocarbons (PAHs), Nitro-PAHs (NPAHs), Petroleum biomarkers
INTRODUCTION
The presence of semivolatile organic compounds (SVOCs) in the Great Lakes has been a concern for decades. One class of SVOCs, polycyclic aromatic hydrocarbons (PAHs), includes a number of persistent and ubiquitous environmental pollutants that are formed mainly through incomplete combustion and released into the atmosphere [1]. Other PAH sources include petroleum and petroleum-derived products, as well as diagenetic sources that are derived from biogenic precursors [1]. These pollutants reach the aquatic environment through atmospheric deposition, urban runoff, and municipal/industrial effluents, where they accumulate in bottom sediments and enter the aquatic food web. A number of PAH species are toxic to aquatic invertebrates and fish, potentially causing deformities, lesions, tumors, a compromised immunity, and death [2]. Accumulation of PAHs in sediments and bottom-dwelling invertebrates and fish has been documented in the Great Lakes [3,4]. Benthic fish in the Great Lakes region, such as brown bullhead [5], winter flounder [6], alewife, and minnow [4], have been studied for PAH contaminations, but few studies have examined top predator fish.
Nitrated PAHs, called nitro-PAHs (NPAHs), can have stronger carcinogenic and mutagenic activity than the parent PAHs. For example, the mutagenic activity in Salmonella typhimurzum TA98 of 1,8-dinitropyrene is 3 orders of magnitude higher than that in benzo[a]pyrene, which is considered one of the most toxic PAHs [7]. Nitrated PAHs result from combustion-related emissions, as well as from transformations of atmospheric PAHs [8]. There is also evidence of endogenous production of mutagenic NPAHs in fish (tilapia) exposed to nitrite (NO2−) and a noncarcinogenic PAH (phenanthrene) [9]. As determined for other SVOCs such as PAHs [10], atmospheric deposition is likely to be a major source of NPAHs in the Great Lakes. Information regarding bioaccumulation of NPAHs in aquatic organisms is very limited, although a recent study reported NPAHs at levels of parts per thousand to parts per billion levels in marine bivalves at Osaka Bay, Japan [11].
Hopanes and steranes are 2 additional classes of SVOCs. These materials are derived from the cell membranes of prokaryotes [12] and eukaryotes [13], respectively, and are constituents of crude oil [14]. Both can enter the environment from petrogenic and pyrogenic sources [14]. These compounds have been used as markers or tracers of vehicle exhaust because they are resistant to environmental degradation [14,15] and because they appear specific to diesel and gasoline engine lubricating oils [16]. Toxicity information for hopanes and steranes is unavailable. Bioaccumulation of these compounds has been reported in marine amphipods, bivalves [15], and fish [14], and as related to oil pollution; but concentrations in aquatic biota in the Great Lakes have not been reported.
The Great Lakes ecosystem is particularly vulnerable to contamination because of the numerous urban and industrial emission sources in the region, the Lakes’ large surface areas that increase loadings via atmospheric deposition [10], and the long hydrologic retention times. Lake Michigan has the highest contaminant levels of many contaminants, a result of historically large loadings from agricultural, municipal, and industrial sources [17,18]. The PAHs in the atmosphere and sediments of Lake Michigan have been studied extensively, and contributions from vehicle emissions and coal and coke oven emissions have been documented [19,20]. However, little information exists regarding levels of PAHs in biota, especially in fish. Lake trout (Salvelinus namaycush), a top predator fish, were extirpated from Lake Michigan in the 1950s but have been stocked and rehabilitated back into the Lake since 1965 [21]. Historically, this species has been used as a bioindicator species in the Great Lake Fish Monitoring and Surveillance Program for monitoring trends of polychlorinated biphenyls (PCBs), pesticides, and Hg [18,22], but PAHs, NPAHs, hopanes, and steranes have not been monitored in this program.
The present study characterizes concentrations and profiles of PAHs, NPAHs, hopanes, and steranes in lake trout from Lake Michigan. We investigate possible differences among sampling sites, sex, and season and provide initial estimates of risks to human and fish health from these contaminants. To our knowledge, ours is the first report of NPAHs in freshwater fish and the first since the 1990s for PAHs in Lake Michigan lake trout [23]. The present study is intended to provide new information regarding the concentration, distribution, and risk of the target SVOCs in the aquatic biota of the Great Lakes.
MATERIALS AND METHODS
Fish collection and processing
Lake trout (S. namaycush) were collected at 3 offshore sites on Lake Michigan (Charlevoix, MI, USA; Clay Banks, WI, USA; Waukegan, IL, USA; Figure 1) by personnel from the Michigan Department of Natural Resources, Illinois Department of Natural Resources, and Wisconsin Department of Natural Resources. The fish collection was part of an annual Lake Michigan lake-wide survey supported by the Great Lakes Fishery Commission to assess the progress toward rehabilitation of the lake trout population in Lake Michigan. The 3 sites were chosen to cover a north–south transect of Lake Michigan. Fish were collected by gillnet in fall (September–October) 2011 and spring (April–May) 2012 following well-defined protocols [24]. Individual fish were placed in plastic bags, frozen whole, and shipped to the US Geological Survey Great Lakes Science Center in Ann Arbor, Michigan, where they were thawed; the sexed was noted; and fish were weighed, measured for total length, and homogenized individually in a Robot Coupe grinder. Eggs of female fish collected in the fall were removed before homogenization and analyzed separately. Subsamples of homogenized tissues were stored at −20 °C in solvent-washed glass jars with aluminum foil-lined screw caps until brought to the nearby University of Michigan School of Public Health for analysis. Whole fish (instead of fish fillets) were analyzed to be consistent with the protocol used by the Great Lakes Fish Monitoring and Surveillance Program for PCBs and pesticides in Great Lakes lake trout [18,24].
Figure 1.

Map showing Lake Michigan and sampling locations. Site 1: Charlevoix, Michigan, USA; Site 2: Clay Banks, Wisconsin, USA; Site 3: Waukegan, Illinois, USA. The colors reflect water depth in increments of 100 ft (to >800 ft depth). [Color figure can be viewed in the online issue which is available at wileyonlinelibrary.com]
Materials
The SVOCs selected as target compounds have been frequently detected in airborne and diesel exhaust particulate matter (PM) samples [25,26] and sediments [27]. They included 16 PAHs (US Environmental Protection Agency [USEPA] priority PAHs [28]), 11 NPAHs, 5 hopanes, and 6 steranes (Supplemental Data, Table S1).
All solvents were high-pressure liquid chromatography grade and obtained from Fisher Scientific. Florisil (60–100 mesh) and sodium sulfate (anhydrous, certified American Chemical Society (ACS) granular, 10–60 mesh) for column chromatography were supplied by the same vendor.
Calibration standards included a mixture of 16 PAHs (Sigma-Aldrich), a mixture of 8 NPAHs (Sigma-Aldrich), individual standards for 17α(H),21β(H)-hopane and 20S-5α(H),14α (H),17α(H)-cholestane (Chiron Laboratories), and standard reference material 2266 (National Institute of Standards and Technology). Standard reference material 2266 is a solution of 5 hopanes and 5 steranes in isooctane, which is intended primarily for use in the calibration of chromatographic instrumentation [29]. Fluoranthene-d10 (Cambridge Isotope Laboratories) and an internal standard PAH mixture, which includes anthracene-d10, benzo[a]pyrene-d12, chrysene-d12, and benzo[ghi]perylene-d12 (Wellington Laboratories), were used as internal standards for PAH analyses. For NPAH analyses, 1-nitrofluoanthene-d9 (Cambridge Isotope Laboratories) was used as an internal standard. Lastly, n-tetracosane-d50 (Chiron Laboratories) was used as an internal standard for hopanes and steranes. Surrogate standards included C27-α,α,α-(20R)-cholestane-d2 (for hopanes and steranes), 1-nitropyrene-d9 (for NPAHs), chrysene-d12, and naphthalene-d8 (for PAHs) (Chiron Laboratories).
Sample preparation and chemical analysis
A 10-g subsample was taken from each homogenized sample, to which 15 μL of a surrogate standard (0.2 ng/μL of each compound) was added. The sample was dried with Na2SO4, extracted twice using dichloromethane/hexane (4:1, v/v), and sonicated for 30 min. Any fish tissue was separated from the extract by centrifugation and removed. The extract was passed through an activated Florisil column and fractionated into 3 portions: fraction A was eluted with 15 mL hexane; fraction B was eluted with 15 mL hexane/acetone (1:1, v/v); and fraction C was eluted with 30 mL methanol. Each fraction was then evaporated under an N2 stream to 1 mL. Fraction C was further cleaned to remove lipids by freezing at −79 °C for 5 h and then separating and discarding the frozen lipid solids. Fractions A, B, and C were analyzed for hopanes and steranes, PAHs, and NPAHs respectively.
Target compounds were quantified using a gas chromatography–mass spectrometry (HP 6890/5973; Agilent Industries), an autosampler, and splitless 2 μL injections. Injector and detector temperatures were 275 °C and 280 °C, respectively. Separations used a capillary column (DB-5, 30 m × 0.25 mm inner diameter; film thickness 0.5 μm; J&W Scientific). The carrier gas was He (1.5 mL/min, pressure of 37.4 kPa, average velocity of 31 cm/s), and the mass spectrometry reagent gas was ultra–high-purity methane. Temperature programs for the SVOC analyses have been described previously [30]. The mass spectrometry detector was operated in electron impact mode for PAHs, hopanes, and steranes. Negative chemical ionization mode was used for NPAHs. In each case, 15 μL of the internal standard (0.5 ng/μL of each compound) was added to each sample extract using a 25-μL syringe before gas chromatography–mass spectrometry analysis.
Determination of lipid content
A 3-g subsample was taken from each homogenized sample, mixed with Na2SO4, and extracted twice by dichloromethane/ hexane (4:1, v/v) using sonication. Fish tissue was separated from the extract by centrifugation and removed. Extract was dried under the fume hood and then weighed. The lipid content was calculated as the weight of the dried extract divided by the subsample weight.
Calibration and quality assurance
For calibration, each standard (mentioned in Materials) was prepared at concentrations of 0.01 ng/μL, 0.05 ng/μL, 0.10 ng/ μL, 0.50 ng/μL, and 1.00 ng/μL. All analytes were individually quantified against authentic standards.
Quality assurance measures included regular use of laboratory blanks, replicates, surrogate spike recovery tests, and standard reference materials, specifically standard reference materials 1647e (priority pollutant PAHs in acetonitrile), 2264 (nitrated aromatic hydrocarbons in methylene chloride I), and 2266 (hopanes and steranes in, 2,2,4 trimethylpentane) used for PAHs, NPAHs, and hopanes/steranes, respectively. All standard reference materials were purchased from the National Institute of Standards and Technology. Replicates were performed for 10 whole fish samples and 2 egg samples. Measurement precisions, expressed as the average relative percent difference across the 12 replicate measures and compounds in the group, were 25%, 31%, 19%, and 12% for PAHs, NPAHs, steranes, and hopanes, respectively. Target compounds were not detected in the blanks except for trace levels of naphthalene and phenanthrene. The spike recovery of surrogate standards was 77% to 89% during the study, and the shift (abundance of target compounds in standard solutions before and after running a batch of samples) was within 20%.
Data analysis
Concentrations were calculated as picograms per gram wet weight. Compounds with a detection frequency below 30% (Supplemental Data, Table S1) were excluded from the calculation of statistics (e.g., sums and relative abundances), following guidance for highly censored data [31]. For compounds with a higher detection frequency, measurements below method detection limits (MDLs) were set to MDL/2 (MDLs are listed in Supplemental Data, Table S1). The relative abundance of each PAH compound was calculated as the concentration of each compound divided by the total concentration of PAHs with greater than 30% detection frequency (e.g., in whole fish, 9 PAHs were detected in over 30% of the samples, so the total concentration is denoted as Σ9PAHs). The relative abundances and total concentrations of NPAHs, steranes, and hopanes were similarly determined.
For statistical analyses, data were checked for normality using the Shapiro–Wilk test and for homogeneity of variances among groups using Levene’s test. Group differences were tested using one-way analysis of variance or t tests if variables were normally distributed with equal variances. Nonparametric tests, including Kruskal-Wallis and Wilcoxon tests, were used to compare group means when data distributions were not normal or variances were not equal. Statistical analyses used SAS 9.3 (SAS Institute).
For human health risks, the toxic equivalency (TEQ) for benzo[a]pyrene (BaP) was calculated for target compounds using toxic equivalent factors (TEFs, unitless; Supplemental Data, Table S1) and the equation , where Ci is the concentration of the ith PAH or NPAH in each sample (pg/g) [32]. The new TEQ values (Supplemental Data, Table S1) provided in the 2010 USEPA document [33] were used for PAHs, and TEQs for 4 NPAHs were obtained from the Rhode Island Air Toxics guideline [34]. Two scenarios were considered: 1) the average scenario, including only the compounds with greater than 30% detection frequency, non-detect substituted by MDL/2; and 2) the worst-case scenario, including all target compounds, nondetect substituted by MDL/2. The excess lifetime cancer risk (dimensionless) was determined by multiplying the TEQ (BaP) by fish consumption rate (average, 0.73 g kg−1 d−1; and high, 2.2 g kg−1 d−1) [35] and the BaP oral cancer slope factor (7.3 per mg kg−1 d−1) [33]. Because fish fillets were not analyzed, PAH concentrations in fish muscles were estimated from the whole fish data using literature estimates of the tissue distribution of PAHs in fish and fish organ weights (Supplemental Data, Table S2).
RESULTS AND DISCUSSION
Fish characteristics
Fish weights were similar across site and season, but females weighed more than males at sites 1 and 2 in fall 2011 (t test; p <0.01 at sites 1 and 2; p =0.60 at site 3), and females remained slightly, but not significantly, heavier in spring 2012 (Supplemental Data, Table S3). The fall samples were collected just before spawning, and all females but 1 contained large amounts of eggs. Fish collected at site 3 were slightly but not significantly heavier than fish at other sites, and weights varied considerably (1205–6214 g), which likely masked differences attributable to sex.
The lipid content of the lake trout did not differ by sex, site, or season (Supplemental Data, Table S3). In similarly sized lake trout (average, 639 mm in length) collected from Lake Ontario in 1986 [36], lipid content also did not vary by sex. However, lipid levels in lake trout collected in 1992 from Lake Michigan were considerably higher (17.9 ± 0.4%) [24] than those in the present study (14.9 ± 3.1%). Fish in the present study may have had a low-lipid diet, such as a diet abundant in relatively lean rainbow smelt and poor in fatty alewives [37]. The decline in Diporeia abundance in Lake Michigan likely has lowered the lipid content of prey fish, leading to decreased lipid content of lake trout and other predatory salmonids [37]. We did not observe the fall season decline in lipid content previously observed in Lake Michigan lake trout [37], possibly a result of dietary changes, the variation in the size of our fish (coefficient of variation in length =8% vs 1.8% in the cited study), or sample size issues.
Whole fish: PAHs
Nine of the 16 target PAHs were found above MDLs in more than 30% of the whole fish samples. The Σ9PAH concentrations averaged 546 ± 244 pg/g wet weight (n =74) and varied over an 8-fold range among individual fish. Site means by season and sex ranged from 350 pg/g to 819 pg/g wet weight (Figure 2A), but differences between season, sex, and site were insignificant or marginally significant, probably because of the large variation among individual fish and the relatively small sample size. Two- and 3-ring compounds (e.g. phenanthrene, acenaphthylene, naphthalene, and acenaphthene) were most abundant; abundances of 4- or 5-ring compounds did not exceed 4% (Figure 3). The PAH abundances did not vary by site, sex, or season (Kruskal-Wallis and Wilcoxon tests). The fluoranthrene/ pyrene ratio, an indicator of atmospheric transport distance that tends to increase at remote sites as pyrene undergoes more photo-oxidation [38], was 6.3 ± 10.3, 1.1 ± 1.1, and 2.0 ± 3.5 at the Charlevoix, Clay Banks, and Waukegan sites, respectively. Differences between Charlevoix and Clay Banks sites (Mann-Whitney U test, p =0.001) and between Charlevoix and Waukegan sites were significant (Mann-Whitney U test, p =0.004), and reflect the proximity of the Clay Banks and Waukegan sites to major PAH sources near Green Bay and southwestern Lake Michigan, respectively (Figure 1).
Figure 2.

Concentrations of (A) Σ9PAHs, (B) Σ9NPAHs, (C) Σ5steranes, and (D) Σ2hopanes in whole fish (pg/g wet wt). Data presented are mean ± standard deviation. PAH =polycyclic aromatic hydrocarbon; NPAH =nitro-PAH; Σ5steranes = sum of 5 detected steranes; Σ2hopanes = sum of 2 detected hopanes. [Color figure can be viewed in the online issue which is available at wileyonlinelibrary.com]
Figure 3.
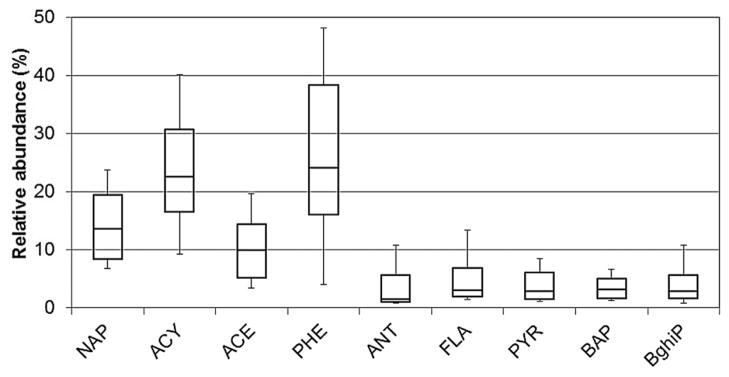
Polycyclic aromatic hydrocarbon (PAH) profiles in whole fish. Boxplots show 10th, 25th, 50th, 75th, and 90th percentiles for pooled samples. Only compounds with greater than 30% detection frequency are shown. Acronyms of PAHs can be found in Supplemental Data, Table S1.
A 1991 study of PAHs in Lake Michigan lake trout found Σ27PAH levels of 1.52 ± 0.38 ng/g wet weight and slightly less (1.47 ± 0.4 ng/g wet wt) for the 16 target PAHs in the present study [23]. The average PAH concentration in the present study is 63% lower. The lower concentrations can be explained by declining environmental levels. For example, PAH concentrations and accumulation rates in Lake Michigan sediments have been falling since 1980 [10], as have airborne concentrations in Chicago between 1996 and 2004 [19]. Also, fish in the earlier study were caught near-shore at Pentwater and close to 2 contaminated areas of concern, White Lake and Muskegon Lake, that may have had higher PAH levels [23]. In contrast, fish in the present study were caught in open water areas distant from contaminant sources.
The ΣPAH concentrations in the Great Lakes food web generally decrease at higher trophic levels (Table 1). Concentrations in aquatic invertebrates are approximately 100 ng/g to 1000 ng/g [3,39,40], levels in bottom-feeding fish are 10 ng/g to 100 ng/g [4,41,42]; and levels in top predator fish such as lake trout are 1 ng/g to 10 ng/g [23]. This trend is consistent with the “biodilution” of PAHs observed in marine organisms [43] and results from the rapid metabolism of PAHs by fish [43] and the lack of effective oxidative enzyme systems in aquatic invertebrates [44]. Whereas PAH concentrations in fish are low, PAH metabolites such as benzo[a]pyrene-7,8-dihydrodiol, 1-hydroxy benzo[a]pyrene, 3-hydroxy benzo[a]pyrene, 1-pyrenol, fluorenols, fluoranthenols, phenanthrols, and phenan-threne-9,10-diol may persist in fish tissues [45]. The toxicological importance of these metabolites has been suggested by their association with hepatic lesions and liver neoplasms found in English sole from Puget Sound [46].
Table 1.
Total concentrations of polycyclic aromatic hydrocarbons (ΣPAHs) reported for Great Lakes biota
| Species | Location | No. of PAHs measured | ΣPAH concentrations (ng/g wet wt)a | Reference |
|---|---|---|---|---|
| Fish | ||||
| Lake trout | Lake Michigan | 16 USEPA priority | Male: 0.56 ± 0.29 Female: 0.53± 0.18 Eggs: 0.30 ± 0.11 |
The present study |
| Lake trout | Lake Michigan Lake Superior |
27 27 |
Lean: 1.52 ± 0.38 Fat/siscowet: 6.34 ± 0.94 |
[23] |
| Minnow | Calumet region of southwestern Lake Michigan | 15 (16 USEPA priority excluding NAP) | 10–350 (range) | [32] |
| Sunfish | Calumet region of southwestern Lake Michigan | 15 (16 USEPA priority excluding NAP) | 10–80 (range) | [32] |
| Alewife | Calumet region of southwestern Lake Michigan | 15 (16 USEPA priority excluding NAP) | 15–1064 (range) | [32] |
| Round goby | Calumet region of southwestern Lake Michigan | 15 (16 USEPA priority excluding NAP) | 55 (mean) | [32] |
| Yellow perch | Calumet region of southwestern Lake Michigan | 15 (16 USEPA priority excluding NAP) | 20 (mean) | [32] |
| Crayfish | Calumet region of southwestern Lake Michigan | 15 (16 USEPA priority excluding NAP) | 10–130 (range) | [32] |
| White sucker | Upstream and downstream of the Moses-Saunders power damb | 33 (including 17 methyl PAHs) | Upstream: 16 ± 6 Downstream: 11 ± 6 |
[42] |
| Brown Bullhead | Lake Michigan tributaries St. Mary’s River tributary Lake Erie tributary |
5 5 5 |
20–24 (range) 24 (mean) 220 (mean) |
[41] |
| Invertebrates | ||||
| Amphipod: Pontoporeia hoyi | Lake Michigan | 7 | 4000–7000 (range) | [3] |
| Oligochaete worms | Lake Erie | 8 | 300–400 (range) | [3] |
| Chironomid midges | Lake Erie | 8 | 400–800 (range) | [3] |
| Bivalves: Zebra mussel | Detroit River and western Lake Erie | 16 USEPA priority | 12.6–8.7 (range) | [40] |
Data are given as mean ± standard deviation unless otherwise specified.
In St. Lawrence River, near Cornwall, Ontario, Canada, and Massena, New York, USA.
Polycyclic aromatic hydrocarbons in sediments in open water regions of Lake Michigan are dominated by atmospheric deposition in the southern basin of the lake, which results in large part from combustion sources in the southwestern area (e.g., Chicago, Milwaukee, and Gary); the waterborne contaminants are then transported and distributed throughout the lake [10]. As a result, sediments along a north–south transect of the open water showed fairly similar PAH concentrations and compositions [10]. Because tissue concentrations of PAHs in bottom prey fish are strongly related to sediment concentrations [4], and lake trout feed mostly on bottom prey fish [47], similar PAH levels among the lake trout at the 3 sampling sites were expected. The similar PAH concentrations in fish collected in the fall and spring seasons may reflect comparable atmospheric particle-phase PAH concentrations in these seasons [19], or the significance of the PAH reservoir in the sediments, which changes concentration only very slowly.
Contaminant levels in fish reflect a balance between uptake from the water column, diet and sediments, metabolism, partitioning, and elimination. These processes can vary greatly by compound. For example, the predominance of phenanthrene reflects its high concentrations in water [48], prey fish [4], and sediments [49], as well as its relatively slow metabolism (or clearance) in fish (half-life of phenanthrene =2.55 d; Supplemental Data, Table S1). The abundance of other 2- to 3-ring compounds, such as naphthalene and acenaphthylene, likely reflects uptake from the water through the gills because of their greater concentration in water [48] and the relatively slow metabolism (half-lives of 4.53 d and 3.73 d, respectively). Although its concentration in water was also relatively high [48], acenaphthene’s fast metabolism in fish (half-life of 0.25 d) will lower levels in lake trout. The relatively low fluoranthene levels in lake trout compared with prey fish [32] could result from its low bioavailability in the diet or low assimilation efficiency. Despite pyrene’s high concentrations in water [48] and sediment [49], low levels in lake trout and other fish [4] can be explained by rapid biotransformation (half-life of 0.56 d). The low levels of higher-molecular-weight PAHs, such as BaP and benzo[g, h, i]perylene, may reflect lower gill uptake and lower concentrations in water [48]. However, ingestion of sediments (bottom or suspended) can also contribute to PAH uptake. Although sediments were relatively abundant in higher-molecular-weight PAHs [10], concentrations of these PAHs in fish may be low because of low gut assimilation efficiency and higher metabolism rates (e.g., short half-lives for BaP and benzo[g, h, i]perylene; Supplemental Data, Table S1), which is also reflected in a small biota–sediment accumulation factors at high octanol–water partition coefficient (KOW) [50].
Whole fish: Nitro-PAHs
Nine of the 11 target NPAHs were detected in at least 30% of the samples. The Σ9NPAH concentrations are presented in Figure 2B and Supplemental Data, Table S5. The Σ9NPAH concentrations in individual fish ranged from 0.2 pg/g to 31 pg/g wet weight, roughly 10 times to 1000 times lower than Σ15PAH concentrations. Like the PAHs, Σ9NPAH concentrations did not differ by sex. Site differences were seen only in fall 2011, when Σ9NPAHs concentrations at the Waukegan site (0.39 ± 0.10 pg/g wet wt) were lower than those at other sites. Seasonal differences were significant but inconsistent for all site–sex combinations excluding Charlevoix females and Clay Banks males. The Σ9NPAH and Σ9PAH concentrations were not significantly correlated (Spearman r =−0.08, p =0.499, n =74).
The most abundant NPAH compounds were 3-nitrobiphenyl and 2-nitrobiphenyl, each contributing 14% and 23% (median) of the Σ9NPAH, respectively (Supplemental data, Figure S1); 1-nitronaphthalene, 2-nitronaphthalene, 1-nitropyrene, and 6-nitrochrysene had similar abundances. For most of the NPAH compounds, abundances varied by site in the fall, whereas abundances in the spring were similar (Kruskal-Wallis test; Figure 4).
Figure 4.

Mean relative abundance of each nitro-polycyclic aromatic hydrocarbon (NPAH) compound (A) in the fall and (B) in the spring for whole fish. Only compounds with greater than 30% detection frequency are shown. Acronyms of NPAHs can be found in Supplemental Data, Table S1. [Color figure can be viewed in the online issue which is available at wileyonlinelibrary.com]
Several studies have reported NPAH concentrations in the low nanogram per gram range in both freshwater and marine sediments around the world [51,52], including our measurements in southern Lake Michigan sediments [49]. However, information regarding NPAH concentrations in aquatic biota is scarce. One study reported ΣNPAH concentrations from 380 pg/g to 4100 pg/g wet weight in mussels and from 430 pg/g to 4300 pg/g wet weight in oysters in Osaka Bay, Japan [11] (calculated from pg/g dry wt reported and a moisture content of 85% [53]), levels that were approximately 10 times to 100 times lower than ΣPAH concentrations reported in those mussels and oysters [11]. We found similar or greater ratios in lake trout. The NPAH levels are anticipated to be low relative to PAH levels given the large differences in atmospheric levels [54], engine exhaust [25], and sediments [49]. However, NPAH concentrations can be altered because of reactions during atmospheric transport, abiotic loss in the water column, biodegradation in sediments, biotransformation in fish, fish behavior, and possibly endogenous formation. Thus, concentrations in fish will not be proportional to atmospheric concentrations or emission rates.
The low NPAH concentrations at the Waukegan site in the fall might have resulted from lake trout’s homing behavior. Lake trout return to the same site during the fall spawning season but occupy a larger area where fish from different spawning stocks will mix during the remainder of the year [55]. In the fall samples, the lake trout collected at the Waukegan site likely belonged to a single local spawning stock, given the proximity of Julian’s Reef, a major spawning site [56]. In contrast, the spring sample probably reflected a mixed sample with individuals from other spawning stocks, resulting in similar average concentrations across the 3 sites. Homing behavior might also explain the similar NPAH profiles across sites in spring (Figure 4B) but not fall seasons (Figure 4A).
As noted, the highly urbanized and industrial areas around the Waukegan site near southwestern Lake Michigan contain many PAH and NPAH sources. Although these emissions would be diluted during transportation to the Charlevoix and Clay Banks sites, additional NPAH formation is expected given the longer atmospheric transport time compared with the Waukegan site. Unfortunately, atmospheric concentrations of NPAHs in the Great Lakes region have not been reported. At 3 sites in downtown and suburban Kanazawa, Japan, NPAH levels were higher in winter than summer; patterns were inconsistent in fall and spring [57]. In Los Angeles, California, USA, atmospheric NPAH levels were higher in the summer [26]. These studies may have only limited relevance to the Great Lakes region. In addition, nearby sources and other factors may affect local water, sediment, and food concentrations.
The NPAH concentrations in lake trout result from atmospheric levels and deposition, levels accumulated in sediment, uptake, metabolism, and elimination processes. Information regarding NPAHs in sediments is limited, but it includes a report for marine sediments in Japan [52] and our results for southern Lake Michigan [49]. Abundances of individual NPAHs in lake trout are compared with those in biota, sediment, ambient air, and diesel engine exhaust reported in the literature (Figure 5). Abundances of 1-nitronaphthalene and 2-nitronaphthalene in lake trout (~10%) were low compared with the abundances in both diesel exhaust[25] and the atmosphere [54], likely reflecting the rapid clearance of these compounds relative to other NPAHs (Supplemental Data, Table S1). Much higher abundances of 1-nitronaphthalene and 2-nitronaphthalene (30%–50%) were found in mussels and oysters from Osaka Bay, Japan [11], again highlighting the effects of clearance rates. 2-Nitrobiphenyl and 3-nitrobiphenyl show a different pattern, with high abundances (15%–25%) in lake trout, probably reflecting slow metabolism (Supplemental Data, Table S1). Although these 2 compounds have not been detected in Lake Michigan sediments [49], they may be taken up by lake trout from the water column given their relatively low KOW (Supplemental Data, Table S1). Two other NPAHs, 1-nitropyrene and 6-nitrochrysene, had low abundances in lake trout (10–15%) and bivalves [11] compared with sediments (30–40% [49]; Figure 5), probably a result of rapid clearance in fish and possibly other biota (Supplemental Data, Table S1). Sampling across major ecosystem compartments, such as water, sediments, and across the food web, is needed to confirm the sources and mechanisms affecting levels of individual NPAH species.
Figure 5.
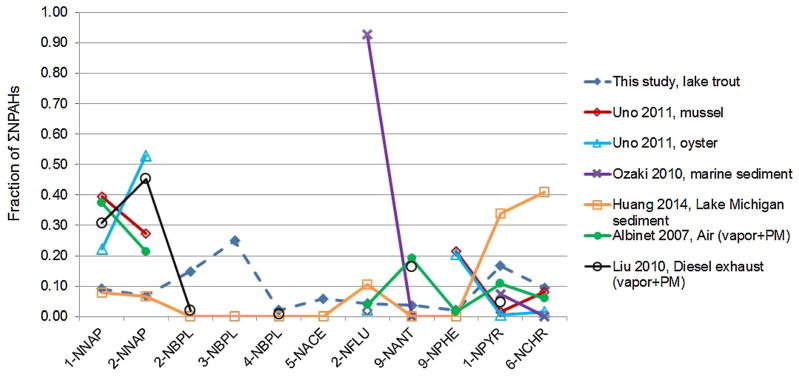
Comparison between the present study’s nitro-polycyclic aromatic hydrocarbon (NPAH) profile (dashed line) and profiles in literature. Acronyms of NPAHs can be found in Supplemental Data, Table S1. [Color figure can be viewed in the online issue which is available at wileyonlinelibrary.com]
Whole fish: Steranes and hopanes
Five of the 6 target steranes were detected in more than 30% of the samples. Only 2 hopanes, 17α(H),21β(H)-hopane and 17α(H),21β(H)-30-norhopane, had a detection frequency above 30% in the fall, but they were not detected in any sample in the spring. The Σ2hopane and Σ5sterane concentrations are presented in Figures 2C and 2D, respectively. In fall 2011, Σ5sterane concentrations averaged 269 ± 111 pg/g wet weight (range, 167–808 pg/g wet wt in individual fish), whereas Σ2hopane concentrations averaged 37 ± 23 pg/g wet weight (11–141 pg/g wet wt). In spring 2012, sterane and hopane concentrations fell 10-fold. Like PAHs and NPAHs, no differences by sex were noted for either Σ5sterane or Σ2hopane levels. In fall 2011, both Σ5sterane and Σ2hopane showed the same spatial trend: Charlevoix <Clay Banks <Waukegan; and concentrations of both groups of compounds at the Waukegan site were significantly higher than those at the Charlevoix site (Mann-Whitney U test; p <0.001). This trend disappeared in spring 2012. The relative abundances of the 5 detected steranes were similar across season, site, and sex. The most abundant steranes were 20S-5α(H),14α(H),17α(H)-cholestane and 20R-5α(H), 14β(H),17β(H)-24-ethylcholestane, averaging 36 ± 13% and 42 ± 18%, respectively. Abundances of the other 3 detected steranes were between 5% and 10%. In the fall, the abundances of the 2 detected hopanes (17α[H],21β[H]-hopane, and 17α[H],21β[H]-30-norhopane) were also consistent across site and sex, averaging 65 ± 10% and 35 ± 10%, respectively.
Two studies pertain to steranes and hopanes in aquatic biota. Concentrations of Σhopanes in aquaculture fish (red fish, grouper, tiger grouper, pomfret) in the Strait of Malacca were high, 17 ng/g to 250 ng/g wet weight (calculated from ng/g dry wt), possibly reflecting the extensive offshore oil and gas extraction and ocean shipping in this region [14]. In the second study, concentrations of total biomarkers (10 hopanes and 6 steranes) ranged from undetected to 10 ng/g wet weight (calculated from ng/g dry wt) in arctic amphipods (Anonyx nugax) in the Alaskan Beaufort Sea [15]. These concentrations, which should not be affected by offshore oil and gas activities [15], are comparable to levels measured in Lake Michigan lake trout.
As noted, steranes and hopanes enter the environment primarily from pyrogenic (for example, traffic) and petrogenic (e.g., crude oil, asphalt, and gasoline) sources. The Chicago/ Gary area mentioned is a primary source area for steranes and hopanes for Lake Michigan, and southwesterly winds are common, especially in the fall [58]. The decrease in sterane and hopane concentrations with distance from the Chicago/Gary area (Waukegan site to Charlevoix site) in fall 2011 suggests the significance of this source. Much lower sterane and hopane levels in spring 2012 might result from changes in SVOC loadings to Lake Michigan, fish uptake and diet, and possibly fish metabolism.
Hopane and sterane profiles measured in Lake Michigan sediments [49] show the predominance of 17α(H),21β(H)-hopane, as seen in lake trout. However, Σ6sterane concentrations in the sediment were lower than Σ5hopane levels; the opposite was seen in lake trout. This pattern does not appear to result from metabolism in fish, because the estimated half-life in fish of 20R-5α(H),14α(H),17α(H)-cholestane (only half-life available for steranes) is shorter than that for all 5 target hopanes (Supplemental Data, Table S1). Microbial biodegradation may play a role given the long biodegradation half-life of 20R-5α (H),14α(H),17α(H)-cholestane (1662 d) relative to the 5 target hopanes (799–1249 d) [59]. Levels in lake trout also might be driven by uptake by suspended particles and biota, in addition to sediment. The similar hopane and sterane compositions in the fish across season, site, and sex suggest the same sources. Moreover, the same compounds (17α[H],21β[H]-hopane, and 20S-5α[H],14α[H],17α[H]-cholestane) were most abundant in both fish and diesel engine exhaust [25]. The presence of these petroleum biomarkers in Lake Michigan lake trout is consistent with traffic-related emissions that are deposited in the lake and accumulated by aquatic biota.
SVOCs in eggs
Female fish presented eggs in the fall spawning season. Fewer PAH compounds were detected in the eggs than in the whole fish. Of the 9 PAHs detected in more than 30% of whole fish samples, anthracene and fluoranthene were not detected in more than 30% of the egg samples (Supplemental Data, Table S1). The Σ7PAH concentration in the 15 egg samples ranged from 99 pg/g to 527 pg/g wet weight. (Averages by site are presented in Supplemental Data, Table S4.) The Σ7PAH concentrations in eggs were significantly lower than the Σ9PAH concentrations in the corresponding female fish (paired t test, t =4.08, df =14, p =0.001). Similar patterns have been observed for PCBs in lake trout from Lake Ontario; concentrations in gonads were 4-fold lower than those in female whole fish [36]. The PAH profiles in eggs also differed from those in whole fish, where the abundance of phenanthrene was very low (Supplemental Data, Figure S2).
Compared with whole fish, 2 additional NPAH compounds were detected in eggs in more than 30% of samples; that is, all 11 target NPAHs were detected in eggs (Supplemental Data, Table S1). The Σ11NPAH concentration in the 15 egg samples ranged from 0.81 pg/g to 130 pg/g wet weight. (Site averages are presented in Supplemental Data, Table S5.) The Σ11NPAH concentrations in eggs were higher than the Σ9NPAH concentrations in the corresponding female fish, and differences are marginally significant (paired t test, t =−1.94, df =14, p =0.072). The NPAH profiles in eggs resembled those in whole fish (Supplemental Data, Figure S3).
Eggs contained the same steranes and hopanes detected in whole fish. The Σ5Sterane and Σ2hopane concentration in the eggs ranged from 204 pg/g to 493 pg/g wet weight and 10 pg/g to 119 pg/g wet weight, respectively. (Site averages are presented in Supplemental Data, Table S6.) The Σ5Sterane and Σ2hopane concentrations in the eggs did not differ significantly from those in female fish, and abundances of individual compounds were also similar.
Screening level risk estimates
For the average scenario, using only the compounds detected in more than 30% of whole fish samples and adjusting from whole fish to muscle tissue (see Data Analysis), the average TEQ from PAHs and NPAHs combined was 25 pg/g (19 pg/g from PAHs, 6 pg/g from NPAHs). Based on an oral cancer slope factor of 7.3 per mg/kg/d [60], and average (0.73 g/kg/d) and high (2.2 g/kg/d) fish consumption rates [61], consumption of lake trout from Lake Michigan gives lifetime cancer risks of 0.13 per million and 0.40 per million. For the worst-case scenario, considering all target compounds (regardless of detection frequency), the average muscle TEQ from PAHs and NPAHs combined is 516 pg/g (510 pg/g from PAHs and 6 pg/g from NPAHs), and the resulting cancer risks are 2.7 per million and 8.3 per million. The difference is largely attributable to dibenzo[a, h] anthracene, which was detected in only 1.2% of the samples but which has a toxic equivalent factor of 10 (Supplemental Data, Table S1). Even in the worst-case scenario, calculated risks fell within the upper range of protective risk guidelines, 1 per million to 10 per million; the total TEQ (averaged, 516 pg/g) also fell below the Canadian limit of 1 ng/g BaP to 4 ng/g BaP for fish and shellfish established to protect consumers from adverse health effects [62]. However, these calculations involve several uncertainties. First, several toxic equivalent factors have been reported for certain PAH compounds, and some differ by several orders of magnitude [33]. Using the highest toxic equivalent factor values [33] and the worst-case scenario, the average PAH TEQ was 1949 pg/g (range, 1763 pg/g to 3389 pg/g) in our sample (fish muscles), which exceeds the Canadian limits. Second, the oral cancer slope factor for BaP ranges from 4.5 per mg/kg/d to 11.7 per mg/kg/d (median, 7.3 per mg/kg/d) [60]. Combining these variables and using a high fish consumption rate (2.2 g/kg/d), the highest possible risk associated with lake trout consumption is 87 per million, well above guidelines. Moreover, because many NPAHs lack toxic equivalent factors and not all NPAHs were measured; the risk estimates may be underestimated. Even in the present study’s calculations, which included only the 4 NPAHs with available toxic equivalent factor values, NPAHs contributed a significant portion (40–80%) of the TEQs in some samples (under the average scenario).
Because of their rapid metabolism and resulting low concentrations, PAHs and NPAHs in lake trout may pose minimal human health risks, in contrast to risks resulting from the biomagnification of contaminants such as PCBs and mercury in Great Lakes fish [22,63]. Still, the NPAH risk estimates presented may be underestimated, and additional toxicology studies and environmental measurements appear warranted. In addition, PAH exposure has been associated with immunosuppression, decreased growth, and DNA damage in juvenile salmon collected in Puget Sound at stomach content concentrations from 4000 ng/g to 15 000 ng/g wet weight for total PAHs (16 USEPA priority PAHs plus 5 alkylated PAHs) [64]. Although we did not collect data regarding juvenile fish or analyze stomach contents separately, these concentrations are 3 to 4 orders of magnitude higher than levels (223–1704 pg/g wet wt) we measured in whole adult fish from Lake Michigan (which included stomach contents). Although adverse effects seem unlikely, an analysis of fish health should focus on susceptible life stages and key target tissues.
Strengths and limitations
The present study has several strengths. First, a wide range of SVOCs was examined, and this appears to be the first reporting of NPAH concentrations in fish. Second, fish were collected during 2 seasons, which allowed a comparison between spawning and non-spawning seasons. Third, because measurements used whole-fish homogenates, and eggs from female fish in the spawning season were separated and measured, whole-fish body burdens without the influence of eggs were determined. Finally, although the literature is sparse, many of our results are consistent with earlier reports.
However, the present study also has several limitations. First, only selected PAHs were measured. Investigation of PAH metabolites, because of their possible persistence and toxicity, is warranted. Second, organ-specific analyses were not attempted. The PAH concentrations are higher in fish liver and bile and lower in muscles [45]. This also may be the case for NPAHs, steranes, and hopanes. Because most fish mass was muscle, concentrations were low in whole-fish homogenates, which may have decreased detection rates of some compounds. Third, individual samples rather than composite samples were used, but this highlights fish-to-fish variation. Finally, the small number of samples in each season-site-sex group did not allow some statistical analyses, such as repeated measure analysis of variance.
CONCLUSIONS
The present study demonstrates the accumulation of PAHs, NPAHs, steranes, and hopanes in lake trout from Lake Michigan, and provides the first report of the occurrence of NPAHs in freshwater fish. In whole fish, ΣPAH concentrations averaged 546 ± 244 pg/g wet weight, and levels were similar across season and site. These low concentrations suggest biodilution of PAHs in lake trout. The ΣNPAH concentrations averaged 7.2 ± 7.0 pg/g, and fish behavior, specifically spawning, seems to affect the seasonal patterns of NPAH concentrations. Sterane and hopane concentrations were 2 times to 20 times lower than PAH levels and differed by season, which might be attributed to substantial differences in uptake or clearance rates. Spatial differences also were seen for steranes and hopanes in fall, indicating the impact of sources in the Chicago/Gary area. No difference by sex was observed for the target SVOCs.
Of fish collected in the fall, all but 1 contained eggs. The NPAH, steranes, and hopane levels in the eggs were similar to those in the corresponding female fish, but significantly lower for PAHs.
Upper-bound worst-case estimates of lifetime human cancer risks attributable to lake trout consumption exceeded 10 per million, but PAHs and NPAHs in lake trout generally seem to pose a minimum threat to human health. However, NPAHs contributed a significant portion of the toxicity in some samples, and the risks from NPAHs were probably underestimated. Thus, further assessment of NPAH contamination in Great Lakes fish, and the effects on fish and ecological health, is warranted.
Supplementary Material
Figure S1. NPAH profiles in whole fish. Boxplots show 10th, 25th, 50th, 75th and 90th percentiles for pooled samples. Only compounds with >30% detection frequency are shown. Acronyms of NPAHs can be found in Supplemental Data, Table S1.
Figure S2. PAH profiles in eggs. The points show averages, and the whiskers show maximum and minimum for pooled samples (N = 17 including replicates). Only compounds with >30% detection frequency are shown.
Figure S3. NPAH profiles in eggs. The points show averages, and the whiskers show maximum and minimum for pooled samples (N = 17 including replicates). Only compounds with >30% detection frequency are shown.
Acknowledgments
The authors thank the Michigan Department of Natural Resources, Illinois Department of Natural Resources, and Wisconsin Department of Natural Resources for collection of lake trout samples. We also thank L. Begnoche and C. Madenjian at USGS GLSC for providing the equipment and workplace for fish storage and grinding, as well as D. Sun, M. Lala, and H. Elasaad for helping with the processing and analysis of fish samples. The present study was supported in part by USEPA grant GL00E00690-0, entitled “PAHs, Nitro-PAHs & Diesel Exhaust Toxics in the Great Lakes: Apportionments, Impacts and Risks.”
Footnotes
All Supplemental Data may be found in the online version of this article.
References
- 1.Crane JL, Grosenheider K, Wilson CB. Contamination of stormwater pond sediments by polycyclic aromatic hydrocarbons (PAHs) in Minnesota: The role of coal tar-based sealcoat products as a source of PAHs. Minnesota Pollution Control Agency; St. Paul, MN, USA: 2010. [Google Scholar]
- 2.Logan DT. Perspective on ecotoxicology of PAHs to fish. Hum Ecol Risk Assess. 2007;13:302–316. [Google Scholar]
- 3.Eadie BJ, Landrum PF, Faust W. Polycyclic aromatic hydrocarbons in sediments, pore water and the amphipod Pontoporeia hoyi from Lake Michigan. Chemosphere. 1982;11:847–858. [Google Scholar]
- 4.Levengood JM, Schaeffer DJ. Polycyclic aromatic hydrocarbons in fish and crayfish from the Calumet region of southwestern Lake Michigan. Ecotoxicology. 2011;20:1411–1421. doi: 10.1007/s10646-011-0698-x. [DOI] [PubMed] [Google Scholar]
- 5.Yang X, Baumann PC. Biliary PAH metabolites and the hepatosomatic index of brown bullheads from Lake Erie tributaries. Ecological Indicators. 2006;6:567–574. [Google Scholar]
- 6.Koza RA, Moore MJ, Stegeman JJ. Elevated ornithine decarboxylase activity, polyamines and cell proliferation in neoplastic and vacuolated liver cells of winter flounder (Pleuronectes americanus) Carcinogenesis. 1993;14:399–405. doi: 10.1093/carcin/14.3.399. [DOI] [PubMed] [Google Scholar]
- 7.Tokiwa H, Nakagawa R, Horikawa K, Ohkubo A. The nature of the mutagenicity and carcinogenicity of nitrated, aromatic compounds in the environment. Environ Health Perspect. 1987;73:191–199. doi: 10.1289/ehp.8773191. [DOI] [PMC free article] [PubMed] [Google Scholar]
- 8.Perrini G, Tomasello M, Librando V, Minniti Z. Nitrated polycyclic aromatic hydrocarbons in the environment: Formation, occurrences and analysis. Ann Chim. 2005;95:567–577. doi: 10.1002/adic.200590066. [DOI] [PubMed] [Google Scholar]
- 9.Shailaja M, Rajamanickam R, Wahidulla S. Formation of genotoxic nitro-PAH compounds in fish exposed to ambient nitrite and PAH. Toxicol Sci. 2006;91:440–447. doi: 10.1093/toxsci/kfj151. [DOI] [PubMed] [Google Scholar]
- 10.Simcik MF, Eisenreich SJ, Golden KA, Liu S-P, Lipiatou E, Swackhamer DL, Long DT. Atmospheric loading of polycyclic aromatic hydrocarbons to Lake Michigan as recorded in the sediments. Environ Sci Technol. 1996;30:3039–3046. [Google Scholar]
- 11.Uno S, Tanaka H, Miki S, Kokushi E, Ito K, Yamamoto M, Koyama J. Bioaccumulation of nitroarenes in bivalves at Osaka Bay, Japan. Mar Poll Bull. 2011;63:477–481. doi: 10.1016/j.marpolbul.2011.02.044. [DOI] [PubMed] [Google Scholar]
- 12.Ourisson G, Rohmer M. Hopanoids. 2. Biohopanoids: A novel class of bacterial lipids. Accounts Chem Res. 1992;25:403–408. [Google Scholar]
- 13.Ourisson G, Rohmer M, Poralla K. Prokaryotic hopanoids and other polyterpenoid sterol surrogates. Annu Rev Microbiol. 1987;41:301–333. doi: 10.1146/annurev.mi.41.100187.001505. [DOI] [PubMed] [Google Scholar]
- 14.Manan N, Raza M, Yuh YS, Theng LW, Zakaria MP. Distribution of petroleum hydrocarbons in aquaculture fish from selected locations in the Straits of Malacca, Malaysia. World Applied Sciences Journal. 2011;14:14–21. [Google Scholar]
- 15.Neff JM, Durell GS. Bioaccumulation of petroleum hydrocarbons in arctic amphipods in the oil development area of the Alaskan Beaufort Sea. Integr Environ Assess Manag. 2012;8:301–319. doi: 10.1002/ieam.1247. [DOI] [PubMed] [Google Scholar]
- 16.Kleeman MJ, Riddle SG, Robert MA, Jakober CA. Lubricating oil and fuel contributions to particulate matter emissions from light-duty gasoline and heavy-duty diesel vehicles. Environ Sci Technol. 2008;42:235–242. doi: 10.1021/es071054c. [DOI] [PubMed] [Google Scholar]
- 17.Hickey J, Batterman SA, Chernyak S. Trends of chlorinated organic contaminants in Great Lakes trout and walleye from 1970 to 1998. Arch Environ Contam Toxicol. 2006;50:97–110. doi: 10.1007/s00244-005-1007-6. [DOI] [PubMed] [Google Scholar]
- 18.Chang F, Pagano JJ, Crimmins BS, Milligan MS, Xia X, Hopke PK, Holsen TM. Temporal trends of polychlorinated biphenyls and organochlorine pesticides in Great Lakes fish, 1999–2009. Sci Total Environ. 2012;439:284–290. doi: 10.1016/j.scitotenv.2012.09.019. [DOI] [PubMed] [Google Scholar]
- 19.Sun P, Blanchard P, Brice KA, Hites RA. Trends in polycyclic aromatic hydrocarbon concentrations in the Great Lakes atmosphere. Environ Sci Technol. 2006;40:6221–6227. doi: 10.1021/es0607279. [DOI] [PubMed] [Google Scholar]
- 20.Christensen ER, Arora S. Source apportionment of PAHs in sediments using factor analysis by time records: Application to Lake Michigan, USA. Water Res. 2007;41:168–176. doi: 10.1016/j.watres.2006.09.009. [DOI] [PubMed] [Google Scholar]
- 21.Madenjian CP, Fahnenstiel GL, Johengen TH, Nalepa TF, Vanderploeg HA, Fleischer GW, Schneeberger PJ, Benjamin DM, Smith EB, Bence JR. Dynamics of the Lake Michigan food web, 1970–2000. Can J Fish Aquat Sci. 2002;59:736–753. [Google Scholar]
- 22.Zananski TJ, Holsen TM, Hopke PK, Crimmins BS. Mercury temporal trends in top predator fish of the Laurentian Great Lakes. Ecotoxicology. 2011;20:1568–1576. doi: 10.1007/s10646-011-0751-9. [DOI] [PubMed] [Google Scholar]
- 23.Zabik ME, Booren A, Zabik MJ, Welch R, Humphrey H. Pesticide residues, PCBs and PAHs in baked, charbroiled, salt boiled and smoked Great Lakes lake trout. Food Chem. 1996;55:231–239. [Google Scholar]
- 24.De Vault DS, Hesselberg R, Rodgers PW, Feist TJ. Contaminant trends in lake trout and walleye from the Laurentian Great Lakes. J Great Lakes Res. 1996;22:884–895. [Google Scholar]
- 25.Liu ZG, Berg DR, Vasys VN, Dettmann ME, Zielinska B, Schauer JJ. Analysis of C1, C2, and C10 through C33 particle-phase and semi-volatile organic compound emissions from heavy-duty diesel engines. Atmos Environ. 2010;44:1108–1115. [Google Scholar]
- 26.Reisen F, Arey J. Atmospheric reactions influence seasonal PAH and nitro-PAH concentrations in the Los Angeles basin. Environ Sci Technol. 2005;39:64–73. [PubMed] [Google Scholar]
- 27.Qu W, Xue B, Su C, Wang S. Evaluation of biogenic and anthropogenic inputs of aliphatic hydrocarbons to Lake Taihu sediments using biomarkers. Hydrobiologia. 2007;581:89–95. [Google Scholar]
- 28.US Environmental Protection Agency. Appendix A: 126 Priority Pollutants. 40 CFR Part 423. Fed Reg. 1982;40:653–654. [Google Scholar]
- 29.National Institute of Standards and Technology. Certificate of SRM 2266—Hopanes and Steranes in 2,2,4 Trimethylpentane. 2010 [cited 2014 May 20]. Available from: https://www-s.nist.gov/srmors/view_-cert.cfm?srm=2266.
- 30.Huang L, Bohac SV, Chernyak SM, Batterman SA. Composition and integrity of PAHs, nitro-PAHs, hopanes, and steranes in diesel exhaust particulate matter. Water Air Soil Pollut. 2013;224:1–14. doi: 10.1007/s11270-013-1630-1. [DOI] [PMC free article] [PubMed] [Google Scholar]
- 31.Antweiler RC, Taylor HE. Evaluation of statistical treatments of left-censored environmental data using coincident uncensored data sets: I. Summary statistics. Environ Sci Technol. 2008;42:3732–3738. doi: 10.1021/es071301c. [DOI] [PubMed] [Google Scholar]
- 32.Levengood JM, Schaeffer DJ. Polycyclic aromatic hydrocarbons in fish and crayfish from the Calumet region of southwestern Lake Michigan. Ecotoxicology. 2011;20:1–11. doi: 10.1007/s10646-011-0698-x. [DOI] [PubMed] [Google Scholar]
- 33.US Environmental Protection Agency. Development of a relative potency factor (RPF) approach for polycyclic aromatic hydrocarbon (PAH) mixtures (external review draft) Washington, DC: 2010. [Google Scholar]
- 34.State of Rhode Island Department of Environmental Management. Rhode Island air toxics guideline. Providence, RI, USA: 2008. [Google Scholar]
- 35.US Environmental Protection Agency. Edition (Final) Washington, DC: 2011. Exposure Factors Handbook 2011. EPA 600/R-09/052F. [Google Scholar]
- 36.Madenjian CP, Keir MJ, Whittle DM, Noguchi GE. Sexual difference in PCB concentrations of lake trout (Salvelinus namaycush) from Lake Ontario. Sci Total Environ. 2010;408:1725–1730. doi: 10.1016/j.scitotenv.2009.12.024. [DOI] [PubMed] [Google Scholar]
- 37.Madenjian CP, Elliott RF, DeSorcie TJ, Stedman RM, O’Connor DV, Rottiers DV. Lipid concentrations in Lake Michigan fishes: Seasonal, spatial, ontogenetic, and long-term trends. J Great Lakes Res. 2000;26:427–444. [Google Scholar]
- 38.Zhang X, Christensen ER, Gin MF. Polycyclic aromatic hydrocarbons in dated sediments from Green Bay and Lake Michigan. Estuaries. 1993;16:638–652. [Google Scholar]
- 39.Eadie BJ, Faust W, Gardner WS, Nalepa T. Polycyclic aromatic hydrocarbons in sediments and associated benthos in Lake Erie. Chemosphere. 1982;11:185–191. [Google Scholar]
- 40.Metcalfe CD, Metcalfe TL, Riddle G, Douglas Haffner G. Aromatic hydrocarbons in biota from the Detroit River and western Lake Erie. J Great Lakes Res. 1997;23:160–168. [Google Scholar]
- 41.Baumann PC, Mac MJ, Smith SB, Harshbarger JC. Tumor frequencies in walleye (Stizostedion vitreum) and brown bullhead (Ictalurus nebulosus) and sediment contaminants in tributaries of the Laurentian Great Lakes. Can J Fisheries Aquat Sci. 1991;48:1804–1810. [Google Scholar]
- 42.Ridgway LL, Chapleau F, Comba ME, Backus SM. Population characteristics and contaminant burdens of the white sucker (Catostomus commersoni) from the St. Lawrence River near Cornwall, Ontario and Massena, New York. J Great Lakes Res. 1999;25:567–582. [Google Scholar]
- 43.Takeuchi I, Miyoshi N, Mizukawa K, Takada H, Ikemoto T, Omori K, Tsuchiya K. Biomagnification profiles of polycyclic aromatic hydrocarbons, alkylphenols and polychlorinated biphenyls in Tokyo Bay elucidated by delta C-13 and delta N-15 isotope ratios as guides to trophic web structure. Mar Poll Bull. 2009;58:663–671. doi: 10.1016/j.marpolbul.2008.12.022. [DOI] [PubMed] [Google Scholar]
- 44.Hahn ME, Poland A, Glover E, Stegeman JJ. Photoaffinity labeling of the Ah receptor: Phylogenetic survey of diverse vertebrate and invertebrate species. Arch Biochem Biophys. 1994;310:218–228. doi: 10.1006/abbi.1994.1160. [DOI] [PubMed] [Google Scholar]
- 45.Varanasi U, Stein JE. Disposition of xenobiotic chemicals and metabolites in marine organisms. Environ Health Perspect. 1991;90:93. doi: 10.1289/ehp.90-1519508. [DOI] [PMC free article] [PubMed] [Google Scholar]
- 46.Krahn MM, Rhodes LD, Myers MS, Moore LK, MacLeod WD, Jr, Malins DC. Associations between metabolites of aromatic compounds in bile and the occurrence of hepatic lesions in English sole (Parophrys vetulus) from Puget Sound, Washington. Arch Environ Contam Toxicol. 1986;15:61–67. doi: 10.1007/BF01055249. [DOI] [PubMed] [Google Scholar]
- 47.Madenjian CP, Desorcie TJ, Stedman RM. Ontogenic and spatial patterns in diet and growth of lake trout in Lake Michigan. Trans Am Fish Soc. 1998;127:236–252. [Google Scholar]
- 48.Offenberg JH, Baker JE. PCBs and PAHs in southern Lake Michigan in 1994 and 1995: Urban atmospheric influences and long-term declines. J Great Lakes Res. 2000;26:196–208. [Google Scholar]
- 49.Huang L, Chernyak SM, Batterman SA. PAHs (polycyclic aromatic hydrocarbons), nitro-PAHs, and hopane and sterane biomarkers in sediments of southern Lake Michigan, USA. Sci Total Environ. 2014;487:173–186. doi: 10.1016/j.scitotenv.2014.03.131. [DOI] [PMC free article] [PubMed] [Google Scholar]
- 50.Liang Y, Tse M, Young L, Wong M. Distribution patterns of polycyclic aromatic hydrocarbons (PAHs) in the sediments and fish at Mai Po Marshes Nature Reserve, Hong Kong. Water Res. 2007;41:1303–1311. doi: 10.1016/j.watres.2006.11.048. [DOI] [PubMed] [Google Scholar]
- 51.Lübcke-von Varel U, Bataineh M, Lohrmann S, Löffler I, Schulze T, Flückiger-Isler S, Neca J, Machala M, Brack W. Identification and quantitative confirmation of dinitropyrenes and 3-nitrobenzanthrone as major mutagens in contaminated sediments. Environ Int. 2012;44:31–39. doi: 10.1016/j.envint.2012.01.010. [DOI] [PubMed] [Google Scholar]
- 52.Ozaki N, Takemoto N, Kindaichi T. Nitro-PAHs and PAHs in atmospheric particulate matters and sea sediments in Hiroshima Bay Area, Japan. Water Air Soil Pollut. 2010;207:263–271. [Google Scholar]
- 53.He H, Adams R, Farkas D, Morrissey M. Use of high-pressure processing for oyster shucking and shelf-life extension. J Food Sci. 2002;67:640–645. [Google Scholar]
- 54.Albinet A, Leoz-Garziandia E, Budzinski H, ViIlenave E. Polycyclic aromatic hydrocarbons (PAHs), nitrated PAHs and oxygenated PAHs in ambient air of the Marseilles area (South of France): Concentrations and sources. Sci Total Environ. 2007;384:280–292. doi: 10.1016/j.scitotenv.2007.04.028. [DOI] [PubMed] [Google Scholar]
- 55.Schmalz PJ, Hansen MJ, Holey ME, McKee PC, Toneys ML. Lake trout movements in northwestern Lake Michigan. North American Journal of Fisheries Management. 2002;22:737–749. [Google Scholar]
- 56.Holey ME, Rybicki RW, Eck GW, Brown EH, Jr, Marsden JE, Lavis DS, Toneys ML, Trudeau TN, Horrall RM. Progress toward lake trout restoration in Lake Michigan. J Great Lakes Res. 1995;21:128–151. [Google Scholar]
- 57.Hayakawa K, Tang N, Akutsu K, Murahashi T, Kakimoto H, Kizu R, Toriba A. Comparison of polycyclic aromatic hydrocarbons and nitropolycyclic aromatic hydrocarbons in airborne particulates collected in downtown and suburban Kanazawa, Japan. Atmos Environ. 2002;36:5535–5541. [Google Scholar]
- 58.Illinois State Water Survey. Wind roses and wind frequency tables for Illinois, 1961–1990. 2009 [cited 2014 April 3]. Available from: http://www.isws.illinois.edu/atmos/statecli/roses/wind_climatology.htm.
- 59.US Environmental Protection Agency. Estimation Programs Interface Suite™ for Microsoft® Windows, Ver 4.11. Washington, DC: 2012. [Google Scholar]
- 60.US Environmental Protection Agency. Quantitative Estimate of Carcinogenic Risk from Oral Exposure FOR Benzo[a]pyrene (CASRN 50-32-8) Integrated Risk Information System; Washington DC: 1994. [Google Scholar]
- 61.US Environmental Protection Agency. Edition (Final) Washington, DC: 2011. Exposure Factors Handbook, 2011. [Google Scholar]
- 62.Ministry of Environment, Government of British Columbia. Ambient water quality criteria for polycyclic aromatic hydrocarbons (PAHs): Overview report. 2014 [cited 2014 April 1]. Available from: http://www.env.gov.bc.ca/wat/wq/BCguidelines/pahs/pahs_over.html.
- 63.Chiang H-L, Lai Y-M, Chang S-Y. Pollutant constituents of exhaust emitted from light-duty diesel vehicles. Atmos Environ. 2012;47:399–406. [Google Scholar]
- 64.Johnson LL, Ylitalo GM, Arkoosh MR, Kagley AN, Stafford C, Bolton JL, Buzitis J, Anulacion BF, Collier TK. Contaminant exposure in outmigrant juvenile salmon from Pacific Northwest estuaries of the United States. Environ Monit Assess. 2007;124:167–194. doi: 10.1007/s10661-006-9216-7. [DOI] [PubMed] [Google Scholar]
Associated Data
This section collects any data citations, data availability statements, or supplementary materials included in this article.
Supplementary Materials
Figure S1. NPAH profiles in whole fish. Boxplots show 10th, 25th, 50th, 75th and 90th percentiles for pooled samples. Only compounds with >30% detection frequency are shown. Acronyms of NPAHs can be found in Supplemental Data, Table S1.
Figure S2. PAH profiles in eggs. The points show averages, and the whiskers show maximum and minimum for pooled samples (N = 17 including replicates). Only compounds with >30% detection frequency are shown.
Figure S3. NPAH profiles in eggs. The points show averages, and the whiskers show maximum and minimum for pooled samples (N = 17 including replicates). Only compounds with >30% detection frequency are shown.