Abstract
Purpose
The aim of the study reported here was to assess the use of parenteral nutrition (PN) and enteral nutrition (EN), and the prevalence of PN and EN formulas, in the People’s Republic of China.
Methods
Fifty-nine hospitals in the People’s Republic of China participated in a nutrition survey. The resulting information on nutritional support was analyzed.
Results
We received 379,584 nutritional-support prescriptions over 40 days in 2013. PN provided approximately 63.2% and EN provided approximately 36.8% of nitrogen intake. PN provided 63.5% and EN provided 36.5% of lipid intake. There were obvious differences in nitrogen and lipid intake between PN and EN in different regions, departments, and diseases. The percentage of nourishment provided by PN in different regions was highest in Chengdu, followed by the Beijing, Guangzhou, and Hangzhou areas. The percentage of nourishment provided by PN in different departments was highest in general surgery, followed by gastroenterology and the intensive care unit. The percentage of nourishment provided by PN in different diseases/conditions was highest in acute pancreatitis, followed by cancer, and burns. The main source of nitrogen in PN was balanced amino-acid preparations, and in EN, it was protein. The main source of lipids in PN was long- and medium-chain triglyceride lipid emulsion injection.
Conclusion
Despite recent improvements in the application of nutritional support in the People’s Republic of China, a much higher percentage of nitrogen and lipids is delivered through PN than through EN. Furthermore, there are marked regional, departmental, and disease-based differences in the selection of PN versus EN. The rationale for use of nutritional support needs to be improved.
Keywords: nutrition survey, prescription, nutritional support, amino-acid preparations, lipid emulsion
Introduction
Nutritional support, which includes parenteral nutrition (PN) and enteral nutrition (EN), provides therapy for people who cannot obtain adequate nourishment by eating or drinking. “PN” is a special liquid mixture that is delivered intravenously,1 and “EN” is oral nutrient supplementation or tube feeding.2 There has been recent emphasis on the study of nutritional support, specifically on appropriate selection of PN and EN, because PN has been inappropriately used in many cases.3
PN and EN contain protein, glucose, lipids, vitamins, minerals, and other nutrients that are required to supply adequate nourishment. The energy-supplying macronutrients are protein, glucose, and lipids.4 Glucose and lipids are used to provide non-protein calories, and protein is used as the main source of nitrogen to maintain nitrogen balance in the body.5 Furthermore, glucose is used not only in patients requiring nutritional support, but also in patients not requiring nutritional support.
The study reported here aimed to investigate the status of PN and EN in the People’s Republic of China. We obtained information on the prevalence of PN and EN formula types in 59 hospitals from four metropolitan areas in the north, west, south, and east of the People’s Republic of China. We chose to examine nitrogen and lipid levels to assess the status of nutritional support.
Materials and methods
Data collection
All data on nutritional-support prescriptions were obtained from a project on prescription analysis that was supervised by Professor Li Dakui. The purposes of that project were to analyze and evaluate the status and trends of medicines in prescriptions in the People’s Republic of China. More than 100 hospitals from eight metropolitan areas have joined Dr Li’s project. The hospitals provided data on prescriptions to the research group for each sample day. There were three or four sampling days every month, with 40 total sampling days per year.
We selected 59 hospitals from four metropolitan areas in the People’s Republic of China: Beijing, Chengdu, Guangzhou, and Hangzhou. We chose these four cities because they are respectively located in the north, west, south, and east, thus cover a wide area of the country. The “Supplementary materials” section the participating hospitals and sampling-day details. A “nutritional-support prescription” was defined as a prescription consisting of amino-acid injection, intravenous lipid emulsion, and EN preparations. According to Chinese pharmacopoeia, an amino-acid injection included balanced amino-acid preparations (BAA), special disease amino acids (SAA), and dipeptide l-alanyl-l-glutamine (DIP).6 Intravenous lipid emulsion included injections of long-chain triglyceride lipid emulsion (LCT), long- and medium-chain triglyceride lipid emulsion (LMCT), structured triglyceride emulsion (STG), olive-oil emulsion, and fish-oil emulsion. EN preparations included protein EN, peptide EN, and amino-acid EN. All nutritional-support prescriptions from each sampling hospital were collected on each sampling day.
Statistical analysis
The survey results were processed with Access 2003 software, version 11.0.8166.0. First, we calculated the nitrogen and lipid contents of every prescription. Second, we summarized the total nitrogen and lipid contents of all of the prescriptions combined. Third, we calculated the percentage of nitrogen and lipid intake from EN and compared it with that of PN. These values were calculated as follows:
| (1) |
| (2) |
| (3) |
| (4) |
We also compared the prevalence of different nutritional formulas in the prescriptions. The percentages of nitrogen intake from protein, peptide, and amino-acid EN, nitrogen intake from BAA, SAA, and DIP in PN, and lipid intake from LCT, LMCT, STG, olive-oil emulsion, and fish-oil emulsion in PN were calculated in the same manner.
Results
In our hospital survey that was performed over 40 days in 2013, 379,584 nutritional-support prescriptions were collected, comprising 271,904 PN prescriptions and 107,680 EN prescriptions. There were 232,771 prescriptions for male patients and 146,813 prescriptions for female patients. Their ages ranged from 2 days to 113 years old, with an average age of 50.63 years. The diagnoses of the patients included malnutrition, intestinal obstruction, acute pancreatitis, and tumors.
Parenteral nutrition versus enteral nutrition in patients requiring nutritional support
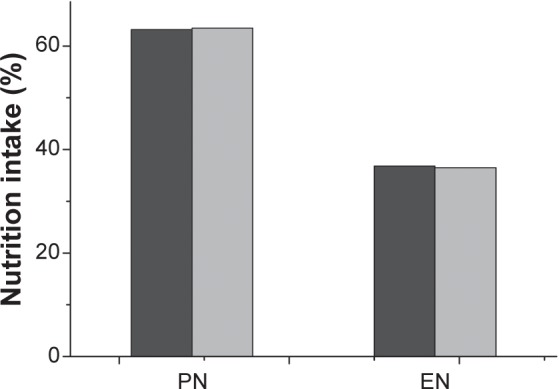
PN was predominantly used in patients requiring nutritional support in the People’s Republic of China in 2013. Approximately 63.2% of nitrogen was obtained through PN and only 36.8% of nitrogen was obtained through EN (Figure 1). Similar findings were observed for lipid intake, with nearly twice as much lipid from PN (63.5%) as from EN (36.5%). We also found that the proportion of nitrogen and lipid intake from PN was similar.
Figure 1.

Enteral nutrition (EN) versus parenteral nutrition (PN) in patients requiring nutritional support.
Notes: Dark gray: nitrogen intake; gray: lipid intake.
Regional differences in enteral nutrition and parenteral nutrition use
The percentages of nitrogen and lipid intake from EN and PN in the Beijing, Chengdu, Guangzhou, and Hangzhou areas are shown in Table 1. The percentage of nitrogen intake through PN was highest in the Chengdu area (81.2%), while that in the Hangzhou area was the lowest (49.1%). The percentage of nitrogen intake in the Beijing and Guangzhou areas was similar (approximately 63%). Lipid intake through PN showed a similar trend, with the highest percentage in the Chengdu area, followed by the Beijing, Guangzhou, and Hangzhou areas.
Table 1.
Regional differences in enteral nutrition (EN) versus parenteral nutrition (PN)
| Region | Nitrogen intake
|
Lipid intake
|
||||
|---|---|---|---|---|---|---|
| PN | EN | PN/EN | PN | EN | PN/EN | |
| Guangzhou | 62.2% | 37.8% | 1.65:1.00 | 62.1% | 37.9% | 1.64:1.00 |
| Hangzhou | 49.1% | 50.9% | 0.96:1.00 | 52.9% | 47.1% | 1.12:1.00 |
| Beijing | 64.1% | 35.9% | 1.79:1.00 | 63.4% | 36.6% | 1.73:1.00 |
| Chengdu | 81.2% | 18.8% | 4.32:1.00 | 80.8% | 19.2% | 4.21:1.00 |
Differences in enteral nutrition and parenteral nutrition use according to hospital department
Patients in the intensive care unit (ICU) and the departments of gastroenterology and general surgery were more likely than patients in other departments to obtain nutritional support because of disease/condition. Therefore, we selected these three departments to compare the application of EN and PN by department. There were differences among the three departments in the use of PN and EN (Table 2). A total of 81.9% of nitrogen intake was through PN in the general surgery department, while it was 76.7% in the department of gastroenterology, and 44.6% in the ICU. Lipid intake showed the same trend as nitrogen intake, with the highest lipid intake percentage through PN in the general surgery department, followed by the department of gastroenterology and the ICU.
Table 2.
Differences in enteral nutrition (EN) and parenteral nutrition (PN) use by department
| Department | Nitrogen intake
|
Lipid intake
|
||||
|---|---|---|---|---|---|---|
| PN | EN | PN/EN | PN | EN | PN/EN | |
| Intensive care unit | 44.6% | 55.4% | 0.81:1.00 | 43.1% | 56.9% | 0.76:1.00 |
| Gastroenterology | 76.7% | 23.3% | 3.29:1.00 | 73.6% | 26.4% | 2.79:1.00 |
| General surgery | 81.9% | 18.1% | 4.52:1.00 | 82.9% | 17.1% | 4.85:1.00 |
Differences in enteral nutrition and parenteral nutrition use according to disease/condition
We evaluated nitrogen and lipid intake through EN versus PN for patients with cancer, severe acute pancreatitis, and burns. We found that the choice of PN versus EN was different according to the patient’s illness/condition (Table 3). Patients with severe acute pancreatitis had approximately three times the percentage of nitrogen intake through PN compared with EN. Cancer patients had the second highest percentage of nitrogen intake, receiving 73.4% percent of their nitrogen intake through PN. Burn patients had the lowest percent of nitrogen intake through PN (43.1%). The percentages of lipid intake were similar to those of nitrogen intake.
Table 3.
Differences in enteral nutrition (EN) and parenteral nutrition (PN) use by disease/conditon
| Disease | Nitrogen intake
|
Lipid intake
|
||||
|---|---|---|---|---|---|---|
| PN | EN | PN/EN | PN | EN | PN/EN | |
| Cancer | 73.4% | 26.6% | 2.76:1.00 | 77.0% | 23.0% | 3.35:1.00 |
| Severe acute pancreatitis | 75.2% | 24.8% | 3.03:1.00 | 81.1% | 18.9% | 4.29:1.00 |
| Burns | 43.1% | 56.9% | 0.76:1.00 | 40.3% | 59.7% | 0.68:1.00 |
Prevalence of nutritional formulas in prescriptions
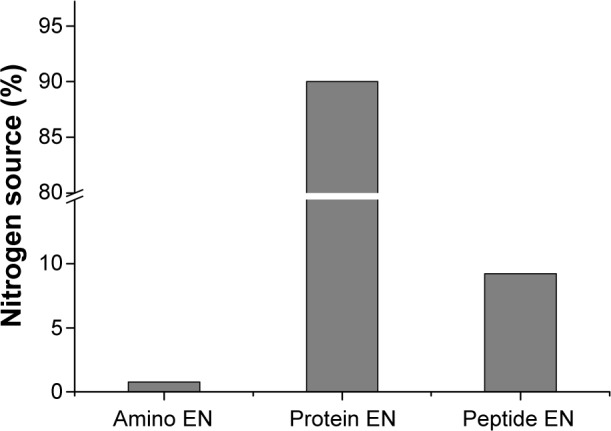
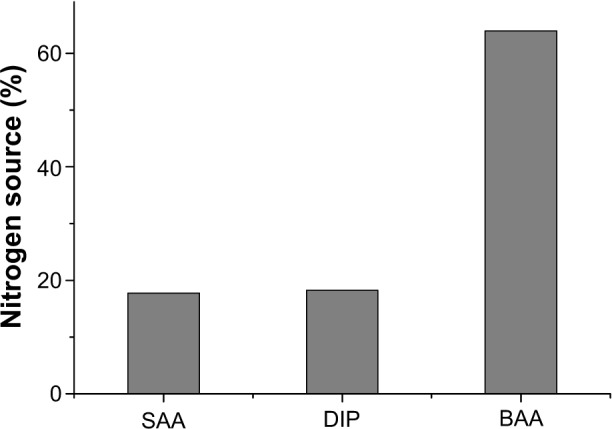
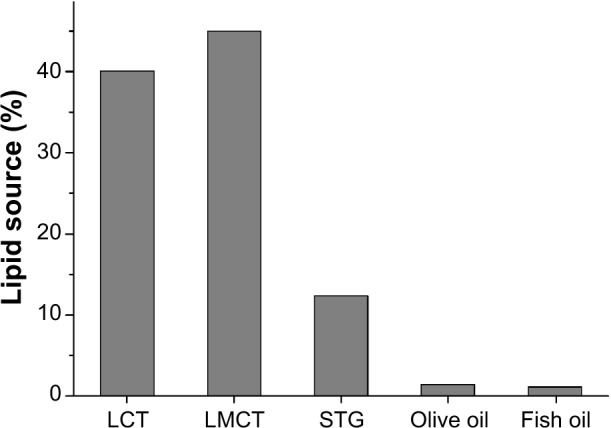
Comparison of the distribution of nitrogen and lipid sources showed a difference among nutritional preparations. The proportion of nitrogen from protein EN (90.0%) was much higher than that from amino-acid EN (0.8%) or peptide EN (9.2%, Figure 2). Figure 3 shows the distribution of nitrogen sources in PN. We found that 63.9% of nitrogen was from BAA, 18.3% from SAA, and 17.8% from DIP. A total of 40.1% of the lipid content in PN was from LCT, 45.0% from LMCT, 12.3% from STG, 1.4% from olive-oil emulsion, and 1.2% from fish-oil emulsion (Figure 4).
Figure 2.

Distribution of nitrogen sources in enteral nutrition (EN).
Figure 3.

Distribution of nitrogen sources in parenteral nutrition.
Abbreviations: BAA, balanced amino-acid preparations; DIP, dipeptide l-alanyl-l-glutamine; SAA, special disease amino acids.
Figure 4.

Distribution of lipid sources in parenteral nutrition.
Abbreviations: LCT, long-chain triglyceride lipid emulsion injection; LMCT, long-and medium-chain triglyceride lipid emulsion injection; STG, structured triglyceride emulsion injection.
Discussion
Artificial nutrition in patients with malnutrition has been studied for more than 50 years. Many guidelines are available to help physicians decide on the best nutritional method for patients. When choosing EN or PN, various factors, such as the patient’s disease/condition, nutritional requirement status, and age, should be considered.7–9 Many physicians believe PN therapy should be evaluated in many guidelines as an alternative to EN when this is not feasible. However, guidelines that are based on observational data and expert opinion have limitations that affect the correct choice. Seres et al evaluated the recent Society of Critical Care Medicine and American Society for Parenteral and Enteral Nutrition guidelines for nutritional support of the critically ill, and found that 85% of the guidelines were level C or below. Therefore, readers are advised to be cautious when interpreting these guidelines.3
Viewpoints on the use of EN versus PN have greatly changed over the past few decades. Therefore, the current consensus is nearly the opposite of what it once was.10 In the 1970s, the ratio of patients receiving PN versus EN was 9:1. With changes in opinion regarding PN and EN, the ratio reversed to 1:9 worldwide in the 1990s.11 In this survey, we found that 63.2% of nitrogen and 63.5% of lipids were obtained through PN in patients receiving nutritional support in our sampling areas. The ratio of PN to EN in the sampling areas was approximately 1.7:1.0, indicating that the choice of nutritional support was sometimes inappropriate. Fang et al reported that the ratio of PN use to EN use in hospitalized patients in Guangzhou was 5.7:1.0 from April 2008 to December 2008.12 In the present study, the ratio of PN to EN in terms of nitrogen and lipid intake in the Guangzhou area was approximately 1.65:1.0 (Table 1), indicating that physicians were more inclined to choose EN in 2013 than in 2008.
The supply of protein and lipids should follow the basic nutritional principles. EN preparations are premixed and commercialized. These predetermined formulations are based on well-accepted standard nutritional principles or research on optimal content. We consider that the ratio of different nutrients in EN preparations is appropriate. Our study showed that nitrogen and lipid intake through EN is almost the same as that through PN (Figure 1). This finding suggests that the formulation ratios in PN are also appropriate.
Many recent studies on EN and PN have focused on their use in pancreatitis, surgery, and critical illness.3,13–15 In our study, the ratio of nitrogen intake through PN versus EN was 0.81:1.00 in the ICU and 4.52:1.00 in the general surgery department. The ratio of nitrogen intake through PN versus EN was 3.03:1.00 in patients with severe acute pancreatitis. This finding suggests that there are large differences in the choice of nutritional support between different departments and for different diseases. Furthermore, there were significant differences among different regions. The ratio of nitrogen intake through PN versus EN was highest in the Chengdu area (4.32:1.00) and lowest in the Hangzhou area (1.12:1.00) (Table 1). These differences may be attributed not only to differences in disease prevalence, but also to different physicians. Physicians who are involved in making decisions regarding nutritional support should be aware of current research and clinical guidelines, and more physicians should seek advanced training in nutritional support.
The types of nitrogen source in EN preparations included protein, peptide, and amino-acid EN. In our study, the most commonly used EN formula was protein EN, which is used in patients with near-normal gut function. Peptide and amino-acid EN were not as widely used as protein EN because the indications for these preparations are much narrower than those for protein EN.16 The nitrogen source in PN nutrition also has many types of amino acids, including BAA, SAA, and DIP. In our study, most of the nitrogen was obtained from BAA (63.96%). SAA provided 18.27% and DIP provided 17.77% of nitrogen. As a type of auxiliary nitrogen source, the amount of nitrogen through DIP should not exceed 20% of the total supply of nitrogen.17 Considering that many patients do not need to use DIP, our results indicated that DIP was erroneously used.
We found that the main lipid source in PN at the sampled hospitals was LMCT. LMCT has advantages over LCT and medium-chain triglyceride lipid emulsion (MCT). Although olive oil is less prone to lipid peroxidation than LMCT and fish oil contains eicosapentaenoic acid and docosahexaenoic acid,18 olive oil and fish oil supply only a small amount of lipids. We found no use of “SMOF” lipids (a combination of soybean oil, MCT, olive oil, and fish oil enriched with vitamin E), which was developed recently, and is safe and clinically effective.19 The new generation of lipid emulsions should be used more widely because they have many advantages.
There are many limitations to our survey. Future studies should address the issues of when to feed, how much to feed, what to feed, duration of therapy, and doctors’ reasons for using PN/EN to investigate the rationality of nutritional therapy.
Conclusion
Despite recent improvements in the application of nutritional support in the People’s Republic of China, a much higher percentage of nitrogen and lipids is delivered through PN than through EN. Furthermore, there are marked regional, departmental, and disease/condition-based differences in the selection of PN versus EN. Effort needs to be made to improve the rationale for use of nutritional therapy. Possible actions for improvement include promoting the clinical guidelines of the American Society for Parenteral and Enteral Nutrition, European Society for Parenteral and Enteral Nutrition, and Chinese Society for Parenteral and Enteral Nutrition; intervention of nutritional-support teams; and improving nutritional-support orders using a computer. The present study will hopefully serve as a guide to further research and also provide basic data from which the success of future investment in nutritional therapy can be based.
Supplementary materials
Participating hospitals
The following hospitals participated in the study:
The 22 hospitals in the Beijing area were:
Beijing University People’s Hospital
Beijing Chuiyangliu Hospital
Beijing Luhe Hospital
Beijing Hospital
Beijing University First Hospital
Beijing Sixth Hospital
Beijing Fengtai Hospital
Beijing Hepingli Hospital
Beijing Jishuitan Hospital
Beijing Huaxin Hospital
Beijing Longfu Hospital
Beijing Anzhen Hospital
Beijing Tiantan Hospital
Beijing Tongren Hospital
Beijing Xuanwu Hospital
Beijing Friendship Hospital
Beijing Zhongguancun Hospital
China-Japan Friendship Hospital
Beijing Fangzhuang Hospital
Beijing Dewai Hospital
Chinese academy of Medical Sciences Cancer Hospital
Beijing University Shougang Hospital.
The twelve hospitals in the Chengdu area were:
West China Hospital of Sichuan University
Sichuan Provincial People’s Hospital
The First People’s Hospital of Chengdu
Affiliated Hospital of North Medical College
Affiliated Hospital of Chengdu University of Traditional
Chinese Medicine
Sichuan Provincial People’s Hospital
People’s Hospital of Deyang City
Affiliated Hospital of Chengdu University
The Second People’s Hospital of Yibin
The Tenth People’s Hospital of Chengdu
Building Hospitals of Sichuan Province
Chengdu Shuangliu People’s Hospital.
The 13 hospitals in the Guangzhou area were:
The First Affiliated Hospital of Sun Yat-Sen University
The Third Hospital Affiliated to Sun Yat-Sen University
Sun Yat-sen University Cancer Center
The First Affiliated Hospital of Guanzhou Medical University
The Henan Hospital of Guanzhou Medical University
Guangdong Provincial People’s Hospital
The First People’s Hospital of Guangzhou
Guangzhou Medical School Third Affiliated Hospital
Guangzhou Overseas Chinese Hospital
Guangzhou Red Cross Hospital
The Second Hospital Affiliated to Sun Yat-Sen University
Guangzhou Dongshan People’s Hospital
The Eastern Hospital of the First Affiliated Hospital
Sun Yat-Sen University.
The twelve hospitals in the Hangzhou area were:
The First Affiliated Hospital of Zhejiang University
The Second Affiliated Hospital of Zhejiang University
Zhejiang Provincial People’s Hospital
Hangzhou Red Cross Hospital
Zhejiang Cancer Hospital
Hangzhou Linan People’s Hospital
Hangzhou Yuhang People’s Hospital
Hangzhou Jiande People’s Hospital
Sir Run Run Shaw Hospital of Zhejiang University
Zhejiang Hospital
Hangzhou Xiaoshan People’s Hospital
Zhejiang Provincial Hospital of Traditional Chinese Medicine.
Participating hospitals
The following days were the sampling days in 2013:
January 1, 14, 22, 28
February 5, 20, 28
March 6, 15, 21
April 8, 17, 23
May 8, 13, 23, 30
June 4, 7, 26
July 2, 10, 26
August 5, 15, 20, 23
September 2, 5, 18
October 10, 21, 25
November 5, 13, 19, 27
December 2, 13, 19.
Acknowledgments
The authors would like to thank Professor Li Dakui and his research team on prescription analysis for collecting nutritional-support prescriptions.
Footnotes
Disclosure
The authors report no conflicts of interest in this work.
References
- 1.Boullata JI, Guenter P, Mirtallo JM. A parenteral nutrition use survey with gap analysis. JPEN J Parenter Enteral Nutr. 2013;37(2):212–222. doi: 10.1177/0148607112464781. [DOI] [PubMed] [Google Scholar]
- 2.Freeman C, Delegge MH. Small bowel endoscopic enteral access. Curr Opin Gastroenterol. 2009;25(2):155–159. doi: 10.1097/MOG.0b013e328324f86b. [DOI] [PubMed] [Google Scholar]
- 3.Seres DS, Valcarcel M, Guillaume A. Advantages of enteral nutrition over parenteral nutrition. Ther Adv Gastroenterol. 2013;6(2):157–167. doi: 10.1177/1756283X12467564. [DOI] [PMC free article] [PubMed] [Google Scholar]
- 4.Berlana D, Sabin P, Gimeno-Ballester V, et al. Cost analysis of adult parenteral nutrition systems: three-compartment bag versus customized. Nutr Hosp. 2013;28(6):2135–2141. [PubMed] [Google Scholar]
- 5.Bonsante F, Iacobelli S, Chantegret C, Martin D, Gouyon JB. The effect of parenteral nitrogen and energy intake on electrolyte balance in the preterm infant. Eur J Clin Nutr. 2011;65(10):1088–1893. doi: 10.1038/ejcn.2011.79. [DOI] [PubMed] [Google Scholar]
- 6.Chinese Pharmacopoeia Committee Chinese pharmacopoeia, Part two. 2010 ed. Beijing: Chinese Medical Science and Technology Press; 2010. [Google Scholar]
- 7.Berger MM, Pichard C. Best timing for energy provision during critical illness. Crit Care. 2012;16(2):215–223. doi: 10.1186/cc11229. [DOI] [PMC free article] [PubMed] [Google Scholar]
- 8.Peter JV, Moran JL, Phillips-Hughes J. A metaanalysis of treatment outcomes of early enteral versus early parenteral nutrition in hospitalized patients. Crit Care Med. 2005;33(1):213–220. doi: 10.1097/01.ccm.0000150960.36228.c0. [DOI] [PubMed] [Google Scholar]
- 9.Weimann A, Braga M, Harsanyi L, Laviano A, Ljungqvist O, Soeters P, DGEM (German Society for Nutritional Medicine) et al. ESPEN (European Society for Parenteral and Enteral Nutrition) ESPEN Guidelines on Enteral Nutrition: Surgery including organ transplantation. Clin Nutr. 2006;25(2):224–244. doi: 10.1016/j.clnu.2006.01.015. [DOI] [PubMed] [Google Scholar]
- 10.Sano Y, Gomez FE, Kang W, et al. Intestinal polymeric immunoglobulin receptor is affected by type and route of nutrition. JPEN J Parenter Enteral Nutr. 2007;31(5):351–356. doi: 10.1177/0148607107031005351. [DOI] [PubMed] [Google Scholar]
- 11.Li JS. The development trend of clinical nutrition support. Parenter Enteral Nutr. 2010;17(1):1–4. [Google Scholar]
- 12.Fang S, Long J, Tan R, et al. A multicentre assessment of malnutrition, nutritional risk, and application of nutritional support among hospitalized patients in Guangzhou hospitals. Asia Pac J Clin Nutr. 2013;22(1):54–59. doi: 10.6133/apjcn.2013.22.1.01. [DOI] [PubMed] [Google Scholar]
- 13.Al-Omran M, Albalawi ZH, Tashkandi MF, Al-Ansary LA. Enteral versus parenteral nutrition for acute pancreatitis. Cochrane Database Syst Rev. 2010;(1):CD002837. doi: 10.1002/14651858.CD002837.pub2. [DOI] [PMC free article] [PubMed] [Google Scholar]
- 14.Singer P, Pichard C. Reconciling divergent results of the latest parenteral nutrition studies in the ICU. Curr Opin Clin Nutr Metab Care. 2013;16(2):187–193. doi: 10.1097/MCO.0b013e32835c34be. [DOI] [PubMed] [Google Scholar]
- 15.Wheble GA, Knight WR, Khan OA. Enteral vs total parenteral nutrition following major upper gastrointestinal surgery. Int J Surg. 2012;10(4):194–197. doi: 10.1016/j.ijsu.2012.02.015. [DOI] [PubMed] [Google Scholar]
- 16.Lloyd DA, Powell-Tuck J. Artificial nutrition: principles and practice of enteral feeding. Clin Colon Rectal Surg. 2004;17(2):107–118. doi: 10.1055/s-2004-828657. [DOI] [PMC free article] [PubMed] [Google Scholar]
- 17.Chinese Pharmacopoeia Committee . Clinical guide to Chinese pharmacopoeia (volume of chemical medicine and biological product) 2010 ed. Beijing: Chinese Medical Science and Technology Press; 2011. [Google Scholar]
- 18.Koletzko B, Goulet O, Hunt J, Krohn K, Shamir R, Parenteral Nutrition Guidelines Working Group et al. J Pediatr Gastroenterol Nutr. 2005;41(Suppl 2):S1e87. doi: 10.1097/01.mpg.0000181841.07090.f4. [DOI] [PubMed] [Google Scholar]
- 19.Klek S, Chambrier C, Singer P, et al. Four-week parenteral nutrition using a third generation lipid emulsion (SMOFlipid) – a double-blind, randomised, multicentre study in adults. Clin Nutr. 2013;32(2):224–231. doi: 10.1016/j.clnu.2012.06.011. [DOI] [PubMed] [Google Scholar]


