

Abstract
Objective and methods
In this study, we investigated whether Ca2+ transients are altered in Purkinje cell aggregates dispersed from the subendocardium overlying the infarcted zone of the left ventricle (IZPCs) 48 h after coronary artery occlusion. To do so, we combined epifluorescent imaging with microelectrode recordings of IZPCs and normal canine Purkinje cell aggregates (NZPCs).
Results
NZPCs respond to an action potential (AP) by a small Ca2+ transient at the cell surface immediately after the AP upstroke followed by a large [Ca2+ ] transient, which propagates to the cell core. In addition, focal Ca2+ waves can originate spontaneously later during the AP or during the diastolic interval (Circ Res 2000;86:448-55) and then propagate throughout the aggregate as ‘cell-wide Ca2+ waves’. Electrically-evoked Ca2+ transients in IZPCs arose significantly faster than those in NZPCs, and showed substantial spatiotemporal nonuniformity within an IZPC aggregate as well as between IZPC aggregates. IZPCs showed, hitherto undetected, low amplitude, micro Ca2+ transients (extent ≤5 μm) at a fivefold higher incidence than in NZPCs. Micro Ca2+ transients appeared to meander over distances ≤100 μm and reduced the local Ca2+ transient of the next paced beat. Micro Ca2+ transients nearly always preceded the cell-wide Ca2+ waves, which occurred more frequently in IZPCs than in NZPCs and caused non-driven electrical activity of the Purkinje aggregate.
Conclusions
Micro Ca2+ transients preceded cell-wide Ca2+ waves so often that it is probable that micro Ca2+ transients induced cell-wide Ca2+ waves. Cell-wide Ca2+ waves, in turn, clearly elicited spontaneous APs. We propose that the high incidence of micro Ca2+ transients in IZPCs is a fundamental element of the abnormal Ca2+ handling of diseased Purkinje cells, underlying arrhythmias originating in the subendocardial Purkinje network post myocardial infarction.
Keywords: Arrhythmia (mechanisms), Calcium (cellular), Impulse formation, Infarction, Membrane potential, Purkinje fiber
1. Introduction
Rapid ventricular arrhythmias after coronary artery occlusion in the canine heart arise from ectopic foci (triggered or automatic) within the Purkinje fiber network located in the subendocardium of the infarct zone in the left ventricle [2]. Spontaneously occurring arrhythmias predictably occur between 24 to 48 h after occlusion. We have previously shown that density and function of several sarcolemmal ion channels are altered in the Purkinje cells dispersed from the subendocardium of the infarct zone (IZPCs) [3]. Further, we have shown that Ca2+ transients in cell aggregates from Purkinje tissues of normal LV subendocardium (NZPCs) consist of a membrane linked Ca2+ transient* that occurs in response to an AP. This initial Ca2+ transient usually leads to a Ca2+ transient** that propagates to the cell core (Fig. 1A). Cell-wide Ca2+ waves that propagate along an aggregate*** occur spontaneously during the interstimulus interval (Fig. 1B) and can give rise to nondriven electrical activity (*, **, *** we have previously denoted these transients: L0, L1 and L2 [1]). Since abnormal impulse initiation in the subendocardial Purkinje network is the cause of the infarction-related arrhythmias [2], we sought to determine whether electrically-evoked Ca2+ transients and the incidence of spontaneous Ca2+ waves are altered in IZPCs.
Fig. 1.
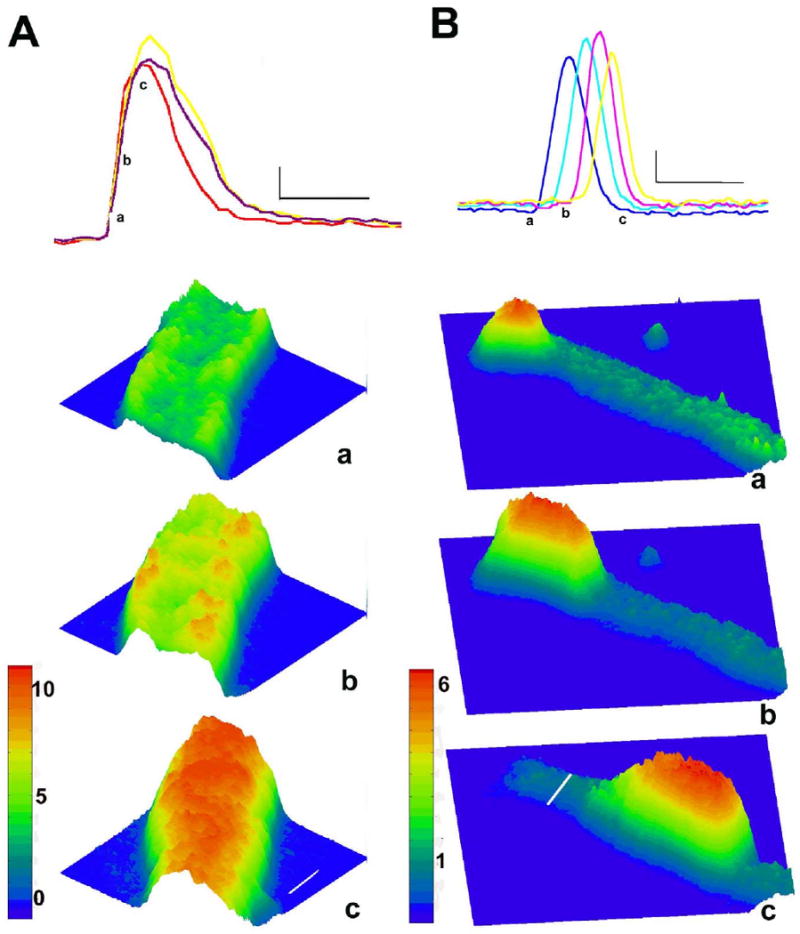
AP-evoked Ca2+ transients are robust and synchronous in NZPC aggregates. During the interval between stimuli, NZPC aggregates are quiescent, except for occasional large Ca2+ waves, which propagate along the cells of the aggregates. Top of each panel shows fluorescence intensity (Ca2+ changes) in two NZPCs during electrically-evoked depolarization (panel A) and a spontaneous Ca2+ wave (panel B). In panel A, fluorescence during an electrically-evoked Ca2+ transient in three ROIs is indicated. Small letters correspond to 3D surface plots (below) of ratio images of a section of this aggregate during the transient. Ca2+ concentration is reflected by both the color and height of the surface. The first response to a stimulus is an increase in Ca2+ (panel Aa), which is present mostly at the aggregate's periphery (panel Ab). Peak Ca2+ change occurs later in core of aggregate (panel Ac). Thin calibration bars correspond to 1 F/F0 unit and 333 ms, respectively, while white lines on surface plot (Panel Ac) correspond to 10 μm. In panel B, a spontaneous cell-wide Ca2+ wave moving along four ROIs of an NZPC is indicated. Small letters correspond to 3D surface plots (below) of a section of this aggregate during the Ca2+ wave. Note that a small Ca2+ transient appears at the edge of aggregate (panel Ba) and induces a Ca2+ wave, which propagates with a flat wave front along the full extent of aggregate until it self terminates (not shown). Thin calibration bars correspond to 1 F/F0 unit and 833 ms, respectively, while thick white line (panel Bc) corresponds to 26 μm for all surface plots. Color bars indicating fluorescence ratio are shown to left of surface plots.
2. Methods
Healthy male mongrel dogs (12–15 kg, 1–2 years old) were used in these studies. Under isoflurane anesthesia (30 mg/kg), myocardial infarction was produced by a two-step total occlusion of the left coronary artery using the Harris procedure [4]. Forty-eight hours after occlusion, infarcted hearts were used for the myocyte study [5].
Aggregates of 2–6 Purkinje cells (NZPCs; width=41±9 μm, length=202±45 μm; IZPCs; width=45±12 μm, length=202±47 μm) were enzymatically dispersed from the subendocardial Purkinje network of the normal (N= number of hearts=8) or the infarcted canine LV (48 h) (N=10) using previously described techniques [5]. Briefly, small strips (4×2×2 mm) of LV endocardium containing Purkinje fiber bundles were dissected from larger preparations removed from specific regions of the control and infarcted hearts. Strips prepared from infarcted hearts were taken from subendocardium directly overlying the infarcted LV. After enzyme incubation and dispersion, viable aggregates of NZPCs and IZPCs were routinely obtained. Aggregates were used because we had observed in previous experiments that normal Purkinje cell aggregates are spontaneously active (electrical) and generally single cells are not [6]. Purkinje cell aggregates were studied in a chamber on the stage of an epifluorescence microscope and superfused with normal Tyrodes solution (in mM): NaCl 137, NaHCO3 24, NaH2PO4 1.8, MgCl2 0.5, CaCl2 2.0, KCl 4.0, and dextrose 5.5 (pH 7.4 maintained by 95:5 O2–CO2) (24–25 °C). This model is suitable for microelectrode recordings and fluorescence studies of intracellular [Ca2+ ] [1,5–7].
2.1. Aggregate/cell selection for fluorescent measurements
Only Purkinje cell aggregates that were rod-shaped with typical junctional ends, clear striations and surface membrane free of blebs were used [1,5]. Aggregates of cells of inhomogeneous thickness or with branches out of the field of view were not imaged. After obtaining an electrical recording from a myocyte in the aggregate using standard microelectrode techniques [5], we recorded fluorescence images during electrical activity. Action potentials (APs) were evoked by extracellular field stimulation [8]. In this way, we could determine the spatial and temporal changes in fluorescence that accompanied transmembrane voltage changes.
2.2. Fluorescence measurement—data acquisition and analysis
The single wavelength Ca2+-sensitive dye, Fluo 3 was used for these experiments. Fluo 3 is excited at longer wavelengths and thus the light results in minimal UV damage to the cells during prolonged experiments. For imaging experiments, aggregates were allowed to settle onto the glass bottom of the superfusion chamber and then loaded with 4 μM Fluo-3AM (20 min). Aggregates were then superfused for at least 15 min before measurements were made.
For imaging, the light from a xenon lamp (485 nm) was passed into the fluorescent port of an inverted Nikon microscope (20×). The fluorescent light (at 525 nm) was projected through a 520 nm barrier filter onto the surface of an image intensifier plate coupled to a CCD camera (Higain Videoscope Camera, Technology International, Washington, DC, USA). For maximal temporal resolution without loss of spatial quality associated with video recordings, images were recorded directly using a Panasonic optical disk recorder (30 f/s) and analyzed off line (Photon Technology International, Princeton, NJ, USA).
For display of fluorescent images of the aggregates (e.g., Figs. 6A, 7A), F of each image pixel was normalized to the median F0 of the resting aggregate. To account for cell dimension changes due to shortening (diameter change increase F/F0 by <5% upon 8–10% shortening), F/F0 was corrected by the factor=surface area of aggregate in F0 frame/surface area of aggregate for F frame of interest. Since this correction is minor for F/F0 of shortening NZPCs (and much less for IZPCs which do not shorten, unpublished observations), we calculated F/F0 for regional behavior of Ca2+ in the following way. Intensity of fluorescence (F) in specific regions of interest (ROIs) on the image was averaged for selected frames and divided by baseline fluorescence (F0) for that ROI. For presentation, three-dimensional (3D) fluorescence profiles were constructed with the aid of an interpolating smoothing algorithm (Matlab) using ratios (Figs. 1, 2A, 4A, 5A) of areas of interest within an aggregate. Ratio profiles are displayed using a color code. Parameters of movement of Ca2+ waves were determined from ratio profiles of ROIs. Wave velocity (Vprop) was calculated from the displacement of the steepest rise of the Ca2+ transient over time.
Fig. 6.
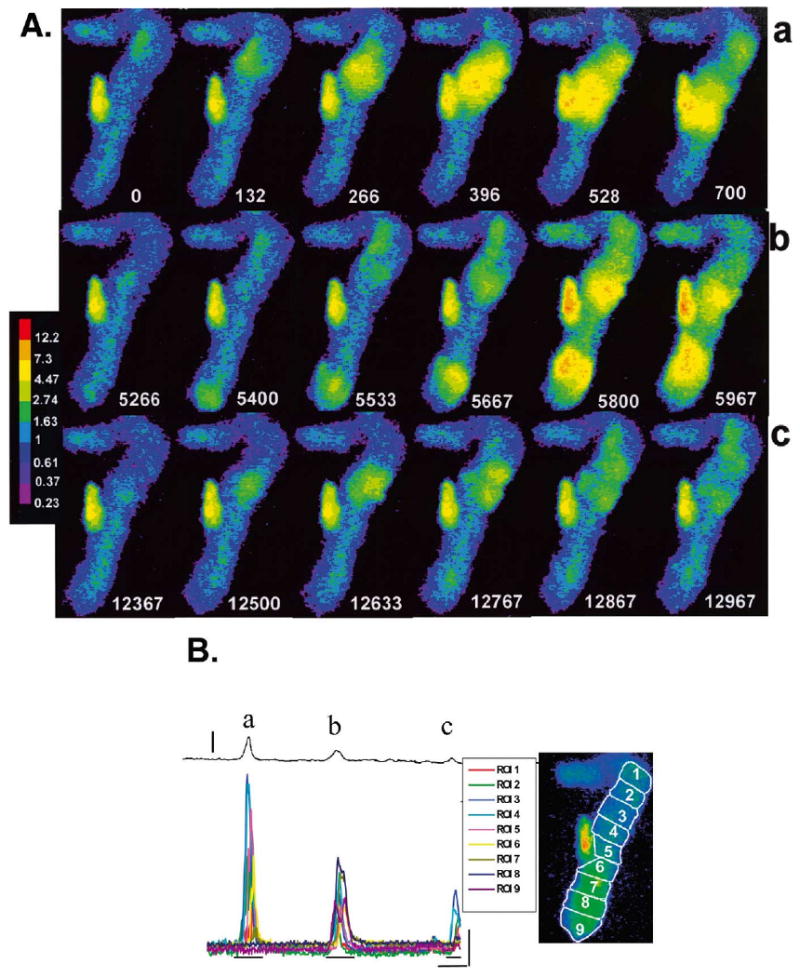
Ca2+ waves lead to depolarizations. The magnitude of the depolarization corresponds to the [Ca2+ ] and extent of the Ca2+ transients. (Panel A) Selected F/F0 image frames from an IZPC and concomitant membrane depolarizations (panel B). Relative time (t=0 first frame) are white numbers. In panel Aa sequence, t=0 to 700 ms corresponds to F/F0 during a large Ca2+ wave (see also a, panel B); In panel Ab, t=5266 to 5967 ms corresponds to F/F0 during two smaller waves which occur nearly simultaneously and propagate toward center of aggregate but stop before colliding (b, panel B); in panel Ac, t=12 367 to 12 967 ms corresponds to small micro Ca2+ transients which meander along upper section of aggregate (c, panel B). Color bar indicates ratio values. (Panel B) Transmembrane potential changes (thin black line above) and changes in F/F0 of ROIs in the spontaneously active IZPC of panel A. Amplitude as well as spatial extent of the waves (see panel A) varied considerably, giving rise to a corresponding membrane depolarization (denoted by a, b, c). Vertical line 15 mV. Image to right indicates positions of ROIs for this panel and panel 7B. Thin vertical and horizontal lines correspond to 1 F/F0 and 1667 ms, respectively. Image frames of panel A derived from sections indicated by thin horizontal lines under Ca2+ tracings.
Fig. 7.
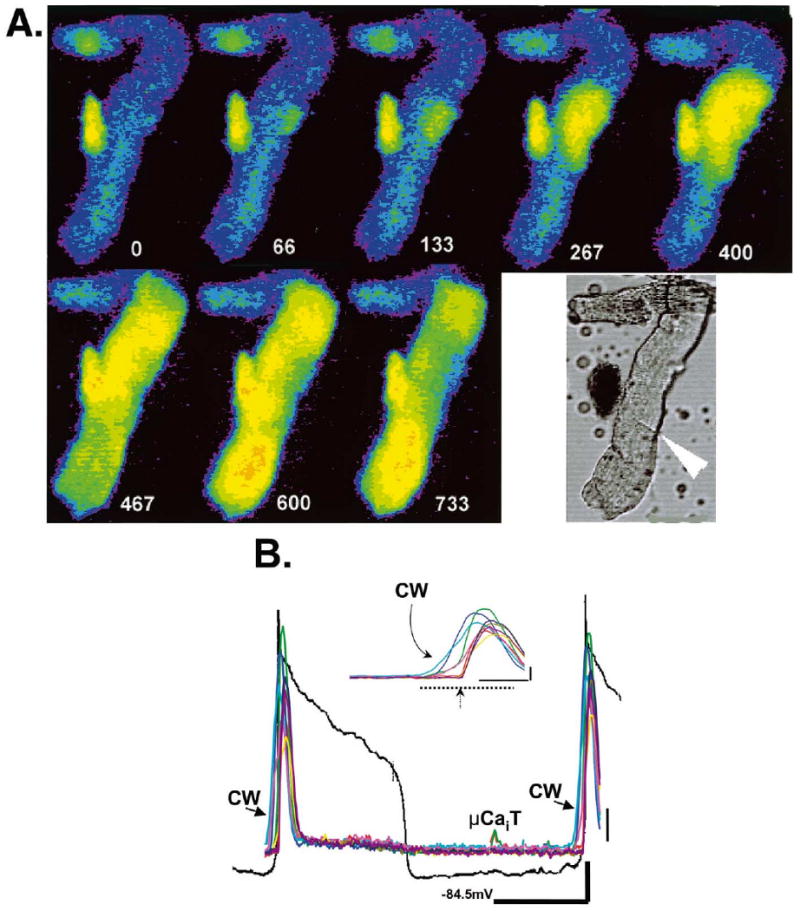
Large extensive Ca2+ waves lead to sufficient depolarization to elicit an AP and thus precede the ensuing electrically-evoked Ca2+ transient. (Panel A) Selected F/F0 image frames from the same IZPC shown in Fig. 6 but during Ca2+ wave induced electrical activity. Time relative to t=0 of first frame is depicted by white numbers. Lower right image is bright field image of this aggregate early during experiment. The arrow denotes a probable cell border. Color code as in Fig. 6A. (Panel B) Transmembrane potential changes (black line) and changes in F/F0 in several ROIs of spontaneously active IZPC of panel A (MDP= −84.5 mV). Nondriven action potentials are triggered by the large cell wide Ca2+ waves (CW). Inset shows enlargement of the Ca2+ wave preceding synchronized Ca2+ release induced by the second action potential (arrow). Images presented in panel A are derived from those occurring during time of dotted line. Note that a micro Ca2+ transient (μCaiT) occurs between the nondriven beats. Thick vertical and horizontal lines are one F/F0 unit and 3 s (1 F/F0, 417 ms for inset), respectively. Thin vertical black line is 12 mV.
Fig. 2.

AP-evoked Ca2+ transients in IZPCs are nonuniform. (Panel A) 3D surface plots of IZPC during the stimulus (S) in panel B. Ca2+ concentration is denoted by both the color and height of the surface. White number indicates time of frame where t=0 is frame just preceding t=33 ms frame. Plot in panel Aa corresponds to IZPC's first response to stimulus and panel Ab shows the nonuniform Ca2+ release at the aggregate's periphery. Panel Ac shows a small area of aggregate where Ca2+ is in core. Color bar to right indicates ratio range. (Panel Ba) Changes in intensity of fluorescence (F/F0) in six ROIs (outlined in white in above image) in IZPC of panel A. Changes in intensity at the edges and a center ROIs (outlined in red)in this IZPC are in panel Bb. Note in response to S, the peak of the center transient does not occur later than that of the edge transients consistent with lack of Ca2+ wave propagation from edge to core. Vertical and horizontal lines in Ba indicate 1 F/F0 and 833 ms, respectively. Vertical and horizontal lines in Bb depict 1 F/F0 unit and 330 ms, respectively. White line on image denotes 20 μm.
Fig. 4.

Nonuniformly occurring micro Ca2+ transients cause nonuniformity of the Ca2+ response of an IZPC aggregate to an AP. (Panel A) 3D surface plots of IZPC just preceding and during an electrically-evoked Ca2+ transient. [Ca2+ ] is denoted by both the color and height of the surface. White numbers indicate time of frame relative to t=0 (Aa). The aggregate was stimulated just before t=900 ms (Ad). Note the presence of micro Ca2+ waves (arrowheads), which propagate over short distances (t=0 to 467 ms) meandering from the right section of the aggregate toward the core. Subsequent stimulation causes nonuniform electrically-evoked local Ca2+ transients (t=900 ms) particularly in regions where micro Ca2+ waves had been. Horizontal bar indicates 50 μm. Color bar indicates ratio range. (Panel B) Changes in intensity of fluorescence (F/F0) at two selected ROIs in IZPC aggregate of panel A. Stimuli are indicated (S). Each ROI is represented by a different color and location is noted in upper image. Persistent fluorescence such as that seen in ROI 7 is not included in analysis. Note that when the micro Ca2+ transients (μCaiT) observed in ROI4 (see arrowheads of panel A) precede S, the subsequent Ca2+ transient of S is diminished compared to that of the previous S. Note that in ROIs where micro Ca2+ transients were absent (e.g., ROI 9), response to stimulation was constant. Vertical and horizontal lines are 1 F/F0 units and 1.58 s, respectively.
Fig. 5.
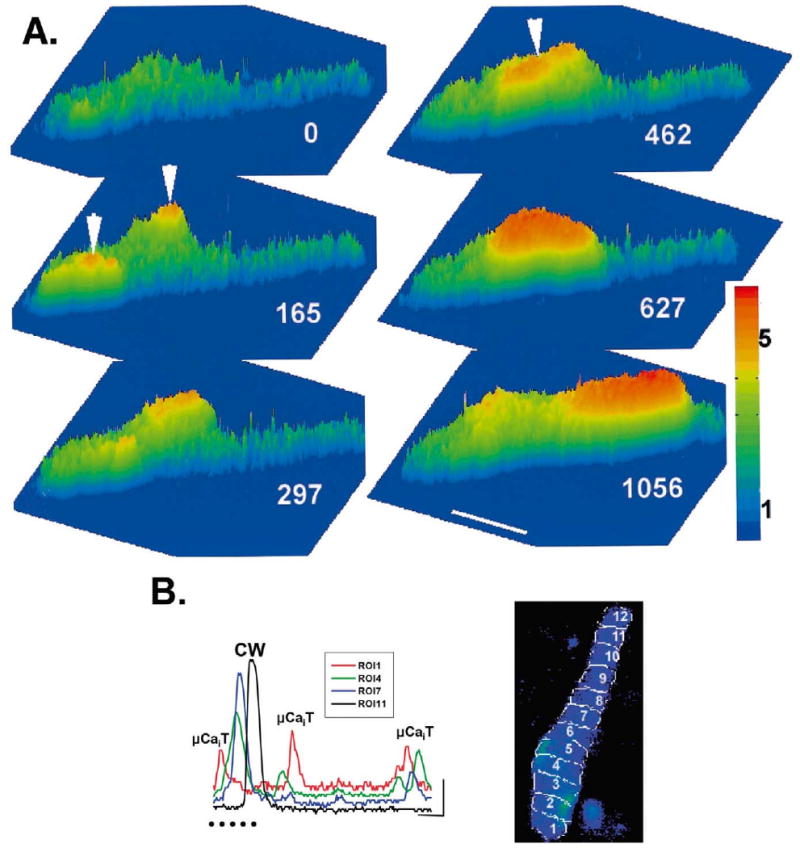
Spontaneous micro Ca2+ transients in IZPCs can lead to macroscopic Ca2+ waves. (Panel A) 3D surface plots of IZPC showing spontaneous Ca2+ release. Ca2+ concentration is denoted by both the color and height of the surface. White numbers indicate time relative to first frame of this sequence. Note the occurrence of micro Ca2+ transients starting in ROIs 1 and 4 (arrowheads) at t=165 to 462 ms and propagating but not throughout the entire aggregate; at t=462 ms, they appear to merge and initiate a larger cell-wide Ca2+ wave (t=627 ms). This wave propagates through the remainder of the aggregate (t=1056 ms) toward ROI 11. Horizontal bar indicates 50 μm. Color bar indicates ratio range. (Panel B) Changes in intensity of fluorescence (F/F0) in four ROIs (1, 4, 7, 11) during micro Ca2+ transients (μCaiT) and cell wide (CW) Ca2+ waves in the IZPC of panel A. Each ROI is represented by a different color. Position of ROI is shown in image of aggregate. 3D surface plots of panel A derived from images during time indicated by row of dots. Vertical and horizontal lines are 1 F/F0 unit and 833 ms, respectively.
Data are expressed as mean±S.D. Comparisons between groups were made using an unpaired Student t-test after determination of normal distribution. P<0.05 were considered significant.
3. Results
3.1. Effects of electrical stimulation on Ca2+ transients in aggregates of Purkinje myocytes from normal and infarcted hearts
Electrically-evoked transients of fluorescence observed in this series of NZPCs were similar to those previously reported for normal canine Purkinje aggregates [1]. Typical examples are shown in Fig. 1A. In response to stimulation there was a rapid increase of fluorescence (Fig. 1Ab)—reflecting an increase of [Ca2+ ]—predominantly along the periphery of the aggregate. The superficial Ca2+ transient induced a Ca2+ transient, which propagated uniformly toward the core of the aggregate (Fig. 1Ac). Electrically-evoked Ca2+ transients in NZPCs did not fully relax as long as the AP persisted [note sustained level (at asterisk) in Fig. 3A]. IZPCs showed triangular shaped APs accompanied by reduced sustained Ca2+ levels during the relaxation phase of the transient (Table 1) (Figs. 3 and 7B) [5,9]. Spontaneous cell-wide Ca2+ waves often seemed to start spontaneously at one end of the aggregate (Fig. 1Ba) either during the AP or during diastole and traveled as cell-wide Ca2+ waves along the aggregate (Fig. 1Bb,c).
Fig. 3.

The AP-profile in IZPCs is usually triangular in shape. Time course of transmembrane action potentials (thick black lines) of an NZPC (upper panel) and an IZPC (lower panel) and concomitant changes in F/F0 at several ROIs during paced beats. Each ROI is represented by a different color. Note the sustained level of Ca2+ during the AP plateau in the NZPC (asterisk). Upon repolarization Ca2+ slowly returns to a diastolic level (dotted line). In the IZPC triangulated action potential (see also Fig. 7B), note the gradual decay of Ca2+. Thin vertical lines are 25 mV. Thick vertical line and horizontal line are 1 F/F0 unit, 1 s, respectively.
Table 1.
Electrically-evoked Ca2+ transients
| F/F0 peak | TTP | T1/2relax | F/F0 sustained | |
|---|---|---|---|---|
| NZPCs | 5.13±1.31 | 169±51 | 181±41 | 1.34±0.36 |
| IZPCs | 4.07±1.37* | 139±49* | 172±41* | 0.94±0.32* |
Mean±S.D. Number of ROIs=266 and 312 for NZPCs and IZPCs, respectively. Stimulation CL=3 s. F/F0 is in ratio units, TTP (time to peak) in ms, T1/2relax (time to half relaxation) in ms.
P<0.05.
Only 22% of the electrically-evoked Ca2+ transients were uniform in IZPC aggregates; in the other cases, an electrically-evoked Ca2+ transient consisted of an initial rise of Ca2+ along the periphery of the aggregate. These peripheral Ca2+ transients varied spatially in magnitude (Fig. 2A) and were followed by propagation of the Ca2+ transient to the aggregate core only in some regions (e.g., ROI 1, 2 Fig. 2). Frequently, peripheral transients failed to propagate to the core (e.g., ROI 4, Fig. 2). This led to substantial spatiotemporal nonuniformity of local AP driven Ca2+ transients in any one IZPC.
As a result, the average electrically-evoked Ca2+ transient in IZPCs was significantly smaller than that of NZPCs (Table 1) as were time-to-peak and time-to-half relaxation values.
It was striking that nonuniform Ca2+ transients in paced IZPCs occurred if small (<5 μm), spontaneously occurring, low amplitude diastolic Ca2+ waves preceded the stimuli. These micro Ca2+ transients (denoted as μCaiT in figures) were extremely common in IZPCs and are illustrated in Fig. 4A. Micro Ca2+ transients (arrowheads) (Fig. 4A) propagated nonuniformly along the edge of the aggregate and toward the cell core but never propagated throughout the aggregate. A stimulus following micro Ca2+ transients (Fig. 4B) resulted in nonuniform Ca2+ transients with a reduction of the AP-induced response, particularly in regions where micro Ca2+ transients had occurred (e.g., ROI 4 in Fig. 4B). Since micro Ca2+ transients occurred randomly, electrically-evoked Ca2+ transients varied considerably from beat-to-beat (Fig. 4B).
3.2. Spontaneous Ca2+ waves initiate APs in Purkinje cell aggregates from normal and infarcted hearts
IZPCs exhibited cell-wide Ca2+ waves more often than NZPCs (70 versus 49% of the aggregates, respectively; 37% of the NZPCs were quiescent) but the average amplitude of these Ca2+ waves was significantly smaller than that of NZPCs and their propagation velocity (Vprop) was significantly lower than that in NZPCs (Table 2).
Table 2.
Spontaneous cell-wide Ca2+ waves
P<0.05, mean±S.D. Number=86 and 107 for NZPCs and IZPCs, respectively. F/F0 is peak amplitude of transient in ratio units, T1/2relax in ms, Vprop in μm/s.
The occurrence of cell-wide Ca2+ waves (denoted as CW in figures) in IZPCs was strikingly coupled to the spontaneous occurrence of micro Ca2+ transients (Fig. 5). For example, for all observations in 27 aggregates, a cell-wide Ca2+ wave was found to either originate in an micro Ca2+ wave rich area (15%) or was clearly preceded by a micro Ca2+ transient (70%) similar to events illustrated in Fig. 5B. However, as illustrated in Fig. 5B, a micro Ca2+ transient did not always visibly lead to a cell-wide Ca2+ wave. All IZPCs exhibited micro Ca2+ transients compared to only 16% of the NZPCs, while their amplitudes were similar (Table 3). Correspondingly, the frequency of micro Ca2+ transients calculated from ∼24 000 frames of 46 NZPCs and 33 IZPCs was fivefold higher in IZPCs than in NZPCs (Table 3). Movies also revealed a higher frequency of cell-wide Ca2+ waves in IZPCs, while the probability that a cell-wide Ca2+ wave would lead to an AP was similar (19.4% in NZPCs, 21% in IZPCs) (Table 3).
Table 3.
Frequency and amplitude of micro Ca2+ transients
| No. of aggregates | Micro Ca2+ transient: F/F0 | Frequency of events (No./frame*100) | ||||
|---|---|---|---|---|---|---|
| Micro Ca2+ transients | Cell-wide Ca2+ waves | Cell-wide Ca2+ waves with AP | No. of frames | |||
| NZPCs | 46 | 2.06±0.124 (19) | 0.28% | 0.49% | 0.096% | 12 464 |
| IZPCs | 33 | 1.94±0.91 (41) | 1.4% | 0.56% | 0.012% | 11 942 |
Mean±S.D. F/F0 peak of micro Ca2+ transient (ratio units, n in parentheses).
Both micro Ca2+ transients and cell-wide Ca2+ waves in IZPCs were accompanied by membrane depolarizations. The amplitude and time course of these depolarizations corresponded with both the duration and amplitude of Ca2+ waves as well as their extent and number. In the IZPC of Fig. 6 (diastolic potential= −87 mV) a large membrane depolarization (17 mV) was secondary to a cell-wide Ca2+ wave, which propagated half the length of the aggregate. Less than 5 s later two spontaneous micro Ca2+ transients appeared, propagated slowly (104–130 μm/s) and terminated before colliding, while giving rise to a 7.5 mV depolarization. A few seconds later, a micro Ca2+ transient occurred in the same aggregate and gave rise to two more transients, both of which meandered along the upper portion of aggregate until each spontaneously terminated. This sequence produced a 4 mV depolarization (Fig. 6Bc). Seconds later, a cell-wide Ca2+ wave in the same aggregate caused a membrane depolarization large enough to initiate a non-driven AP. The sequence of images in Fig. 7A depict the time course of the cell-wide Ca2+ wave that initiated repetitive nondriven electrical activity in this same IZPC. Synchronized Ca2+ release is mediated by the membrane depolarization and subsequent AP initiation as seen in Fig. 7B, at t=467 ms. The inset of Fig. 7B clearly illustrates that large Ca2+ transients precede the AP, which, in turn, induced synchronized Ca2+ release at the arrow. Conversely, we have observed no APs or the Ca2+ transients that are elicited by APs, in aggregates without a preceding cell-wide Ca2+ wave and/or its accompanying depolarization.
3.3. Spontaneous Ca2+ events at 35 °C
In an additional set of experiments, we determined the effects of increasing the temperature from 25 to 35 °C on the occurrence of spontaneous Ca2+ events in nine NZPC and five IZPC aggregates. In NZPCs (five of which showed micro Ca2+ transients), this rise in temperature increased the occurrence of micro Ca2+ transients 1.9-fold (from 0.24% of 7841 frames to 0.45% of 5643 frames, respectively) and that of cell-wide Ca2+ waves 4.4-fold. However the incidence of micro Ca2+ transients in NZPCs never reached that seen in the IZPCs (all of which showed micro Ca2+ transients: 1.2% of 3878 frames at 25 °C with a 1.4-fold increase to 1.8% of 3438 frames at 35 °C). The incidence of cell-wide Ca2+ waves in IZPCs at 35 °C also increased 1.5-fold. Cell-wide Ca2+ waves significantly accelerated at 35 °C [222±13 μm/s (n=20) versus 129±6.4 μm/s (n=29) at 25 °C, P<0.001]. Most importantly, the incidence of cell-wide Ca2+ waves that gave rise to AP-mediated synchronized Ca2+ release similar to that depicted in Fig. 7B, increased dramatically at 35 °C in both NZPCs (i.e., fourfold from 0.04 to 0.16%) and IZPCs (ninefold from 0.05 to 0.47%).
4. Discussion
We have characterized for the first time the spatial and temporal abnormalities in Ca2+ cycling that give rise to Ca2+ waves and underlie abnormal nondriven electrical activity in subendocardial Purkinje cell aggregates that survive in the infarcted heart. This type of Purkinje cell dysfunction may be the source of the multiform ventricular arrhythmias that occur at this time after coronary artery occlusion [2,9,10]. In our analysis, we established that IZPCs show nonuniform Ca2+ transients during paced beats. These nonuniformities result from a break-up of the Ca2+ propagation from the cell-periphery to its core that is normally induced by an AP, particularly in regions where micro Ca2+ transients had been present prior to the stimulus. Consequently, the presence of micro Ca2+ transients preceding stimulation reduced the amplitude of the subsequent paced Ca2+ transient (Fig. 4) [11].
We observed a fivefold higher incidence of micro Ca2+ transients in IZPCs vs. NZPCs and, although micro Ca2+ transients were accompanied by small depolarizations, they did not elicit APs. On the other hand, micro Ca2+ transients preceded cell-wide Ca2+ waves so often that it is probable that micro Ca2+ transients induced cell-wide Ca2+ waves (e.g., Fig. 5). APs were initiated by cell-wide Ca2+ waves in both NZPCs and IZPCs and their frequency of generation was increased at 35 °C. Conversely no APs were observed in these aggregates without preceding Ca2+ waves. Hence, it is likely that arrhythmias post infarction result from the increased incidence of micro Ca2+ transients that lead to cell-wide Ca2+ waves which, in turn, induce APs in the subendocardial Purkinje network overlying the infarct.
4.1. Experimental considerations
The increased incidence of micro Ca2+ transients in IZPCs could have resulted from our surgical procedure and not the myocardial infarction. This is unlikely, as we have shown in previous work [5] that the chronic changes in ion channel function in IZPCs do not occur in cells from sham-operated animals. It is also unlikely that the cell isolation procedure is the cause of the increased occurrence of micro Ca2+ transients as the isolation procedure used for IZPCs and NZPCs was exactly the same and we did not observe a high incidence of micro Ca2+ transients in NZPCs. Further, transmembrane potentials recorded from IZPCs exhibited maximal diastolic potentials similar to our previously published data in single cells and to data from superfused multicellular preparations of the healing infarcted heart [12,13].
Fluorescence was measured using a single wavelength dye. While important for determination of spatial and temporal changes in [Ca2+ ] in an aggregate, this approach can lead to under/over estimation of peak F/F0 values. For example, shortening of an aggregate can result in additional fluorescence due to thickening of the aggregate and thus an overestimation of peak values in ROIs of shortened cells. Since little shortening existed in IZPCs, this might be why NZPC stimulated peak F/F0 is larger. However, the aggregate diameter would increase F/F0 only by <5% with 8–10% shortening and as such cannot account for the 20% reduction in peak F/F0 in IZPCs.
Underestimation of peak F/F0 values of events with our technique, particularly of the meandering events such as the micro Ca2+ transients could be due to Ca2+ propagation in and out of the focal plane of our system. However, it is unlikely that cell-wide Ca2+ wave amplitudes are underestimated since large Ca2+ waves travel not only the full spatial extent of cells but also between cells within aggregate. This is in contrast to the behavior of normal rabbit Purkinje cells, which do not show any Ca2+ wave behavior even in the presence of 5 mM Ca2+ and isoproterenol [14].
Temporal fluorescence changes reported here are limited by time resolution of our video imaging system and we may have missed micro Ca2+ transients preceding cell-wide Ca2+ waves. Electrically-evoked Ca2+ transients, cell-wide Ca2+ waves and micro Ca2+ transients exhibit a slow time course, therefore are reliable at our sampling rate. Hence, most data analyzed were from experiments conducted at room temperature, in order to slow Ca2+ dynamics so we could more accurately resolve events. Finally, a comparison of behavior of aggregates at 25 °C with that at 35 °C corroborates our first conclusion, that is, there is an increased incidence of micro Ca2+ transients in Purkinje cell aggregates that have survived in the infarcted heart.
4.2. Possible explanation(s) for nonuniform Ca2+ transients in Purkinje cells from the infarcted heart
There are several possible explanations for increased incidence of micro Ca2+ transients in Purkinje cells from the infarcted heart. It is possible that these Ca2+ transients are secondary to ion channel remodeling that is known to occur in IZPCs [3]. Changes in outward K+ currents in IZPCs would be expected to affect Ca2+ transients of IZPCs by production of chronic changes in the AP profile. Loss of density of Ito and upregulated plateau K+ currents in IZPCs alter the time course of early repolarization [16] resetting the ICaL present during plateau [15]. Neither change is likely to increase the incidence of micro Ca2+ transients but both changes may contribute to the reduction in peak F/F0 in paced IZPCs. There is a 55% decrease in peak ICaL density in IZPCs and IZPC Ca2+ currents appear prone to ‘voltage dependent’ inactivation [17]. At this time we cannot rule out that there is an increased in probability of opening of Ca2+ channels at diastolic potentials in IZPCs. The resultant Ca2+ influx could contribute to an increase occurrence of micro Ca2+ transients. However, preliminary data in IZPCs suggest that micro Ca2+ transients are not affected by verapamil (data not shown). Finally, since our previous data showed that cell-wide Ca2+ waves and resultant membrane depolarizations are ryanodine/thapsigargin sensitive [1], it is possible that increased incidence of cell-wide Ca2+ waves owing to an increased incidence of micro Ca2+ transients in IZPCs is enhanced spontaneous Ca2+ release that is secondary to altered activity of SR Ca2+ channels.
A fraction of the cell-wide Ca2+ waves leads to non-driven electrical beats. IZPCs have weak IK1 currents [16] and thus would show enhanced excitability to any micro Ca2+ transient or cell-wide Ca2+ wave transient activated depolarizing currents such as those caused by ICaCl or INaCa [18]. We show here that it is both the amplitude and spatial extent of the Ca2+ transient within an aggregate that determines membrane depolarization. Therefore, only large Ca2+ transients over a substantial extent of the cell are sufficient to trigger an AP. The increase in probability that a cell-wide Ca2+ wave inducing an AP observed at 35 C is consistent with this concept. The Na/Ca exchanger probably plays an important role here, because of the acceleration of both the Na/K pump and the Na/Ca exchanger. The resultant increase of the Na+ gradient at 35 °C would further enhance the increase of INaCa, due to acceleration of the exchanger itself, hence predicting that any Ca2+ transients will depolarize the cell more at 35 °C than at 25 °C.
4.3. Relationship to findings of others
While there have been numerous studies describing the normal AP-driven cell Ca2+ transient, only recently have studies appeared that have addressed aspects of abnormal intracellular Ca2+ dynamics in cells (tissues) from diseased hearts. These studies have been largely focused on abnormalities in ventricular tissues. None have focused on abnormal Purkinje cell Ca2+ dynamics although some early studies showed that the automatic/triggered activity of Purkinje fibers that survive in the infarcted heart is strongly modulated by agents that affect sarcoplasmic reticular function [20].
In ventricular cells from diseased hearts, poorly coordinated Ca2+ spark production was shown to be involved in the small slow electrically-evoked Ca2+ transients of cells surviving adjacent to the healed (3–4 weeks) infarct [21]. However, no mention was made of altered excitability of these cells (that is, no increase in nondriven electrical activity was observed). Spontaneous Ca2+ release events have been linked to Cai dependent inward currents in Purkinje fibers exposed to high Ca2+ levels [22] and to arrhythmogenic triggered propagated contractions in damaged rat trabeculae [23]. In studies using normal cells, Schlotthauer and Bers [19] showed a clear relationship between an uniform caffeine induced SR Ca2+ release, the resultant caffeine-DAD and resulting ventricular depolarization. The relationship between spontaneous Ca2+ release and propagating Ca2+ waves and their role in modulating membrane depolarization in these cells was not investigated. We show in this study that in Purkinje cells that have survived in the infarct, spontaneous occurring Ca2+ waves lead to membrane depolarization and arrhythmogenic nondriven electrical activity.
Acknowledgments
Supported by grants HL-58860 from NHLBI, Bethesda, MD, USA, CIHR and Alberta Heritage Foundation for Medical Research.
References
- 1.Boyden PA, Pu J, Pinto JMB, Ter Keurs HEDJ. Ca2+ transients and Ca2+ waves in Purkinje cells. Role in action potential initiation. Circ Res. 2000;86:448–455. doi: 10.1161/01.res.86.4.448. [DOI] [PMC free article] [PubMed] [Google Scholar]
- 2.Janse MJ, Wit Al. Electrophysiological mechanisms of ventricular arrhythmias resulting from myocardial ischemia and infarction. Physiol Rev. 1989;69:1049–1169. doi: 10.1152/physrev.1989.69.4.1049. [DOI] [PubMed] [Google Scholar]
- 3.Pinto JMB, Boyden PA. Electrophysiologic remodeling in ischemia and infarction. Cardiovasc Res. 1999;42:284–297. doi: 10.1016/s0008-6363(99)00013-9. [DOI] [PubMed] [Google Scholar]
- 4.Harris AS. Delayed development of ventricular ectopic rhythms following experimental coronary occlusion. Circulation. 1950;1:1318–1328. doi: 10.1161/01.cir.1.6.1318. [DOI] [PubMed] [Google Scholar]
- 5.Boyden PA, Albala A, Dresdner K. Electrophysiology and ultrastructure of canine subendocardial Purkinje cells isolated from control and 24 hour infarcted hearts. Circ Res. 1989;65:955–970. doi: 10.1161/01.res.65.4.955. [DOI] [PubMed] [Google Scholar]
- 6.Robinson RB, Boyden PA, Hoffman BF, Hewett KW. Electrical restitution process in dispersed canine cardiac Purkinje and ventricular cells. Am J Physiol. 1987;253:H1018–H1025. doi: 10.1152/ajpheart.1987.253.5.H1018. [DOI] [PubMed] [Google Scholar]
- 7.Jeck C, Pinto JMB, Boyden PA. Transient outward currents in subendocardial Purkinje myocytes surviving in the 24 and 48 h infarcted heart. Circulation. 1995;92:465–473. doi: 10.1161/01.cir.92.3.465. [DOI] [PubMed] [Google Scholar]
- 8.Licata A, Aggarwal R, Robinson RB, Boyden PA. Frequency dependent effects on Cai transients, cell shortening in myocytes that survive in the infarcted heart. Cardiovasc Res. 1997;33:341–350. doi: 10.1016/s0008-6363(96)00246-5. [DOI] [PubMed] [Google Scholar]
- 9.Friedman PL, Stewart JR, Wit AL. Spontaneous and induced arrhythmias in subendocardial Purkinje fibers surviving extensive myocardial infarction in dogs. Circ Res. 1973;33:612–626. doi: 10.1161/01.res.33.5.612. [DOI] [PubMed] [Google Scholar]
- 10.LeMarec H, Dangman KH, Rosen MR. An evaluation of automaticity and triggered activity in the canine heart 1 to 4 days after myocardial infarction. Circulation. 1985;71:1224–1236. doi: 10.1161/01.cir.71.6.1224. [DOI] [PubMed] [Google Scholar]
- 11.Diaz ME, Trafford AW, O'Neil CL, Eisner DA. A measurable reduction of SR Ca content follows spontaneous Ca release in rat ventricular myocytes. Pflugers Arch. 1997;434:852–854. doi: 10.1007/s004240050475. [DOI] [PubMed] [Google Scholar]
- 12.Friedman PL, Stewart JR, Fenoglio JJ, Jr, Wit AL. Survival of subendocardial Purkinje fibers after extensive myocardial infarction in dogs. Circ Res. 1973;33:597–611. doi: 10.1161/01.res.33.5.597. [DOI] [PubMed] [Google Scholar]
- 13.Lazzara R, El-Sherif N, Scherlag BJ. Early and late effects of coronary artery occlusion on canine Purkinje fibers. Circ Res. 1974;35:391–399. doi: 10.1161/01.res.35.3.391. [DOI] [PubMed] [Google Scholar]
- 14.Cordeiro JM, Spitzer KW, Giles W, Ershler PR, Cannell MB, Bridge JHB. Location of the initiation of calcium transients and sparks in rabbit Purkinje cells. J Physiol. 2001;531:301–314. doi: 10.1111/j.1469-7793.2001.0301i.x. [DOI] [PMC free article] [PubMed] [Google Scholar]
- 15.Sah R, Ramirez RJ, Backx PH. Modulation of Ca2+ release in cardiac myocytes by changes in repolarization rate: role of phase-1 action potential repolarization in excitation–contraction coupling. Circ Res. 2002;90:165–173. doi: 10.1161/hh0202.103315. [DOI] [PubMed] [Google Scholar]
- 16.Pinto JMB, Boyden PA. Reduced inward rectifying and increased E4031 sensitive K+ channel function in arrhythmogenic subendocardial Purkinje myocytes from the infarcted heart. J Cardiovasc Electrophysiol. 1998;9:299–311. doi: 10.1111/j.1540-8167.1998.tb00915.x. [DOI] [PubMed] [Google Scholar]
- 17.Boyden PA, Pinto JMB. Reduced calcium currents in subendocardial Purkinje myocytes that survive in the 24 and 48 hour infarcted heart. Circulation. 1994;89:2747–2759. doi: 10.1161/01.cir.89.6.2747. [DOI] [PubMed] [Google Scholar]
- 18.Verkerk AO, Veldkamp MW, Bouman LN, Van Ginneken ACG. Calcium-activated Cl− current contributes to delayed afterdepolarizations in single Purkinje and ventricular myocytes. Circulation. 2000;101:2639–2644. doi: 10.1161/01.cir.101.22.2639. [DOI] [PubMed] [Google Scholar]
- 19.Schlotthauser K, Bers DM. Sarcoplasmic reticulum Ca2+ release causes myocyte depolarization. Underlying mechanism and threshold for triggered action potentials. Circ Res. 2000;87:774–780. doi: 10.1161/01.res.87.9.774. [DOI] [PubMed] [Google Scholar]
- 20.Boutjdir M, El-Sherif N, Gough WB. Effects of caffeine and ryanodine on delayed afterdepolarizations and sustained rhythmic activity in the 1-day old myocardial infarction in the dog. Circulation. 1990;81:1393–1400. doi: 10.1161/01.cir.81.4.1393. [DOI] [PubMed] [Google Scholar]
- 21.Litwin SE, Zhang D, Bridge JHB. Dyssynchronous Ca2+ sparks in myocytes from infarcted hearts. Circ Res. 2000;87:1040–1047. doi: 10.1161/01.res.87.11.1040. [DOI] [PubMed] [Google Scholar]
- 22.Kass RS, Tsien RW. Fluctuations in membrane current driven by intracellular calcium in cardiac Purkinje fibers. Biophys J. 1982;38:259–269. doi: 10.1016/S0006-3495(82)84557-8. [DOI] [PMC free article] [PubMed] [Google Scholar]
- 23.Miura M, Boyden PA, ter Keurs HEDJ. Ca2+ waves during triggered propagated contractions in intact trabeculae: determinants of the velocity of propagation. Circ Res. 1999;84:1459–1468. doi: 10.1161/01.res.84.12.1459. [DOI] [PubMed] [Google Scholar]