Abstract
Multiplexed fluorescence or electrochemiluminescence immunoassays of soluble cytokines are commonly performed in the context of human serum or plasma, to look for disease biomarkers and to monitor the immune system in a simple and minimally invasive way. These assays provide challenges due to the complexities of the matrix (serum or plasma) and the presence of many cytokines near the limit of detection of the assay. Here, we compare the readout of matched serum and plasma samples, which are generally correlated. However, a subset of cytokines usually have higher levels in serum, and the non-specific background is significantly increased in serum versus plasma. Presumably as a result of this non-specific background, disease-related decreases in low-abundance cytokines can sometimes be detected in plasma but not in serum. We further show, through spike recovery experiments, that both serum and plasma inhibit the readout of many cytokines, with some variability between donors, but with serum causing greater inhibition than plasma in many cases. Standard diluents from different vendors can partially reverse this inhibition to varying degrees. Dilution of samples can also partly overcome the inhibitory effect of the matrix. We also show that dilution is nonlinear and differentially affects various cytokines. Together, these data argue that (1) plasma is a more sensitive matrix for detecting changes in certain low-abundance cytokines; (2) calculation of concentrations in serum or plasma matrices is inherently inaccurate; and (3) dilution of samples should not be assumed to be linear, i.e., all comparisons need to be made among similarly diluted samples.
Keywords: Luminex, Immunoassay, Serum, Plasma, Cytokine
Introduction
Multiplexed immunoassays have increasingly overtaken single-analyte ELISA or RIA as the tool of choice for the measurement of soluble cytokines in a variety of biological fluids, including serum and plasma. The most dominant multiplexed immunoassay platforms use bead-based capture of cytokines, with readout by multicolor fluorescence [1–3]. This is exemplified by the Luminex platform, which is sold by multiple vendors and for which both standard and customizable kits are available. The availability of kits for measuring large numbers of cytokines in parallel, together with the convenience of an integrated instrument and analysis software, has made this a popular method. Variations of this approach, designed to run on standard flow cytometers, are also available. In addition, a multiplexed chemiluminescence platform (MesoScale Discovery) [4] has become popular for the detection of cytokines and other analytes using pre-coated multi-well plates, rather than fluorescent microspheres.
These multiplexed immunoassays are compatible with many different sample types, including serum, plasma, other body fluids, cell lysates, and cell culture supernatants. Of these, serum and plasma are the most commonly analyzed compartments, being relatively easy to obtain, and offering the prospect of readily measurable biomarkers of immunological or inflammatory diseases. However, serum and plasma suffer from the fact that many cytokines are present at very low abundance (<10 pg/ml), and as such, they are near the limit of detection of current assays [5]. This makes it difficult to detect small changes in their abundance that may accompany a disease state. Furthermore, previous studies have shown that serum and plasma themselves inhibit the detection of many cytokines, as shown by spike recovery experiments [6–10]. This so-called matrix inhibition can be due to specific and non-specific factors and varies by cytokine. As such, it is difficult to accurately quantify many cytokines of biological interest in serum or plasma.
In this study, we compare serum and plasma matrices for the ability to detect a large array of cytokines, using current Luminex and MesoScale Discovery kits. We compare the matrix effects of serum and plasma, and their compatibility with detecting small differences associated with disease. We also show the effects of different buffers for dilution of standards and the effects of diluting the samples themselves. The results of these comparisons have clear implications for the optimal performance of multiplexed cytokine assays from serum and plasma and for the interpretation of the resulting data.
Materials and methods
Subjects
Multiple myeloma patients were recruited through the Stanford Cancer Center in accordance with federal and local human subjects regulations (IRB protocol ID 25310). Patients included in the study were either newly diagnosed and untreated or had not been on any cancer-specific treatment during the last 6 months. Age-matched healthy controls were recruited through the Stanford Blood Center. The median ages of the multiple myeloma and healthy control groups were 66 and 64 years, respectively.
Serum processing
Serum was collected in red-top (no additive) blood collection tubes (BD Vacutainer Serum, No. 367812), incubated at room temperature for at least 30 min to induce clotting, and then processed within 4 h of collection. Processing consisted of centrifugation at 1,200 RCF for 10 min, followed by pipetting of the serum aliquots into cryovials and freezing at −80 °C.
Plasma processing
Blood collected in green-top (sodium heparin) blood collection tubes (BD Vacutainer) was subjected to centrifugation at 200 RCF for 10 min, and the plasma was removed into a 15-ml conical tube. The plasma was then further centrifuged at 1,000 RCF for 10 min, and the supernatant removed, aliquoted into cryovials, and frozen at −80 °C.
Luminex (polystyrene bead kits)
All assays were performed in the Human Immune Monitoring Center at Stanford University. Human 51-plex kits were purchased from Affymetrix and used according to the manufacturer’s recommendations with modifications as described below. Briefly, samples were mixed with antibody-linked polystyrene beads on 96-well filter-bottom plates and incubated at room temperature for 2 h followed by overnight incubation at 4 °C. Room temperature incubation steps were performed on an orbital shaker at 500–600 rpm. Plates were vacuum filtered, washed twice with wash buffer, and then incubated with biotinylated detection antibody for 2 h at room temperature. Samples were then filtered, washed twice as above, and resuspended in streptavidin-PE. After incubation for 40 min at room temperature, two additional vacuum washes were performed, and the samples resuspended in reading buffer. Each sample was measured in duplicate wells. Plates were read using a Luminex 200 instrument with a lower bound of 100 beads per sample per cytokine.
Luminex (magnetic bead kits)
Human 42-plex kits were purchased from EMD Millipore and used according to the manufacturer’s recommendations with modifications as described below. Briefly, samples or standards (6-point dilution) were mixed with antibody-linked magnetic beads on a 96-well plate and incubated overnight at 4 °C with shaking. Plates were washed twice with wash buffer in a Biotek ELx405 washer. Following a 1-h incubation at room temperature with biotinylated detection antibodies, streptavidin-PE was added for 30 min with shaking. Plates were washed as above, and PBS added to wells for reading in the Luminex 200 instrument, with a lower bound of 100 beads per sample per cytokine. Each sample was measured in duplicate.
MesoScale Discovery assays
Kits were purchased from MesoScale Discovery, and the protocol was followed as recommended. Briefly, antibody-coated 96-well plates were pre-incubated for 30 min with 25 μL/well of diluent 2. Sample or 7-point diluted calibrators were added, and plates were sealed and incubated at room temperature for 2.5 h with shaking. Plates were aspirated and washed three times with PBST (PBS + 0.05 % Tween-20). Twenty-five microliters of Sulfo-Tag secondary antibody in diluent 3 was then added, and the plate incubated for 2.5 h with shaking. Plates were washed three times in PBST as above, and 150 μL of 2× reading buffer was added. Plates were read immediately in the Sector Imager 2400.
Data analysis
xPONENT 3.1 software (Luminex Corp.) was used for data acquisition on the Luminex instrument. Output CSV files were analyzed with MasterPlex QT 2010 version 5.0.0.77 by MiraiBio (Hitachi Corp.). Sample names and dilution factors were added from an excel assay template. Standard wells were designated, and 7- or 6-point standard curves were generated with a 5PL (5-parameter logistic) algorithm and 1/Y2 weighting. This gives a higher weight to the low end of the standard curve, for possibly better quantitation of low-abundance analytes. A custom report was generated to include both MFI and pg/ml data.
MesoScale Discovery assays were analyzed directly with the manufacturer’s software, and raw intensity values were exported to Excel.
Results
Serum versus plasma
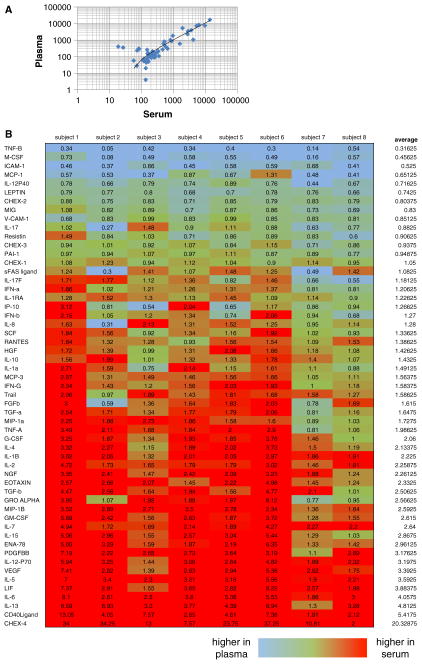
Limited comparisons of cytokine readouts in serum and plasma have shown different but roughly concordant results [7, 11–13], with occasional cytokines that differ systematically. We have expanded this comparison to include 51 cytokines and chemokines in a single Luminex kit. While we also find generally concordant results (Fig. 1a), there is a tendency for slightly higher signals in serum relative to plasma for a number of cytokines (Fig. 1b). This tendency, however, is variable both by donor and by cytokine. We found that the reproducibility of duplicate wells for both serum and plasma matrices was similar. Across all cytokines, the average coefficient of variation (CV) of duplicate wells was 4.9 % for serum (range 2–9.7 %) and 5.8 % for plasma (range 1.8–18.6 %).
Fig. 1.
a Correlation of median fluorescent intensity (MFI) of duplicate wells for plasma and serum samples from a representative healthy donor, for 51 cytokines analyzed in a single Luminex assay. Most cytokines are well correlated (ratio of plasma/serum values close to 1), with some spread at the low end of cytokine abundance and with a slightly higher average value for serum versus plasma. b Ratio of serum/plasma MFI for eight healthy donors analyzed for 51 cytokines in parallel in duplicate wells of serum or plasma. More cytokines show a higher value in serum than in plasma (red cells), but there is variability between donors
By comparing serum and plasma from multiple donors, it becomes clear that a simple “conversion factor” between serum and plasma cannot be derived, even on an individual cytokine basis. This is because the ratio of serum to plasma MFI varies significantly between donors (Fig. 1b), at least for many of the cytokines tested.
Of note, quality control beads (CHEX1-CHEX4, Radix Biosolutions, Inc.) were included in each well of these experiments. These beads allow for process control, by recording relative performance of the instrument, biotinylated detector, streptavidin-PE, and non-specific binding, respectively, across wells of an experiment. Non-specific binding, as measured by the CHEX4 beads, was markedly higher in serum than in plasma (Fig. 1b, bottom row).
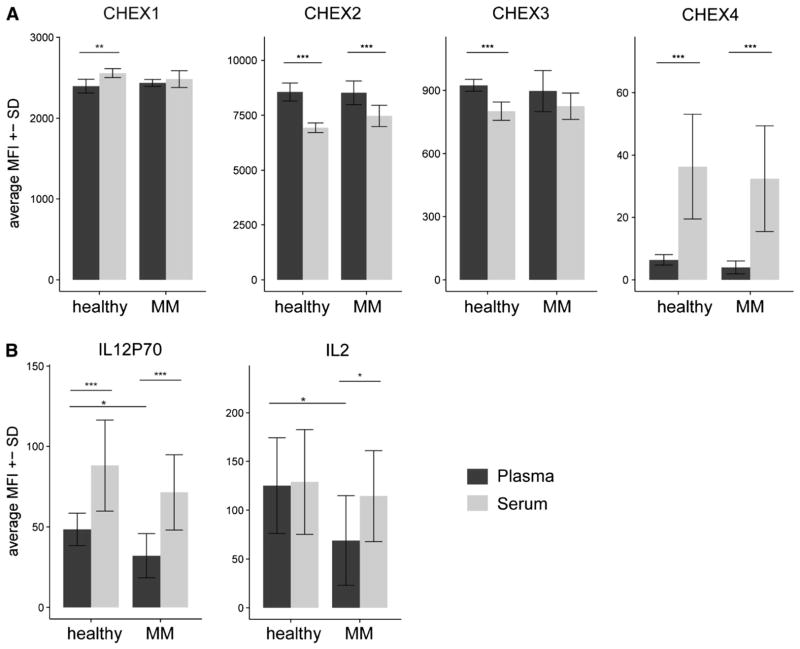
In order to determine whether plasma or serum might be superior in detecting low-level changes in cytokines associated with disease states, patients with multiple myeloma were compared to healthy controls, using a 51-plex Luminex assay of plasma or serum. We first looked at the relative levels of the CHEX control beads. While there were minor differences between groups (healthy and multiple myeloma), the most notable difference was in CHEX4, for which levels were significantly lower in plasma compared with serum samples, regardless of group (Fig. 2a). This indicates a lower level of non-specific binding in plasma relative to serum.
Fig. 2.
Plasma has a lower non-specific background and detects disease group differences that are not seen using serum. a CHEX control beads show similar average MFI between disease groups (healthy vs. MM). There are some significant differences between plasma and serum in CHEX1, 2, and 3. But most notably, CHEX 4, which assesses non-specific background, is significantly lower in plasma when compared to serum. b IL-12p70 and IL-2 show significantly higher plasma levels in healthy controls when compared to multiple myeloma patients. These differences are not significant in serum. IL-12p70 and IL-2 are low-level cytokines that decrease in disease groups relative to controls, and the lower non-specific background in plasma likely accounts for this. Significances were calculated using a two-sided Student’s t test. *p <0.05, **p <0.01, ***p <0.001. n = 6 (healthy), n = 10 (MM). MM = multiple myeloma
Most of the 51 cytokines measured were not significantly different between groups, when measured in serum or plasma. However, a subset of cytokines showed group-specific differences only in plasma, and not in serum, as shown for IL-12p70 and IL-2 in Fig. 2b. IL-2 and IL-12p70 levels were significantly different between healthy controls and multiple myeloma patients (p <0.05, two-sided Student’s t test) in plasma but not significantly different in serum. Given the higher non-specific binding seen in serum, it appeared that plasma was more sensitive for the detection of low-level differences in cytokines associated with this disease.
Matrix inhibitory effects
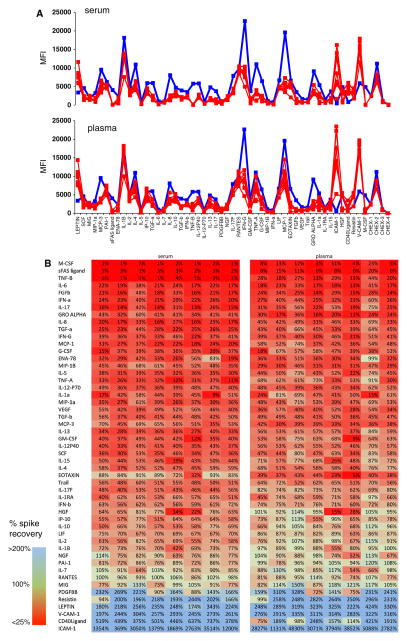
Previous studies have reported inhibition of detection for specific cytokines in the context of serum [6–10]. In recent years, vendors of immunoassay kits have in fact taken into account this phenomenon by diluting cytokine standards in a buffer that mimics the serum matrix. However, this does not improve the detection of cytokines in serum, but merely improves the quantitation of those cytokines that are already detectable despite the serum matrix. To determine the degree to which matrix inhibition can still be seen in serum and plasma, we performed spike recovery experiments using a standard diluted in serum from multiple donors, compared with the same standard diluted in its recommended standard buffer. The results (Fig. 3) show considerable inhibition for many cytokines in the presence of either serum or plasma, with some differences between donors. The percentage recovery for each cytokine is shown in Fig. 3b. It is apparent that many more cytokines are inhibited than not. Furthermore, there is a subset of cytokines (light green shading) for which the inhibition in plasma is slightly less than in serum.
Fig. 3.
a Inhibitory effects of serum and plasma on cytokine standards. S6 standard (containing 625 pg/ml of each of 51 cytokines) was run under various conditions. Serum (top graph) or plasma (bottom graph) from eight healthy donors was used in place of the manufacturer’s standard dilution buffer (red lines), or the standard dilution buffer was used (blue lines). Inhibitory effects can be seen for many cytokines in the presence of serum or plasma, in that the red lines are significantly lower than the blue lines for both matrices. Inhibitory effects of serum appear to be somewhat more pronounced than plasma for certain cytokines, and there is some variability between different donors. b Heat map of the same data, showing the percent spike recovery of the S6 standard in the presence of serum or plasma from eight donors. Cytokines are ranked from worst (red) to best (blue) spike recovery. Many more cytokines have poor spike recovery than good; those with values >100 % reflect the quantitation of endogenous cytokine from the serum or plasma, in addition to the S6 standard (Color figure online)
The inhibitory effect of the matrix is concentration-dependent and improves, but is not completely reversed, when either serum or plasma samples are diluted (data not shown).
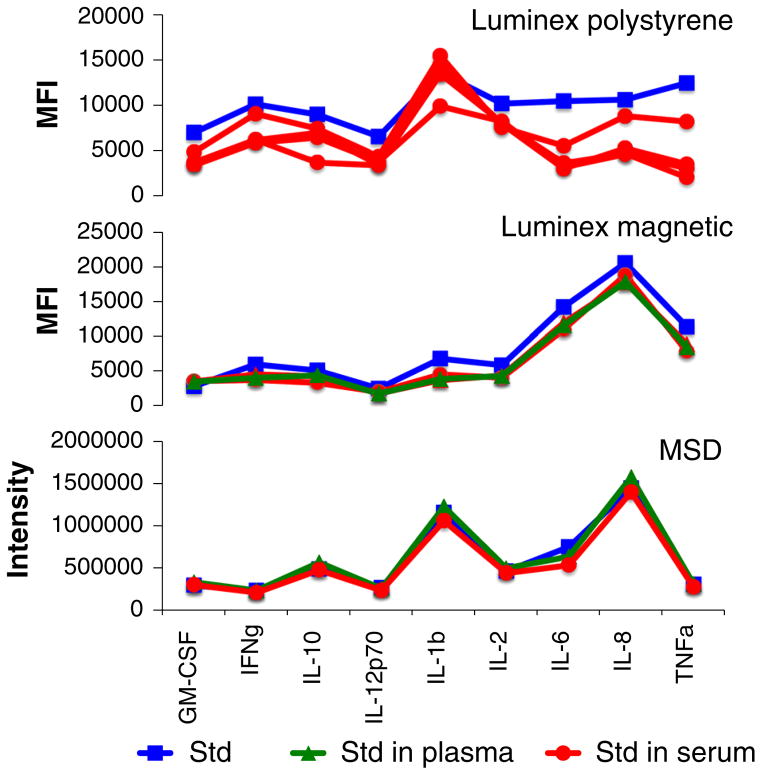
Of interest, we compared the matrix inhibitory effect of serum and plasma using two different Luminex platforms (polystyrene and magnetic beads) and using the electro-chemiluminescence platform from MesoScale Discovery (MSD). Spike recovery experiments were performed as shown in Fig. 3. We found that for the limited number of cytokines common to all three platforms, inhibition in serum or in plasma was highest in the Luminex polystyrene bead kit, lower in the Luminex magnetic bead kit, and almost undetectable in MSD assays (Fig. 4).
Fig. 4.
Matrix effect in Luminex versus MesoScale Discovery (MSD) platforms. Cytokine standards were run using the manufacturer’s standard dilution buffer (blue squares) or with the buffer replaced by serum (red circles) or plasma (green triangles) of healthy donors. Standards contained 2,500 pg/ml (MSD and Luminex polystyrene bead kit) or 2,000 pg/ml (Luminex magnetic bead kit) of all cytokines (Color figure online)
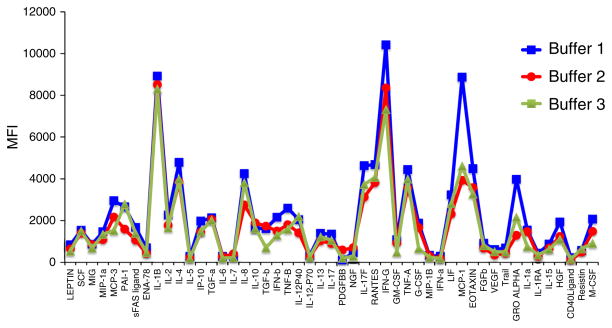
To determine whether this platform difference was a result of the dilution buffers used in the various assays, we compared the readouts of Luminex standards in the dilution buffers for each platform (polystyrene and magnetic bead Luminex and MSD). The results (Fig. 5) show that there are indeed differences in the degree to which these buffers inhibit the standard signal. However, for most cytokines, these differences are minor and are not sufficient to account for the differences in spike recovery seen in Fig. 4.
Fig. 5.
Effect of different assay buffers on standard detection. Buffers intended for dilution of standards from MSD, Luminex (magnetic bead), and Luminex (polystyrene bead) kits were used to dilute the same S5 standard (representing 156.25 pg/ml of each of 51 cytokines). The buffers show generally similar patterns of cytokine detection, but the degree to which “Buffer 2” (MSD kit) and “Buffer 3” (Luminex magnetic bead kit) inhibit cytokine detection is greater than that for “Buffer 1” (Luminex polystyrene bead) in certain cases
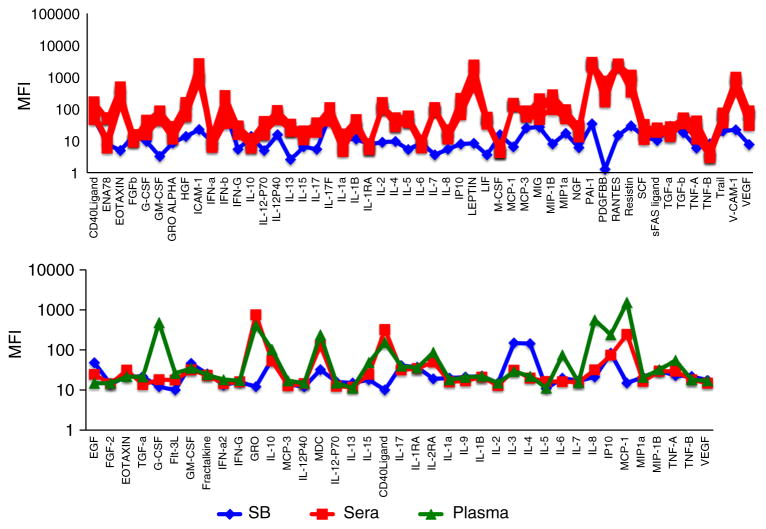
Another way to gauge the inhibition of cytokine detection in serum or plasma is to compare such samples to a buffer control. For a subset of cytokines, serum or plasma samples show lower readouts than the sample buffer (Fig. 6). This reinforces the notion that serum and plasma inhibit these cytokine readouts and imply that subtraction of “background” buffer values is not appropriate; this has also been previously reported [14].
Fig. 6.
Serum and plasma samples from healthy donors are sometimes lower than sample buffer (background). Serum (red squares) or plasma (green triangles) from several healthy donors was diluted 1:3 and run in a 51-plex polystyrene bead Luminex assay (Affymetrix, top panel) or a 39-plex magnetic bead Luminex assay (Millipore, bottom panel). MFI values are shown, compared with those of the sample buffer (blue diamonds). A few cytokines show significantly lower values in serum or plasma compared with the sample buffer (e.g., EGF, GM-CSF, IL-3, and IL-4) (Color figure online)
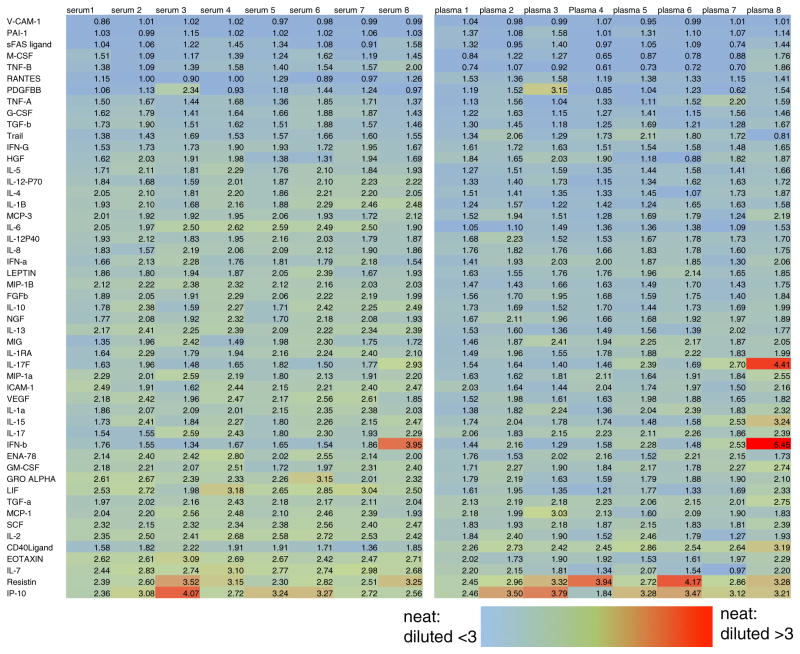
Finally, to attempt to mitigate the inhibitory effect of serum and plasma on cytokine readouts, we performed dilution experiments. As seen by the MFI ratios (neat/diluted) in Fig. 7, 1:3 dilution of serum or plasma samples was nonlinear for most cytokines; in general, 1:3 diluted samples registered less than a threefold decrease in MFI (blue color in Fig. 7). Like the serum/plasma comparison, this effect was somewhat variable by donor, suggesting that inhibitors in the matrix are present at varying abundance across individuals. Overall, there was not a large difference in this dilution nonlinearity between serum and plasma, though there was a very slight tendency for plasma to show more nonlinearity for some cytokines. This may relate to the fact that these cytokines are already very near the limit of detection of the assay.
Fig. 7.
Dilution of serum or plasma is nonlinear. Heat map shows the ratio of MFI of neat/diluted (1:3 in PBS) plasma and serum samples from eight subjects. Most cytokines show a nonlinear dilution pattern, in which diluted samples have greater than 1/3 the MFI of neat samples. The effect may be slightly more pronounced in plasma and is also variable between donors (Color figure online)
Discussion
In this study, we have examined the effect of serum and plasma matrices on multiplexed immunoassays (Luminex and MSD). Like others [7, 11–13], we find that levels of these cytokines are only roughly correlated (Fig. 1) and that there is a subset of cytokines that has a higher readout in serum than in plasma. This may relate to a higher non-specific background observed in serum (Fig. 2). This non-specific background may explain why low-level changes in cytokines that might be associated with disease were only detected in plasma, and not in serum (Fig. 2).
We also show, through spike recovery experiments, that plasma and serum both have significant inhibitory effects, that are variable between individuals, and that are only partially compensated for by the manufacturer’s standard dilution buffer (Figs. 3, 4, 5). However, serum appears to have a slightly greater inhibitory effect for some cytokines. Interestingly, this matrix effect is not seen, or seen to a much lesser extent, in the MSD assay compared with either magnetic or polystyrene bead Luminex assays (Fig. 4). This does not appear to be solely a consequence of the assay buffers (Fig. 5).
Given the lower non-specific background, ability to detect low-level changes in cytokine abundance, and slightly reduced matrix inhibition seen in plasma, it would seem reasonable to recommend the use of plasma when possible for multiplex cytokine assays. However, there are caveats to this conclusion, in that preparation methods are key to preserving cytokine stability. Delays in processing of serum or plasma can adversely affect cytokine detection, as can sample hemolysis, the presence of debris, or freeze–thaw cycles [7]. Also, the plasma used in this study was derived from sodium-heparinized blood. Comparisons of anticoagulant have shown some cytokine-specific differences [7, 11], with EDTA possibly being preferable to heparin in some cases. Further, there are cytokines that showed higher levels in serum, so the choice would also depend upon the targets of most interest. Most published data on disease-related systemic cytokine levels have been acquired from serum samples. Using plasma instead of serum might unravel differences at the lower end of the assay’s detection limit that have so far been concealed by higher background levels in serum samples.
Given the inhibitory effects of plasma and serum matrices and the highly nonlinear effect of dilution (Fig. 7), it may be preferable to run samples at a 1:3 dilution rather than neat. In addition to sparing samples, this practice also helps to prevent clogging of the Luminex instrument, due to bead aggregation. We have found aggregation to be particularly problematic in plasma, especially if it is sub-optimally prepared (data not shown).
At least as important as the choice of matrix (serum or plasma) and dilution are the implications of these studies on the reporting of immunoassay results. While the field almost universally uses a standard curve to calculate cytokine concentrations, our data would suggest that this is a very imperfect approximation. First, there are significant inhibitory effects of both plasma and serum that are not fully compensated by the standard buffer(s). These effects are slightly different in serum and plasma and also vary between individuals, making a universally accurate calculation based on a standard impossible. It would be much preferable to relate immunoassay data as relative changes in mean intensity, compared with a control or other comparison sample. Of course, all samples need to be from the same matrix (serum or plasma) to be reliably compared.
Finally, since dilution of serum and plasma samples results in highly nonlinear data, which vary by individual, one cannot back-calculate a concentration (or even an expected intensity) for a neat sample based on a diluted sample. As a result, all samples to be compared should be diluted identically.
While simple, these recommendations run counter to widely held assumptions in the immunoassay field. Researchers often interpret concentration results from these assays as absolute values, which they are not. Even those who appreciate the inhibitory effects of serum and plasma may not realize that these vary by individual, and are differentially accounted for by the provided buffers for standard dilution. For some cytokines, the concentration readouts are still grossly underestimated. It is also tempting to assume that plasma and serum should be largely interchangeable and that assays are linear with dilution; the present work shows that these assumptions most definitely are not true. In conclusion, we would suggest that investigators: (1) use plasma where possible, or compare serum and plasma in a subset of samples before proceeding; (2) be sure all samples to be compared are processed identically (serum/plasma, sample handling, and dilution factor); (3) consider running at a 1:3 dilution, especially for plasma samples; and (4) report relative intensity values, without background subtraction, rather than calculated concentrations.
Acknowledgments
This study was supported by Grants 5U19AI057229 and 5U19AI090019 from the NIAID, NIH. Leo Hansmann is supported by a research fellowship from the German Research Foundation (DFG). We thank Cindy Huynh for technical services.
Footnotes
Conflict of interest The authors declare that they have no conflict of interest.
Contributor Information
Yael Rosenberg-Hasson, Institute for Immunity, Transplantation, and Infection, Stanford University School of Medicine, Stanford, CA 94305, USA.
Leo Hansmann, Department of Microbiology and Immunology, Stanford University School of Medicine, Stanford, CA 94305, USA.
Michaela Liedtke, Division of Hematology, Department of Medicine, Stanford University School of Medicine, Stanford, CA 94305, USA.
Iris Herschmann, Institute for Immunity, Transplantation, and Infection, Stanford University School of Medicine, Stanford, CA 94305, USA.
Holden T. Maecker, Email: maecker@stanford.edu, Institute for Immunity, Transplantation, and Infection, Stanford University School of Medicine, Stanford, CA 94305, USA. Department of Microbiology and Immunology, Stanford University School of Medicine, Stanford, CA 94305, USA
References
- 1.Djoba Siawaya JF, Roberts T, Babb C, Black G, Golakai HJ, Stanley K, Bapela NB, Hoal E, Parida S, van Helden P, Walzl G. An evaluation of commercial fluorescent bead-based Luminex cytokine assays. PLoS ONE. 2008;3:e2535. doi: 10.1371/journal.pone.0002535. [DOI] [PMC free article] [PubMed] [Google Scholar]
- 2.duPont NC, Wang K, Wadhwa PD, Culhane JF, Nelson EL. Validation and comparison of luminex multiplex cytokine analysis kits with ELISA: determinations of a panel of nine cytokines in clinical sample culture supernatants. J Reprod Immunol. 2005;66:175–91. doi: 10.1016/j.jri.2005.03.005. [DOI] [PMC free article] [PubMed] [Google Scholar]
- 3.Pang S, Smith J, Onley D, Reeve J, Walker M, Foy C. A comparability study of the emerging protein array platforms with established ELISA procedures. J Immunol Methods. 2005;302:1–12. doi: 10.1016/j.jim.2005.04.007. [DOI] [PubMed] [Google Scholar]
- 4.Breen EC, Reynolds SM, Cox C, Jacobson LP, Magpantay L, Mulder CB, Dibben O, Margolick JB, Bream JH, Sambrano E, Martinez-Maza O, Sinclair E, Borrow P, Landay AL, Rinaldo CR, Norris PJ. Multisite comparison of high-sensitivity multiplex cytokine assays. Clin Vaccine Immunol. 2011;18:1229–42. doi: 10.1128/CVI.05032-11. [DOI] [PMC free article] [PubMed] [Google Scholar]
- 5.Maecker HT. Measuring human cytokines. In: O’Gorman MR, Donnenberg AD, editors. Handbook of human immunology. 2. Boca Raton, FL: CRC Press; 2008. pp. 517–40. [Google Scholar]
- 6.Martins TB, Pasi BM, Litwin CM, Hill HR. Heterophile antibody interference in a multiplexed fluorescent microsphere immunoassay for quantitation of cytokines in human serum. Clin Diagn Lab Immunol. 2004;11:325–9. doi: 10.1128/CDLI.11.2.325-329.2004. [DOI] [PMC free article] [PubMed] [Google Scholar]
- 7.de Jager W, Bourcier K, Rijkers GT, Prakken BJ, Seyfert-Margolis V. Prerequisites for cytokine measurements in clinical trials with multiplex immunoassays. BMC Immunol. 2009;10:52. doi: 10.1186/1471-2172-10-52. [DOI] [PMC free article] [PubMed] [Google Scholar]
- 8.Phillips DJ, League SC, Weinstein P, Craig Hooper W. Interference in microsphere flow cytometric multiplexed immunoassays for human cytokine estimation. Cytokine. 2006;36:180–8. doi: 10.1016/j.cyto.2006.12.002. [DOI] [PubMed] [Google Scholar]
- 9.Tate J, Ward G. Interferences in immunoassay. Clin Biochem Rev. 2004;25:105–20. [PMC free article] [PubMed] [Google Scholar]
- 10.Miller JJ. Interference in Immunoassays: Avoiding erroneous results. Clin Lab Int. 2004;28:14–17. [Google Scholar]
- 11.Chaturvedi AK, Kemp TJ, Pfeiffer RM, Biancotto A, Williams M, Munuo S, Purdue MP, Hsing AW, Pinto L, McCoy JP, Hildesheim A. Evaluation of multiplexed cytokine and inflammation marker measurements: a methodologic study. Cancer Epidemiol Biomark Prev. 2011;20:1902–11. doi: 10.1158/1055-9965.EPI-11-0221. [DOI] [PMC free article] [PubMed] [Google Scholar]
- 12.Wong HL, Pfeiffer RM, Fears TR, Vermeulen R, Ji S, Rabkin CS. Reproducibility and correlations of multiplex cytokine levels in asymptomatic persons. Cancer Epidemiol Biomark Prev. 2008;17:3450–6. doi: 10.1158/1055-9965.EPI-08-0311. [DOI] [PubMed] [Google Scholar]
- 13.Dossus L, Becker S, Achaintre D, Kaaks R, Rinaldi S. Validity of multiplex-based assays for cytokine measurements in serum and plasma from “non-diseased” subjects: Comparison with ELISA. J Immunol Methods. 2009;350:125–32. doi: 10.1016/j.jim.2009.09.001. [DOI] [PubMed] [Google Scholar]
- 14.Jacobson JW, Oliver KG, Weiss C, Kettman J. Analysis of individual data from bead-based assays (“bead arrays”) Cytometry. 2006;69A:384–90. doi: 10.1002/cyto.a.20293. [DOI] [PubMed] [Google Scholar]


