Abstract
The aim of this study was to assess the feasibility of using a commercially available high-resolution adaptive optics (AO) camera to image the cone mosaic in Japanese macaques (Macaca fuscata) with dominantly inherited drusen. The macaques examined develop drusen closely resembling those seen in humans with age-related macular degeneration (AMD). For each animal, we acquired and processed images from the AO camera, montaged the results into a composite image, applied custom cone-counting software to detect individual cone photoreceptors, and created a cone density map of the macular region. We conclude that flood-illuminated AO provides a promising method of visualizing the cone mosaic in nonhuman primates. Future studies will quantify the longitudinal change in the cone mosaic and its relationship to the severity of drusen in these animals.
Keywords: Cone density imaging, adaptive optics, flood-illuminated adaptive optics, AMD
39.1 Introduction
Age-related macular degeneration (AMD) is the leading cause of irreversible blindness in people over the age of 50 in the developed world. Its prevalence is projected to increase more than 50% by the year 2020 [1]. The early stages of AMD are characterized by an increased frequency of drusen deposits under the retinal pigment epithelium [2]. While recent work has garnered a more detailed understanding of AMD, disease treatment and/or prevention research is currently hampered by the lack of animal models that accurately mimic the manifestation and progression of this disease in humans. We have identified a line of Japanese macaques with drusen that begin to appear early in life and increase in number and size with age. This phenotype displays an autosomal dominant inheritance pattern.
Another hindrance to understanding AMD is the low image resolution of commonly used retinal imaging systems such as the traditional scanning laser ophthalmoscope. Adaptive optics (AO) imaging, which corrects for the wavefront aberrations of the eye, provides a significant increase in retinal imaging resolution and enables the noninvasive, visualization of individual cone photoreceptor cells in vivo. Previous work with AO imaging has demonstrated the ability to image the cone mosaic in human subjects [3]. We used a new commercially available flood-illuminated AO camera to determine the feasibility of imaging and quantifying the cone mosaic in Japanese macaques with dominantly inherited drusen.
39.2 Materials and Methods
All procedures were approved by the Institutional Animal Care and Use Committee at Oregon Health & Science University and conformed to NIH guidelines and the ARVO Statement for the Use of Animals in Ophthalmic and Vision Research.
39.2.1 Subjects
The subjects were 20 Japanese macaques aged 4–19 years old with a wide range of drusen severity. All were selected from the Japanese macaque colony resident since 1965 at the Oregon Regional Primate Research Center.
39.2.2 Anesthesia
Animals were sedated with Ketamine (5–15 mg/kg) or Telazol (3–5 mg/kg) followed by endotracheal intubation and the administration of 1–3% isoflurane vaporized in 100% oxygen adjusted as needed, to inhibit eye movement. Pupils were dilated with 2–3 applications of 1% tropicamide and 2.5% phenylephrine. Heart rate and peripheral oxygen saturation were monitored and maintained at normal levels throughout the imaging sessions.
39.2.3 Fundus Photography
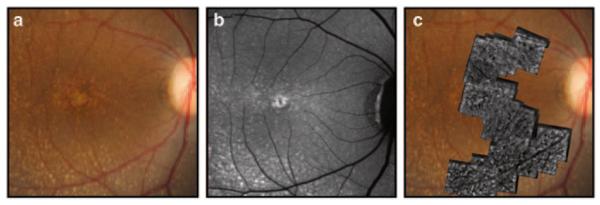
Retinal color and autofluorescence fundus photographs were taken of each macaque prior to AO imaging (Fig. 39.1a, b). After anesthesia and pupil dilation, images of the macula and near periphery (nasal, temporal, superior, and inferior quadrants) were acquired with a digital retinal camera system (F450, Carl Zeiss AG, Oberkochen, Germany).
Fig. 39.1.

a A fundus photograph of a Japanese macaque with severe drusen. b An autofluorecence image of the same animal. c A corresponding AO montage overlaid on the fundus photograph
39.2.4 Adaptive Optics Image Acquisition
Anesthetized Japanese macaques were imaged using the rtx1 AO Retinal Camera (Imagine Eyes SA, Orsay, France). The animals were placed prone on an adjustable table. The head was positioned vertically with one eye in front of the imaging beam aperture. A Barraquer wire speculum was placed in the eye to be imaged and followed by the insertion of a plano-contact lens. Balanced salt solution or artificial tears were applied as needed.
39.2.5 Axial Length Measurement
At the conclusion of image acquisition, ten of the sedated monkeys were repositioned in front of an IOLMaster 500 (Carl Zeiss AG, Oberkochen, Germany). Axial length measurements were obtained after removing the contact lens and treating the eye with artificial tears.
39.2.6 Image Processing and Montaging
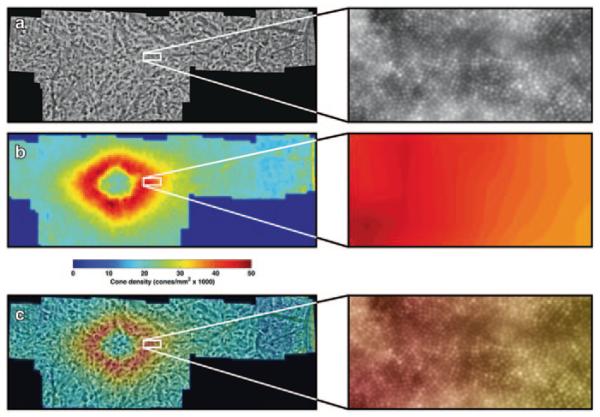
The raw images acquired from the AO camera were automatically processed using software provided by Imagine Eyes. This software registers the 40 frames that were acquired for each image. The processed images for each subject were then montaged automatically into a wide-field composite image using i2k Retina (version 1.3.8; DualAlign LLC, Clifton Park, NY, USA) (Figs. 39.1c, 39.2a). The final montage spanned a variable field of the central macula based upon the number of images acquired. Particularly blurry or poor resolution images were omitted from the mosaic.
Fig. 39.2.
Example results from one animal. The areas highlighted by white squares are shown in detail to the right. a A montaged image showing the visibility of cones in the retina. b A cone density map created using the automated counting algorithm. c The density map overlaid on the original montage
39.2.7 Cone Identification and Cone Density Measurements
For identification of cones, a modified, automatic version of the semi-automated cone photoreceptor identification software described by Li and Roorda was applied to the entire montage [4]. Li and Roorda’s method applied a finite-impulse-response (FIR) low-pass filter to the retinal image and then identified local maxima of the filtered image [4]. As described by Garrioch et al., setting the cutoff frequency of the FIR filter manually can result in drastic differences in performance [5]. However, the further automated method described by Garrioch et al. is currently too computationally intensive to reasonably be applied to a full retinal montage [5]. For this reason, we empirically determined a single cutoff frequency for the FIR filter that yielded good cone identification accuracy in all retinal montages (Fig. 39.2a). Cone density was measured in both angular and metric units. Angular units were converted to metric units by using the measured axial length of each subject [6].
39.2.8 Density Maps
Two-dimensional depictions of cone photoreceptor density were created using a custom MATLAB (release 2011b, MathWorks, Natick, MA, USA) algorithm to visualize spatial distribution of cones across the retinal montage. Each retinal montage was spatially quantized at one bin per degree of eccentricity, or 25 bins per square degree. The final density map was created by counting the number of identified cones in each bin, normalizing by the bin area, and color-coding the bins based on the relative cone density (Fig. 39.2b, c).
39.2.9 Regional Cone Density Analysis
We employed two methods to quantify the cone density of the different regions of the retina. The first method measured of average cone density within the superior, inferior, nasal, and temporal quadrants of the retina (Fig. 39.3a). Cone density in each quadrant was quantified from the foveal center to 5 degrees eccentricity in steps of 0.2 degrees. The foveal center for each animal was manually estimated from the cone density maps, and the quadrants were identified using the location of the optical nerve. The second method averaged the cone density in the annulus region from 1.6 to 3.1 degrees eccentricity. This region contained the peak cone density along with a small surrounding neighborhood among all animals, and was used as an aggregate outcome measure for regression analysis.
Fig. 39.3.

A cone density map marked to demonstrate the regions analyzed in this study. Quadrants are labeled by letter (N = nasal, S = superior, T = temporal, I = inferior). The white circles represent eccentricity increments of 1 degree, and the black circles outline the annulus between 1.5 to 3.1 degrees. b The cone density versus retinal eccentricity in each quadrant for one animal. For the superior quadrant, the region of valid data ended at 3.5 degrees. c The cone density trend shows a slight, although not significant (p = 0.1669), decrease with age. Each point represents the average cone density in the 1.5–3.1 degree annulus for one of the 20 subjects
39.3 Results
The axial length among 10 subjects was 19.75 ± 0.38 mm. Cone density, measured in 20 animals, exhibited an elliptical pattern (Fig. 39.3a) and generally decreased with retinal eccentricity, although there was an artificial decline within approximately 1.5 degrees where the tightly packed foveal cones were too small to be resolved by the AO camera (Fig. 39.3b). The results for the average cone density in each quadrant from 1.6 to 3.1 degrees eccentricity (corresponding to 0.35–0.73 mm for a 19.75 mm axial length) within each quadrant are listed in Table 39.1. The nasal quadrant had the highest cone density followed by the temporal, inferior, and superior quadrants. Linear regression analysis revealed no significant relationship between age and cone density (Fig. 39.3c; R2 = 0.1034; linear coefficient t-test p-value = 0.1669).
Table 39.1.
Mean cone densities in an annulus spanning the region covering 1.6–3.1 degrees eccentricity from the fovea. Values are provided in cones/mm2 for the four regions of the retina and the total annulus
| Region | Mean cone density (cones/mm2) | Standard deviation (cones/mm2) |
|---|---|---|
| Temporal | 31,397 | 4,830 |
| Inferior | 31,193 | 5,310 |
| Nasal | 31,497 | 5,335 |
| Superior | 27,192 | 5,212 |
| Total (n=20) | 30,303 | 4,688 |
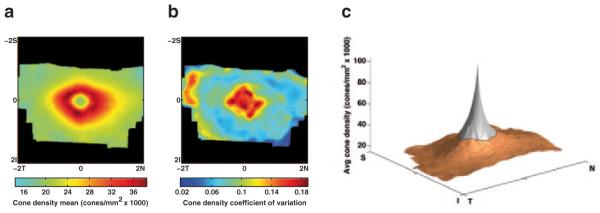
The overall coefficient of variation among all 20 animals was 0.1116 within the defined annulus, indicating the cone density variation was quite small. The average cone density map, created by aligning the individual maps among the 10 subjects for which axial lengths were measured, exhibits an elliptical pattern with a tendency toward higher density in the nasal quadrant (Fig. 39.4a). The map of coefficient of variation among these 10 subjects confirms the low variation in cone densities measured in this group (Fig. 39.4b).
Fig. 39.4.

The mean cone density map among the 10 Japanese macaques for which axial lengths were measured. b The map of the coefficient of variation among the same 10 animals. c A 3D representation of the mean density map with extrapolated data in the foveola (gray region) using one possible model. The extrapolation model was α/r, where r was the radius from the foveal center and α was estimated from the region of valid data (orange)
39.4 Discussion
We demonstrate that a commercially available flood-illuminated AO retinal imaging device is capable of imaging the cone mosaic in a line of Japanese macaques with drusen. Furthermore, our automated cone counting algorithm, which was originally developed to detect cones in AO images of human subjects, was able to detect cones accurately in images from this species and permits the efficient regional analysis of cone density and the visualization of the cone mosaic (Fig. 39.3). However, many challenges remain in obtaining quality images from sedated monkeys using flood-illuminated AO. Limited anesthetic time, motion from the breathing of the animal, and loss of corneal clarity can result in reduced image quality and smaller retinal coverage.
To our knowledge, no in vivo studies of the Japanese macaque cone mosaic have been performed, but detailed studies of the rhesus macaque (Macaca mulatta) do exist [7, 8]. We found the axial lengths of the Japanese macaques to be significantly greater than those of rhesus macaques [9], consistent with their larger body size. As previously observed in rhesus macaques, our axial length measurements suggest a slight trend of male Japanese macaques having larger eyes than females, consistent with differences in body size (19.91 ± 0.28 mm vs. 19.59 ± 0.42 mm) [8, 9]. Our measurements of cone density (Table 39.1) fall below the cone density values measured stereologically in fixed sections of the rhesus monkey retina as reported by Wikler et al. [7]. It is well-established that cone density decreases with increasing eccentricity in macaques [10] as in humans.
Previous work by Ordy et al. showed a significant decrease in histologically measured cone density between middle-aged (12–15 years) and older (18–24 years) macaques [11]. Our study did not find any significant change in density with increasing age, although this may be due to the oldest subjects in our study being younger than most of the subjects in Ordy’s older group. Ordy et al. [11] did not see a significant change in visual acuity or cone density between the young adult (4–6 years) and middle-aged macaques, in accordance with our observations (Fig. 39.3c).
Going forward, our work will focus on measuring longitudinal changes in the cone mosaic in regions with and without drusen and correlating cone density changes with drusen load and fat content in the diet. We will also explore mathematical models of cone density in Japanese macaques to extrapolate the density maps in the foveola where the AO camera cannot resolve cones. This may lead to 3D representations of the cone density throughout the entire fovea (Fig. 39.4c). Models will be chosen based on empirical evidence gathered from histological and stereological examinations of Japanese macaque retinal tissue.
Acknowledgments
Funding Pfizer Ophthalmology External Research Unit, The Foundation Fighting Blindness CDA (MEP), Research to Prevent Blindness (Unrestricted grant to Casey Eye Institute, CDA to MEP), NIH grant P51OD011092 (MN), K08 EY021186-01 (MEP).
Contributor Information
Mark E. Pennesi, Department of Ophthalmology, Casey Eye Institute, Oregon Health & Science University, 3375 SW Terwilliger Blvd, Portland, OR 97239, USA
Anupam K. Garg, Department of Ophthalmology, Casey Eye Institute, Oregon Health & Science University, 3375 SW Terwilliger Blvd, Portland, OR 97239, USA
Shu Feng, Department of Ophthalmology, Casey Eye Institute, Oregon Health & Science University, 3375 SW Terwilliger Blvd, Portland, OR 97239, USA.
Keith V. Michaels, Department of Ophthalmology, Casey Eye Institute, Oregon Health & Science University, 3375 SW Terwilliger Blvd, Portland, OR 97239, USA
Travis B. Smith, Department of Ophthalmology, Casey Eye Institute, Oregon Health & Science University, 3375 SW Terwilliger Blvd, Portland, OR 97239, USA
Jonathan D. Fay, Department of Ophthalmology, Casey Eye Institute, Oregon Health & Science University, 3375 SW Terwilliger Blvd, Portland, OR 97239, USA
Alison R. Weiss, Division of Neuroscience, Oregon National Primate Research Center, Oregon Health & Science University, Beaverton, OR, USA
Laurie M. Renner, Division of Neuroscience, Oregon National Primate Research Center, Oregon Health & Science University, Beaverton, OR, USA
Sawan Hurst, Division of Neuroscience, Oregon National Primate Research Center, Oregon Health & Science University, Beaverton, OR, USA.
Trevor J. McGill, Department of Ophthalmology, Casey Eye Institute, Oregon Health & Science University, 3375 SW Terwilliger Blvd, Portland, OR 97239, USA
Anda Cornea, Division of Neuroscience, Oregon National Primate Research Center, Oregon Health & Science University, Beaverton, OR, USA.
Kay D. Rittenhouse, External R&D Innovations, Pfizer Inc., Cambridge, MA, USA
Marvin Sperling, External R&D Innovations, Pfizer Inc., Cambridge, MA, USA.
Joachim Fruebis, External R&D Innovations, Pfizer Inc., Cambridge, MA, USA.
Martha Neuringer, Department of Ophthalmology, Casey Eye Institute, Oregon Health & Science University, 3375 SW Terwilliger Blvd, Portland, OR 97239, USA; Division of Neuroscience, Oregon National Primate Research Center, Oregon Health & Science University, Beaverton, OR, USA.
References
- 1.Jager RD, Mieler WF, Miller JW. Age-related macular degeneration. New Eng J Med. 2008;358(24):2606–2617. doi: 10.1056/NEJMra0801537. [DOI] [PubMed] [Google Scholar]
- 2.de Jong PT. Age-related macular degeneration. New Eng J Med. 2006;355(14):1474–1485. doi: 10.1056/NEJMra062326. [DOI] [PubMed] [Google Scholar]
- 3.Liang J, Williams DR, Miller DT. Supernormal vision and high-resolution retinal imaging through adaptive optics. J Opt Soc Am A Opt Image Sci Vis. 1997;14(11):2884–2892. doi: 10.1364/josaa.14.002884. [DOI] [PubMed] [Google Scholar]
- 4.Li KY, Roorda A. Automated identification of cone photoreceptors in adaptive optics retinal images. J Opt Soc Am A Opt Image Sci Vis. 2007;24(5):1358–1363. doi: 10.1364/josaa.24.001358. [DOI] [PubMed] [Google Scholar]
- 5.Garrioch R, Langlo C, Dubis AM, Cooper RF, Dubra A, Carroll J. Repeatability of in vivo parafoveal cone density and spacing measurements. Optom Vis Sci. 2012;89(5):632–643. doi: 10.1097/OPX.0b013e3182540562. [DOI] [PMC free article] [PubMed] [Google Scholar]
- 6.Bennett AG, Rudnicka AR, Edgar DF. Improvements on Littmann’s method of determining the size of retinal features by fundus photography. Graefes Arch Clin Exp Ophthalmol. 1994;232(6):361–367. doi: 10.1007/BF00175988. [DOI] [PubMed] [Google Scholar]
- 7.Wikler KC, Williams RW, Rakic P. Photoreceptor mosaic: number and distribution of rods and cones in the rhesus monkey retina. J Comp Neurol. 1990;297(4):499–508. doi: 10.1002/cne.902970404. [DOI] [PubMed] [Google Scholar]
- 8.Fernandes A, Bradley DV, Tigges M, Tigges J, Herndon JG. Ocular measurements throughout the adult life span of rhesus monkeys. Invest Ophthalmol Vis Sci. 2003;44(6):2373–2380. doi: 10.1167/iovs.02-0944. [DOI] [PubMed] [Google Scholar]
- 9.Qiao-Grider Y, Hung LF, Kee CS, Ramamirtham R, Smith EL., 3rd Normal ocular development in young rhesus monkeys (Macaca mulatta) Vision Res. 2007;47(11):1424–1444. doi: 10.1016/j.visres.2007.01.025. [DOI] [PMC free article] [PubMed] [Google Scholar]
- 10.Curcio CA, Sloan KR, Kalina RE, Hendrickson AE. Human photoreceptor topography. J Comp Neurol. 1990;292(4):497–523. doi: 10.1002/cne.902920402. [DOI] [PubMed] [Google Scholar]
- 11.Ordy JM, Brizee KR, Hansche J. Visual acuity and foveal cone density in the retina of the aged rhesus monkey. Neurobiol Aging. 1980;1(2):133–140. doi: 10.1016/0197-4580(80)90006-8. [DOI] [PubMed] [Google Scholar]


