

Abstract
A central tenet of motor neuroscience is that the cerebellum learns from sensory prediction errors. Surprisingly, neuroimaging studies have not revealed definitive signatures of error processing in the cerebellum. Furthermore, neurophysiologic studies suggest an asymmetry, such that the cerebellum may encode errors arising from unexpected sensory events, but not errors reflecting the omission of expected stimuli. We conducted an imaging study to compare the cerebellar response to these two types of errors. Participants made fast out-and-back reaching movements, aiming either for an object that delivered a force pulse if intersected or for a gap between two objects, either of which delivered a force pulse if intersected. Errors (missing the target) could therefore be signaled either through the presence or absence of a force pulse. In an initial analysis, the cerebellar BOLD response was smaller on trials with errors compared with trials without errors. However, we also observed an error-related decrease in heart rate. After correcting for variation in heart rate, increased activation during error trials was observed in the hand area of lobules V and VI. This effect was similar for the two error types. The results provide evidence for the encoding of errors resulting from either the unexpected presence or unexpected absence of sensory stimulation in the human cerebellum.
Introduction
The cerebellum is thought to contribute to sensorimotor control by implementing a forward model that predicts sensory input (Wolpert et al., 1998). This internal model, and the consequent motor output, is fine-tuned by error signals reflecting the difference between expected and observed input (Tseng et al., 2007). In agreement with this hypothesis, cerebellar damage leads to deficits in sensorimotor adaptation tasks (Martin et al., 1996; Maschke et al., 2004; Smith and Shadmehr, 2005; Morton and Bastian, 2006; Tseng et al., 2007; Golla et al., 2008).
Neuroimaging has provided inconsistent evidence concerning the cerebellar representation of prediction errors. Studies have shown a higher hemodynamic response in the cerebellum early during learning, when errors are prevalent (Imamizu et al., 2000). However, the interpretation of this signal is problematic, since there is also an increase in movement during this epoch to correct these errors. Studies designed to explicitly equate kinematics (Desmurget et al., 1998, 2000; Krakauer et al., 2004; Diedrichsen et al., 2005a; Schmitz et al., 2005) failed to observe error-related activation within the cerebellum. In the present study, we revisit this issue, comparing trials in which movements with and without sensory prediction errors are matched.
There are at least two schemes by which the cerebellum may encode sensory prediction errors. The cerebellum may process errors conveyed as unexpected sensory events, for example, accidentally brushing one's arm against the tabletop when reaching for a glass. Alternatively, the cerebellum may represent errors more generally, signaling both the occurrence of unexpected stimuli and the omission of expected stimuli (e.g., missing the glass entirely). In support of a restrictive scheme, climbing fibers signal unexpected air puffs during eyeblink conditioning (McCormick et al., 1985; Mauk et al., 1986), but not the unexpected absence of the puff during extinction (McCormick et al., 1985). Similarly, in cats trained to make reaching movements, olivary responses were observed when an unexpected obstacle was encountered during the reach, but not when the cat missed the target (Horn et al., 2004). However, another notable study observed an increase in complex spike activity when cats missed an expected rung on a ladder, indicating that the cerebellum is capable of encoding the omission of expected stimulation (Andersson and Armstrong, 1987).
We explore this issue directly, examining the hemodynamic response in the cerebellum during reaching movements. By varying participants' expectations, prediction errors could manifest as either the presence of an unexpected force pulse or the absence of an expected pulse. We asked whether the cerebellar blood oxygenation level-dependent (BOLD) signal, which reflects a combination of mossy and climbing fiber inputs to the cerebellum (Diedrichsen et al., 2010), increases in response to sensory prediction errors in general, or only to unexpected sensory stimulation.
An important, but often ignored, concern for the study of prediction errors with fMRI is the influence of heart rate on the BOLD signal. Because unexpected events and negative feedback may influence heart rate (Jennings and van der Molen, 2002; Crone et al., 2004), we incorporated cardiac measurements as a covariate in the analyses.
Materials and Methods
Participants.
Ten adults (mean age, 23 years; SD, 4 years; 3 females) from the student population at Bangor University, with no history of neurological injury or disorders, served as participants. An 11th participant was excluded from the study after a postsession debriefing in which he indicated difficulty in resolving the target locations without corrective lenses. Participants were paid for their time. The study was approved by the institutional review board of the School of Psychology, Bangor University.
Apparatus.
Participants lay supine in the fMRI scanner with the head stabilized by a custom-fit bite bar. They grasped the handle of a nonmagnetic two-joint robotic manipulandum (http://fmrirobot.org) (Diedrichsen et al., 2005a), which was linked to a computer located in a control room. This device allows for low-friction, two-dimensional movements within the horizontal plane. Linear optical encoders on the elbow and shoulder joint provided position information with endpoint accuracy better than 0.01 mm. Forces were applied via air pistons supplied with 100 psi pressure from a compressor. The pistons generate a target force with a delay of ∼60 ms following a step input. A filter panel in the wall separating the scanning and control rooms prevented leakage of radio frequency noise. Position and velocity of the hand and the generated forces were recorded at 200 Hz. Visual stimuli, including targets and feedback of hand position, were projected onto a back screen, which was viewed by the participants through a mirror.
Behavioral task.
On each trial, an arc composed of a series of circles was presented (Fig. 1). One circle, the target, differed in color from the remaining distractor circles. To assist in maintaining attention during the task, we varied the location of the target on some trials. The target was either the central circle or the circle to the immediate left or right (±7°). Participants were required to make a fast, out-and-back reaching movement, attempting to intersect the target circle. The target could be either red or white, and the distractors were always the opposite color. Importantly, if the intersected circle was red, the robot delivered a short force pulse, whether this circle was the target or the distractor. If the intersected circle was white, there was no force pulse.
Figure 1.

Experimental task. The stimulus display consisted of 21 dots (13 shown here), with one dot—the target—presented in a unique color. Holding a nonmagnetic robotic arm, participants made a fast out-and-back movement from a yellow starting circle, attempting to intersect the target. Solid lines indicate arm trajectories. A resistive force pulse was provided to the hand as soon as it intersected a red dot on the outward movement. No pulse was delivered when the hand intersected a white dot. This created a 2 × 2 design, where participants either aimed for a red dot and expected a force pulse (left column), or aimed for a white dot and expected to not receive a force pulse (right column). Errors can be signaled by the presence of an unexpected stimulus (intersecting a red dot while aiming for a white target; top right) or the absence of an expected stimulus (intersecting a white dot when aiming for a red target; bottom left). Visual feedback of hand position was present on half of the trials. We increased the error rates by adding a ±7° rotation to hand position (and, when present, visual feedback) on 33% of the trials.
Using a balanced 2 × 2 design, we separately manipulated the participant's expectation of the sensory outcome and the actual sensory outcome (Fig. 1). On trials in which the target was white, the participant should have expected not to receive a force pulse. As such, the absence of the force pulse indicated a successful reach whereas the presence of the force pulse signaled a prediction error. In contrast, on trials in which the target was red, the participant should have anticipated the force pulse. The presence of the force pulse now indicated a successful reach whereas the absence of the pulse signaled a prediction error. In this manner, the prediction error was either associated with the presence of an unexpected sensory event or the absence of an expected sensory event.
To initiate a trial, the participant moved the handle to the center of the workspace. The center was adjusted for each participant before scanning to ensure that the movements could be performed comfortably without contacting the bore of the scanner. Starting position was indicated by the color of a crosshair pattern on the screen. The crosshair was blue if the cursor was within a 2 cm diameter boundary region and yellow if the cursor was outside this starting region. The array of 21 colored circles (1 cm diameter) was then presented, arranged in a semicircle with an 8 cm radius.
Participants initiated the movement after the onset of the array, with the instructions emphasizing accuracy and consistent movement kinematics (see below), rather than reaction time. Whenever the cursor intersected a red circle, a brief force pulse was applied to the hand. This force pulse was directed against the direction of movement, decelerating the reaching movement. The pulse consisted of a half-sinusoid with an amplitude of 1.5 N and a duration (half-period) of 60 ms. No pulse was delivered when the cursor intersected a white circle, or when the hand moved through the array on the return path. To increase the incidence of errors, the cursor was randomly rotated by ±7°, the angular width of a single target, on 33% of the trials. The rotation was centered around the starting position and could be to the left or the right. Participants were informed that a small rotation would be applied randomly.
In half of the trials, the cursor was visible, and a dot was presented on the display at the point of the farthest extent of the movement, providing direction- and amplitude-based visual feedback. Corrections based on on-line visual feedback were not possible given the short duration of the movements. In the other half of the trials, no visual feedback was presented. Visual feedback and no-feedback trials were interspersed, allowing us to determine the relative contributions of somatosensory and visual error signals. To encourage successful performance, a counter incremented by one point when the hand returned to the starting region if the cursor had passed through the target circle. This counter was visible on all trials.
Participants completed a training session 1–2 d before the scanning session. This session was conducted in a mock scanner with a setup identical to the real scanning environment. The training session familiarized the participants with the task and was used to train them to complete the movements with a consistent movement speed and amplitude (based on verbal feedback from the experimenter). During training, participants completed at least four blocks of 80 trials each.
In the fMRI session, a target was presented every 4 s. The target color, and thus the expected outcome, was held constant for blocks of 15 trials, followed by 10 seconds of rest. During each scanning run (300 s), participants performed two blocks with each of the two expectation conditions, with the order counterbalanced across participants. Each participant completed eight runs, with the exception of one subject who was unable to complete the eighth run. One subject completed a ninth run to make up for a technical error with the apparatus.
Participants were instructed to maintain fixation at the center location and not saccade to the target. Eye movements were monitored during the fMRI session, and participants were informed at the end of each run if they made any eye movements. Very few saccades were detected during the task.
Scan acquisition.
Data were acquired on a 3 T Philips Intera system (Philips Medical Systems). For functional runs, we used an echo planar imaging sequence with sensitivity-encoded MRI (Pruessmann et al., 1999) and a sensitivity encoding factor of 2. Twenty-four oblique slices (1.8 mm thickness; 0.3 mm gap; repetition time, 2 s), oriented ∼45 degrees from horizontal, were selected to optimize coverage of the cerebellum and brainstem. Each slice was acquired as a 96 × 96 matrix (field of view was 24.0 × 24.0 cm) with a voxel size of 1.88 × 1.88 × 2.1 mm. Each run contained 150 volumes. For anatomical localization, a high-resolution T1-weighted structural image was acquired with 0.67 × 0.67 × 0.7 mm resolution using a magnetization-prepared rapid-acquisition gradient echo sequence.
Because physiological variables are known to influence the BOLD response (Glover et al., 2000; Shmueli et al., 2007; Birn et al., 2008; Chang et al., 2009), we recorded cardiac and respiration rate during the functional runs. Heart rate was recorded at 500 Hz using a four-lead EKG system integrated with the Phillips scanner. Respiration was recorded at 100 Hz using a pneumatic compression belt.
Imaging analysis.
Functional images were converted to four-dimensional Nifti files (http://www.cabiatl.com/mricro/mricron/dcm2nii.html) and analyzed using SPM5 (http://www.fil.ion.ucl.ac.uk/spm/software/spm5). Images were corrected for slice timing, realigned to correct for residual head movement (using rigid-body realignment), and coregistered to the anatomical image. Following this preprocessing, unsmoothed images were analyzed in native space using a general linear model.
Event-related regressors were created for eight trial types (two expectation conditions × two outcomes × two visual feedback conditions) as delta functions, time-locked to target onset. These functions were convolved with the canonical hemodynamic response function. While the target location varied slightly across trials, pilot analysis suggested that this manipulation did not affect BOLD data, thus we did not include this effect in our model. Heart and respiration rate were estimated using the Physiological Log Extraction for Modeling toolbox (http://sites.google.com/site/phlemtoolbox/). The heart rate time series was computed following the methods outlined in Chang et al. (2009). After marking the time of the peak of the QRS waveform, we identified all heartbeats within a 6 s window, centered at the time of a single volume in the fMRI time series. The average interbeat interval was computed, inverted, and multiplied by 60 to compute beats per minute. This time series was then shifted by 0–11 TRs. The resulting 12 regressors were used directly as covariates.
For the group analysis, we first normalized the anatomical images to a high-resolution cerebellar template [Spatially Unbiased Infratentorial Template (SUIT) (Diedrichsen, 2006)], We used the resulting transformation to bring the contrast images (the weighted sums of single beta images, not images of t values) into a common template space. The normalized contrast images were then smoothed with a three-dimensional Gaussian kernel (5 mm FWHM). We performed a random-effects analysis on these images for statistical evaluation.
Results
Kinematics and learning
Subtle differences in movement kinematics can induce substantial changes in the cerebellar BOLD signal (Seidler et al., 2002). Given this, we trained subjects in a separate session to match several key measures of performance, including movement time, peak velocity, and reach amplitude, across trial types. These kinematic variables were also measured during the fMRI session. Analyses of these data indicated that the error and correct trials were exactly matched (Table 1). Inspection of the velocity profiles (Fig. 2) revealed a slight effect of the presence of the force pulse, but no effect of the expectation and, importantly, no interaction between expectation and outcome. Thus, kinematics were very similar regardless of whether a trial contained a prediction error. This pattern of results was present both at the group level (Fig. 2a) and for individual subjects (Fig. 2b).
Table 1.
Behavioral performance
| Pulse expected |
Pulse unexpected |
|||
|---|---|---|---|---|
| Pulse | No pulse | Pulse | No pulse | |
| Proportion of trials (%) | 52.3 (6.46) | 47.7 (6.46) | 49.1 (4.21) | 50.9 (4.21) |
| Time to feedback (ms) | 181.8 (15.4) | 182.2 (15.5) | 184.0 (16.75) | 185.1 (21.9) |
| Time to reversal (ms) | 280.5 (36.0) | 312.8 (31.9) | 283.6 (34.8) | 311.8 (35.1) |
| Return time (ms) | 504.4 (77.1) | 480.2 (56.3) | 502.2 (73.3) | 463.4 (63.4) |
| Peak velocity (cm/s) | 57.8 (5.76) | 57.8 (5.98) | 57.2 (5.14) | 57.3 (5.29) |
| Reach Amplitude (cm) | 9.05 (0.99) | 10.72 (1.53) | 8.95 (0.92) | 10.57 (1.54) |
Time to feedback is calculated from response initiation until the cursor reached the edge of the stimulus arc. Time to reversal is calculated from movement initiation until the zero-crossing of the velocity, and return time is calculated from the time of the movement reversal to movement termination near the starting position. Values are presented as between-participant means (and SDs). Error trials (middle two columns, italicized) occurred when the outcome did not match the expectation.
Figure 2.
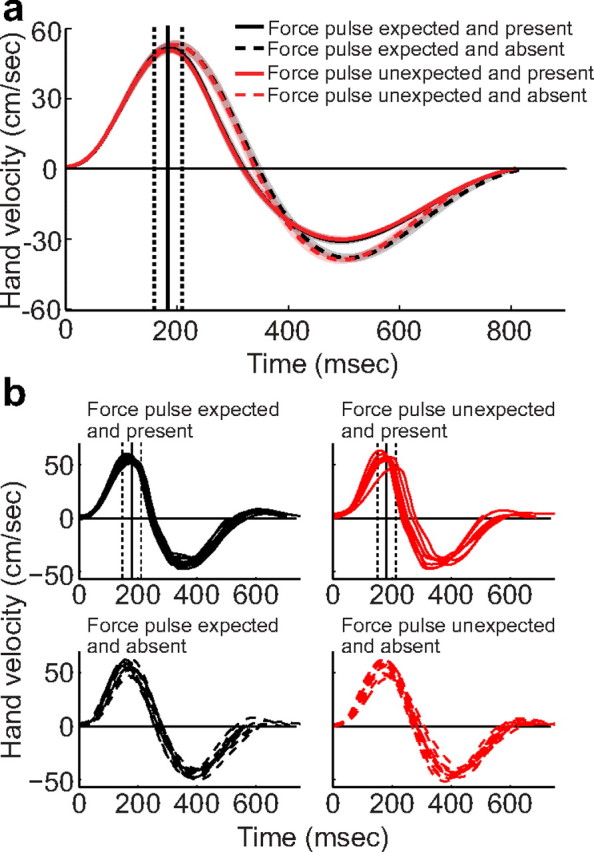
Behavioral performance during scanning. a, Average velocity profiles along the principal direction of motion in the four conditions during the fMRI session, averaged across participants (between-participant standard error shown as shaded regions). The average timing of the force pulse is indicated by the vertical lines, with dashed lines corresponding to the onset and offset of the pulse and the solid line corresponding to the peak of the force pulse. Hand velocity was most affected by the presence or absence of the force pulse, while neither the expected outcome nor the mismatch between expected and actual outcome had an effect. b, Sample velocity profiles from a representative subject (subject 2, third MRI block). Velocity profiles were affected by the presence of the force pulse (top vs bottom), but kinematics were unaffected by behavioral errors (e.g., the graphs on the bottom show similar velocity profiles despite the fact that the bottom left graph contains a prediction error while the expectation is confirmed on the bottom right).
Kinematic measurements were analyzed using a 2 × 2 repeated-measures ANOVA with the factors Feedback Expectation (expect presence or absence of a force pulse) and Movement Outcome (experience presence or absence of a force pulse). Systematic differences in kinematics between correct and error trials would be manifest as an interaction in this analysis. No significant main effects or interactions were observed for the movement time (expectation: F(1,9) = 1.7, p = 0.23; outcome: F(1,9) = 0.04, p = 0.85; interaction: F(1,9) < 0.01, p > 0.92) or peak velocity (expectation: F(1,9) = 1.22, p = 0.30; outcome: F(1,9) = 0.07, p = 0.8; interaction: F(1,9) < 0.01, p > 0.92). For movement amplitude, the effect of movement outcome was significant (F(1,9) = 66, p < 0.0001). Movement amplitude was shorter by 1.6 cm (SD = 0.64 cm) on trials with a force pulse because the force pulse was applied against the direction of movement. The main effect of expectation was marginally reliable (F(1,9) = 4.32, p = 0.06), with the mean amplitude larger by 0.13 cm (SD = 0.2) when participants expected a force pulse. Most importantly, however, the two factors did not interact (F(1,9) < 0.01, p > 0.92). Indeed, not only were all of the interaction terms nonsignificant, but they were very close to zero. Thus, our extended training was successful in equating movement parameters across the different expectation outcomes. This ensures that the critical fMRI comparison between correct and error trials (the interaction between expectation and outcome) is based on trials well matched with respect to basic kinematic variables.
Interestingly, the behavioral data also showed that participants adapted their behavior based on the movement outcome. After experiencing a force pulse, participants reached faster (F(1,9) = 8.44, p < 0.05) and slightly farther (F(1,9) = 52.23, p < 0.001) on the next trial compared with movements following trials without a force pulse. The change is consistent with the hypothesis that the expected probability of a force pulse is adjusted based on the prediction error from the last trial (Thoroughman and Shadmehr, 2000). Thus, the behavioral results indicate that these prediction errors produce subtle behavioral changes, even though the participants were successfully trained to produce similar movements regardless of whether or not they expected a force pulse.
Cerebellar activation, uncorrected for physiological variation
We first examined the contrast of Movement versus Rest to ensure that we are able to activate the cerebellum in this task. Figure 3a shows the regions activated when making a reach. We found the expected activation in the anterior (lobule V/VI) and inferior (lobule VIII) hand representation on the ipsilateral side (Grodd et al., 2001; Wiestler et al., 2011), with some spread to the contralateral hemisphere, but in general no activation in Crus I and Crus II.
Figure 3.
fMRI results, comparing movement against rest. a, Standard analysis (no cardiac covariates) shows increased (red) and decreased (blue) BOLD response associated with movement. Activation is largely ipsilateral in lobules V, VI, and VIII. b, After accounting for heart rate fluctuations, the response is slightly decreased in size, but the spatial distribution remains the same. Images are thresholded at p < 0.01, uncorrected, with statistical significance assessed by evaluating the volume of the active cluster. Numerous clusters of significant spatial extent (p < 0.05 after correction for multiple comparisons; Table 2) were detected.
Table 2.
MNI coordinates of activation clusters
| Contrast | Cluster |
Peak voxel |
MNI coordinates (mm) |
Cerebellar lobules | |||||
|---|---|---|---|---|---|---|---|---|---|
| Significance | p (corrected) | Volume (cm3) | Z | p (uncorrected) | x | y | z | ||
| Error Trials > Correct Trials | ** | 0.001 | 1.00 | 3.66 | 0.000 | 24 | −48 | −20 | Right V and VI |
| Correct Trials > Error Trials | ** | 0.000 | 2.13 | 3.94 | 0.000 | −46 | −62 | −36 | Left VI, Crus I, Crus II |
| ** | 0.000 | 1.40 | 3.72 | 0.000 | 48 | −66 | −36 | Right Crus I, Crus II, VIIb | |
| ** | 0.000 | 1.19 | 3.62 | 0.000 | 0 | −62 | −30 | Right VI, Crus I, Crus II; Vermis VI through VIIIb | |
| ** | 0.005 | 0.80 | 3.10 | 0.001 | 2 | −50 | −16 | Bilateral I through V | |
| * | 0.037 | 0.56 | 3.47 | 0.000 | −2 | −72 | −40 | Bilateral Crus II, VIIb, IX; Vermis VIIIa and VIIIb | |
| Unexpected Sensory Stimulus > Other Trials | ns | — | — | — | — | — | — | — | — |
| Other Trials > Unexpected Sensory Stimulus | ** | 0.000 | 1.66 | 3.70 | 0.000 | −6 | −56 | −36 | Left VI, Crus I, and IX; Bilateral Crus II and VIIb; Vermis VIIIa, VIIIb, IX |
| ** | 0.000 | 1.88 | 4.14 | 0.000 | −24 | −60 | −30 | Left VI, Crus I, Crus II | |
| ** | 0.001 | 1.09 | 4.01 | 0.000 | 16 | −76 | −32 | Right VI, Crus I, Crus II; Vermis VI | |
| * | 0.013 | 7.44 | 3.31 | 0.000 | −28 | −50 | −34 | Left VI, Crus I, Crus II | |
| Sensory Stimulus Trials > No Stimulus | ns | — | — | — | — | — | — | — | — |
| No Stimulus Trials > Sensory Stimulus | ** | 0.000 | 2.840 | 4.01 | 0.000 | −12 | −70 | −32 | Left VI through VIIIa |
| Visual Feedback > No Feedback | ns | — | — | — | — | — | — | — | — |
| No Visual Feedback > Feedback | ** | 0.000 | 2.296 | 4.64 | 0.000 | −2 | −32 | −42 | Right V, VI, IX and X |
| ** | 0.004 | 0.896 | 3.61 | 0.000 | −28 | −48 | −30 | Left V, VI, Crus I | |
| * | 0.016 | 0.704 | 4.25 | 0.000 | 14 | −70 | −36 | Right Crus I, Crus II, VIIb; Vermis VI | |
| * | 0.024 | 0.648 | 4.14 | 0.000 | −24 | −78 | −28 | Left Crus I, Crus II | |
| Move > Rest | ** | 0.000 | 31.032 | 5.31 | 0.000 | 30 | −42 | −28 | Bilateral I through VIIIa; Right VIIIb, IX, X; Vermis VIIIb, IX |
| Rest > Move | ** | 0.000 | 3.392 | 4.02 | 0.000 | 16 | −84 | −30 | Right Crus I, Crus II |
| ** | 0.004 | 1.288 | 4.04 | 0.000 | −22 | −84 | −30 | Left Crus I, Crus II | |
Shown are the clusters of activation for the contrasts of interest. We present the volume of the cluster, the peak voxel activation, the MNI coordinates [in SUIT space (Diedrichsen, 2006)], as well as the anatomical extent of the cluster [in lobules (Diedrichsen et al., 2009)].
*p < 0.05,
**p < 0.005.
To detect regions of the cerebellum that encode sensory prediction errors, we contrasted error trials and correct trials. This should identify areas sensitive to prediction errors arising from both the presence of unexpected sensory stimulation and the absence of expected sensory stimulation. In our initial analysis, this comparison (Fig. 4a) revealed no areas within the cerebellum that showed a larger increase in the BOLD signal on trials involving prediction errors compared with trials in which the predicted outcome was experienced. Surprisingly, these initial results revealed the opposite outcome: the BOLD response in the cerebellum on error trials was generally lower than the BOLD response on correct trials. Correct trials were associated with significantly greater activation than incorrect trials in large clusters of Crus I and II (p < 0.05 corrected; Table 1), lobules that are typically not associated with sensorimotor control (Stoodley and Schmahmann, 2009). Indeed, these regions were specifically not activated in the contrast of movement versus rest (Fig. 3a). Furthermore, this decrease in activation was very broad, covering almost the entire cerebellar cortex. This lead us to suspect that there may have been an artifact present in our data, causing a spurious signal decrease following error trials.
Figure 4.

fMRI results, contrasting error trials and correct trials. Images are thresholded at p < 0.01, uncorrected, with statistical significance assessed by evaluating the volume of the active cluster. a, Standard analysis (no cardiac covariates) shows a decrease in BOLD response (blue) on error trials compared with correct trials. No cerebellar clusters showed a larger response on error trials. b, After accounting for heart rate fluctuations, a significantly error-related cluster (p < 0.002 after correction for multiple comparisons) is observed in right lobules V and VI (red). c, Signal change for all eight conditions in the ROI analysis of error-selective voxels. The BOLD response is elevated for both types of errors (inner bars). This error signal was not modulated by the presence or absence of visual feedback.
Relationship of heart rate and prediction errors
We next examined how basic physiological processes such as heart rate and breathing were related to the occurrence of errors in our reaching task. Heart rate deceleration is observed when people anticipate making a response (Damen and Brunia, 1987) or terminate a prepared response (Jennings et al., 1991). Heart rate deceleration has also been observed following movement errors (Jennings and van der Molen, 2002) or feedback about nonmotor, cognitive errors (Crone et al., 2005). Although the influence of heart rate and breathing on fMRI data has been described (Glover et al., 2000; Shmueli et al., 2007; Birn et al., 2008; Chang et al., 2009), the potential impact of these factors on BOLD measurements of performance and learning has not been considered.
A slight drop in heart rate was visible during the intertrial interval between movements (Fig. 5a), possibly reflecting cardiac deceleration associated with the anticipation of the forthcoming trial (Damen and Brunia, 1987). Importantly, there was also a decrease in heart rate when participants committed an error compared with that observed on correct trials (Fig. 5b). The magnitude of this difference was ∼1% of mean heart rate and lasted for ∼8 s. We averaged the normalized heart rate over a 4 s window following the response (i.e., the intermovement interval). These data were analyzed with a 2 × 2 repeated-measures ANOVA involving the factors Feedback Expectation and Movement Outcome. Neither main effect was reliable (Expectation: F(1,9) = 0.27, p = 0.62; Outcome: F(1,9) = 4.02, p = 0.076), despite a trend toward increased heart rate following a somatosensory stimulus (0.2%). Importantly, the interaction was highly significant (F(1,9) = 19.83, p = 0.002). Thus, heart rate decelerated following either type of error. A similar analysis of breathing rate failed to reveal any systematic relationship of this physiological variable to our behavioral conditions.
Figure 5.

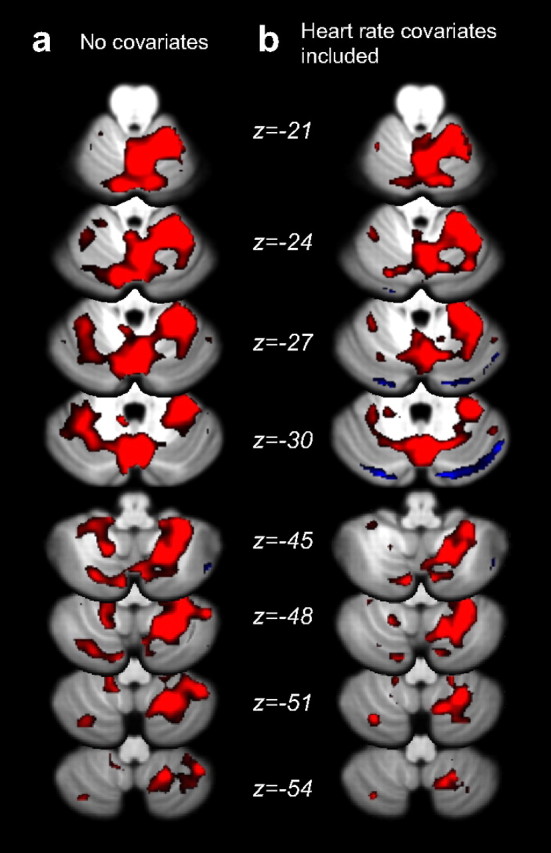
Changes in heart rate and effect on cerebellar BOLD signal. a, Instantaneous heart rate for error (dark gray) and correct (light gray) trial, expressed as proportion of baseline and aligned to the movement onset (0 s). Neighboring movements are indicated as dashed vertical lines. Data are averaged across all trials and participants, and shaded regions indicate between-subject standard error. Evoked signal following error and correct trials were significantly different (p < 0.002). b, Difference between error and correct trials as percentage of the heart rate during baseline. The heart rate is depressed for ∼8 s after error trials compared with correct trials. c, Horizontal slices through the cerebellum showing regions where the inclusion of heart rate regressors explains a significant proportion of the variability. Images are threshold corrected for multiple comparisons using a 5% false discovery rate. d, The cerebellar cardiac response function was estimated by including 12 regressors, corresponding to the instantaneous heart rate delayed by 0–22 s. The size of the beta value for these regressors provides an estimate of the influence of heart rate on the BOLD response at each time lag.
Can the observed cardiac deceleration following error trials explain why the BOLD signal was lower on error trials compared with correct trials? To test for this possibility, we first determined how variation in heart rate influenced the cerebellar BOLD signal. Previous work suggested that the effects of heart rate on BOLD last for ∼24 s (Shmueli et al., 2007; Chang et al., 2009). We therefore chose to estimate the influence of heart rate at temporal lags of 0–22 s by including 12 regressors, each consisting of the instantaneous heart rate shifted temporally by 2 s: the first regressor contained the instantaneous heart rate, the second contained the heart rate delayed by 2 s, and so forth. Using this model, we estimated the cerebellar cardiac response function for our participants. A positive relationship was observed between heart rate and cerebellar BOLD response with a delay of ∼4 s; at these lags, therefore, a decrease in heart rate was associated with a decrease in the BOLD response. The response function was relatively homogenous across three subdivisions of the cerebellum, which were selected to correspond to the distribution territories of the primary cerebellar arteries. This function was similar to that observed for the neocortex, though with a less pronounced dip at 12 s (Chang et al., 2009). Heart rate had a significant effect on the BOLD signal for 57% of the cerebellar voxels (F(12,108) > 2.354, p < 0.05 corrected using false discovery rate), regardless of whether these voxels were relevant for the movement task (Fig. 5c). Overall, the addition of cardiac regressors accounted for ∼3% of the total variance of the raw BOLD signal across the cerebellar cortex. In the same area, the behavioral regressors accounted for ∼1.6% of the total variance.
The preceding analyses indicate that both heart rate and behavior influence the BOLD signal. Given that these two variables are not independent, it is important to carefully consider whether we can separate the influence of these factors. That is, if we wish to estimate the effect of error trials independent of the accompanying change in heart rate, it is necessary to demonstrate that there is substantial variation in heart rate that is independent of the behavioral outcome. To examine this, we conducted a multiple regression analysis using the error contrast as the independent variable and heart rate at specific lags as the dependent variable. The largest coefficient of determination (R2) was observed with a heart rate lag of 6 s. Even at this lag, the error regressor only explained 2% of the total variance of the rate fluctuations. Much of the variance was explained by other outcome-independent factors, such as the occurrence of the rest phases (which also led to a drop in heart rate).
Given this relative independence, we entered the 12 heart rate regressors and the behavioral regressors into a single linear model. Since the two sets of regressors are slightly codependent, the expected variance of the regressors of interest will increase. The size of this increase can be analytically calculated, because the expected variance of the regression coefficients is proportional to (XTX)−1, where X is the design matrix (Dale, 1999). In our case, the expected variance of the error contrast increased by 16% (SD = 13%) through the inclusion of the 12 heart rate regressors. Thus, while there was some loss of accuracy, there was sufficient variation in heart rate—independent of whether the trial contained an error or not—to enable the accurate estimation of the BOLD response to both physiological and behavioral factors.
Cerebellar activation, corrected for heart rate variation
When looking at the response to movement (Fig. 3b), we can see that the estimates of the BOLD signal changes were slightly lower after the addition of physiological factors into the model, consistent with the idea that some of the increases were not due to increases in neural activity, but to increases in heart rate during movement phases. Overall, however, the location of the activation was largely unchanged.
We again compared trials with and without prediction errors, including a correction for heart rate in our model (Fig. 4b). The widespread activation decreases that had been observed on error trials compared with correct trials were no longer observed, confirming our intuition that these decreases in signal were artifactual. Instead, a single cerebellar region showed increases in activation on error trials (1 cm3 with t > 2.82, p < 0.01, clusterwise p value corrected for multiple test: p < 0.002). The cluster lies in the right hemisphere, in lobules V and VI, a region associated with movement and somatosensation of the right hand (Rijntjes et al., 1999; Grodd et al., 2001). The effect was also evident in an analysis of individual datasets. In nine of the 10 participants, a significant increase of activation on error trials was observed in a cluster within the hand area of right lobule V/VI (height threshold, p = 0.05 uncorrected, extend threshold = 160 mm3). In contrast, only three of 10 participants showed clusters of this size in a control region of comparable size (left Crus I). Interestingly, seven of 10 participants also showed an error-related cluster in left lobule VIII, and eight had active clusters in right lobule VIII. However, this region did not reach significance at the group level. Overall, therefore, our results clearly show a neural signature of prediction errors in motor-related regions of the human cerebellum, an effect that would have been missed if we did not correct for BOLD signal changes induced by heart rate.
Critically, the response within this region was similar for both the presence of unexpected sensory stimulation and the absence of expected sensory stimulation (Fig. 3c). Thus, the cerebellar activation related to prediction errors in this region was not asymmetric. To directly test the idea that other cerebellar regions may selectively encode errors signaled by the presence of an unexpected sensory stimulus, we compared these trials against the other three trial types. This contrast failed to reveal any reliable effects in the cerebellum (Fig. 6a). Thus, this null result provides further support for the hypothesis that the cerebellum is responsive to sensory prediction errors in a general sense and is not restricted to the processing of unexpected sensory events.
Figure 6.

Additional fMRI contrasts of interest. a, Comparing trials involving an unexpected force pulse to the other conditions, small clusters of inactivation (blue) were present, though none were large enough to reach statistical significance. b, Comparing trials with and without force pulses showed no regions that were more active in response to somatosory stimuli. The absence of somatosensory stimuli increased activation in a significantly large cluster in the left superior posterior hemisphere (p < 0.001 after correction for multiple comparisons), likely resulting from the larger return movement required. Physiological covariates were included, and all images were thresholded at p < 0.01, uncorrected, with statistical significance assessed by evaluating the volume of the active cluster.
Similarly, the cerebellar BOLD signal did not respond strongly to sensory input: a contrast of the presence or absence of the force pulse revealed no active clusters (Fig. 6b). This finding is in agreement with reports that light somatosensory stimulation does not lead to reliable increases in cerebellar BOLD signal (Wiestler et al., 2011).
In a final analysis, we examined whether the cerebellar error signal depended on visual feedback of the cursor. On trials with visual feedback, there are two error signals, a somatosensory signal that occurs when the force pulse is experienced when unexpected or not experienced when expected, and a visual signal indicating that the cursor did not move in the predicted direction. On trials without visual feedback, the trial outcome (correct or error) was only signaled by somatosensory information. We did not find any differences in cerebellar activation between trials with and without visual feedback. Moreover, no significant clusters were observed in an interaction analysis of the factors Vision and Outcome (correct vs incorrect).
We also explored the effect of visual feedback in a region of interest analysis. For this analysis, we created spherical ROIs (3 mm radius) on a subject-by-subject basis, centered at the voxel in right lobules V and VI, which demonstrated the strongest error related activity. We then extracted the average signal change across these voxels. These data were analyzed with a three-way ANOVA with factors Sensory Stimulation, Sensory Expectation, and Visual Feedback (with subject identity entered as a random effect). Reflecting the selection criterion, the activation was strongest on error trials (Stimulation × Expectation interaction: F(1,9) = 27.28, p < 0.001). Importantly, this effect was not modulated by the presence or absence of Visual Feedback (three-way interaction: F(1,9) = 1.89, p > 0.2), a comparison which is independent of our selection criteria. The independent main effect of Visual Feedback approached reliability in these voxels (F(1,9) = 4.33, p < 0.07), but did not interact with Sensory Stimulation (F(1,9) = 2.67, p > 0.13) or Sensory Expectation (F(1,9) = 0.08, p > 0.75). Together, these results indicate that the observed error-related activity was driven by the somatosensory mismatch, rather than visual feedback of the erroneous trajectory.
Inferior olivary responses to prediction errors
An important consideration for the study of sensory prediction errors with fMRI is that it is currently unknown whether climbing fiber activity affects the cerebellar BOLD signal (Zhang et al., 2003; Diedrichsen et al., 2010). In contrast, there is substantial evidence that increased mossy fiber input leads to a strong vasodilatory response, and hence to an increase in BOLD signal (Thomsen et al., 2009; Howarth et al., 2010). Thus, error-related signal increases cannot be evaluated as evidence of climbing fiber activity. Previous studies, however, have argued that activity in the climbing fiber system can be observed through conventional BOLD imaging of the inferior olivary complex (Xu et al., 2006; Liu et al., 2008). To test for the presence of such signals in our current dataset, we identified a region encompassing the inferior olive in SUIT space using a brainstem atlas (http://www.dartmouth.edu/∼rswenson/Atlas/BrainStem), and subsequently warped this ROI back into individual space for analysis. However, we failed to detect any error-related activity in these voxels (Fig. 7), regardless of whether physiological covariates were ignored (Fig. 7a) or included (Fig. 7b) in the analysis. This null result is tempered by the fact that nearly 25% of the variance of the olivary signal was related to the cardiac and respiratory phase (Fig. 7c). While previous studies have revealed BOLD variation within the inferior olive (Xu et al., 2006; Liu et al., 2008), they did not take physiological factors into account at all. Our current results underline the challenges involved in discriminating neural signal from physiological noise within the BOLD response in the olivary complex (Harvey et al., 2008).
Figure 7.
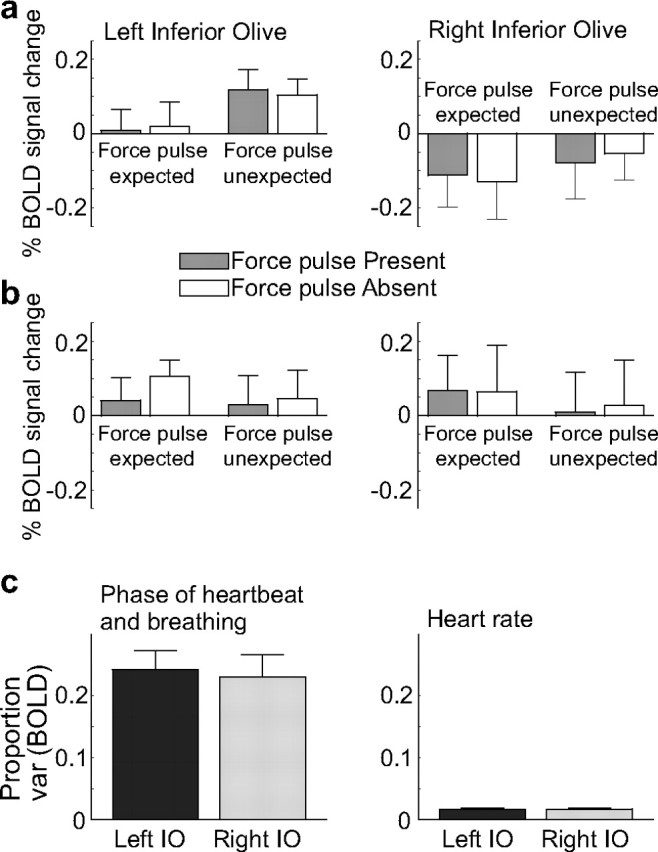
ROI analysis of the inferior olive (IO). a, Before considering heart rate, the right inferior olive showed a general decrease in activation compared with rest, although this was not significant. b, Following the inclusion of heart rate covariates into the model, neither the right nor the left olive showed a significant change in heart rate from rest in any of the four conditions. c, Effect of different physiological variables on the BOLD signal in the inferior olive. Left, Nearly 25% of the variance of the BOLD signal could be explained by the cardiac or respiratory phase (Glover et al., 2000), consistent with the proximity of the inferior olive to the arterial blood supply. Right, Heart rate alone accounted for ∼2% of the variance in the BOLD signal in the olive.
Discussion
The current results reveal a representation of somatosensory prediction errors in the human cerebellum. A restricted region, cerebellar lobules V and VI, showed an increased BOLD response to prediction errors arising from either the unexpected occurrence of a sensory event or the unexpected omission of an expected somatosensory stimulus. These regions are also active during movement. Notably, had we ignored the influence of heart rate or failed to record it concurrently with behavior, we would have either missed this response entirely or erroneously concluded that prediction errors cause a broad decrease in cerebellar BOLD response.
Our study underscores the need to carefully correct for the influence of heart rate and breathing when studying cerebellar function with fMRI. This issue is also relevant for neuroimaging studies focusing on brainstem nuclei such as the inferior olive, given that this region is highly sensitive to physiological factors (Harvey et al., 2008). The inclusion of physiological regressors is especially important when, as in our study, heart rate covaries with one or more of the experimental manipulations.
Sensory prediction errors are central to our understanding of cerebellar function and its contribution to behavior. Damage to the cerebellum results in learning deficits (Smith and Shadmehr, 2005; Martin et al., 1996; Maschke et al., 2004; Morton and Bastian, 2006; Tseng et al., 2007), which can be attributed to a failure of short-term learning or adaptation. Adaptation is characterized as an error-driven process, where the errors experienced during one trial lead to a corrective adjustment in the motor output on the next trial (Thoroughman and Shadmehr, 2000; Donchin et al., 2003; Cheng and Sabes, 2006; Wolpert et al., 2011). The specific circuitry of the cerebellum has long been thought to be an ideal neural circuit for error-based learning (Marr, 1969; Albus, 1971; Ito, 2001). Such mechanisms are often evoked in explaining the cerebellar contribution to model systems of motor learning such as eyeblink conditioning (Gellman and Miles, 1985; Berthier and Moore, 1986; Christian and Thompson, 2003) and gain adjustment in the vestibulo-ocular reflex (Ito, 1998; Sadeghi et al., 2010). The current results point to a signature of sensory prediction error representation in the human cerebellum, which could be used for learning in more complex reaching tasks.
The results of previous imaging studies of the cerebellum, while consistent with an error processing interpretation, are problematic due to a number of confounding factors. For example, Imamizu and colleagues (2000) demonstrated greater cerebellar BOLD signal early in learning, an epoch in which prediction errors are greatest. However, the response may have been related to corrective movements that are also prominent during this period. Similarly, a recent study (Fautrelle et al., 2011) reported more lobule VI activity (bilateral) when participants caught objects whose weight was unpredictable compared with when the object's weight was predictable. While broadly consistent with our finding here, some of this activation may have been due to sensory or motor differences caused by online corrections, which were triggered by experiencing the unexpected weight. While in the current study, on-line corrections may have occurred after the force pulse, we succeeded in tightly matching kinematic parameters across correct and error trials. Therefore, differences found in the cerebellar BOLD signal cannot have been caused by kinematic differences induced by on-line corrections, but provide strong evidence of the representation of somatosensory errors.
Blakemore and colleagues (1998, 2001) previously showed less cerebellar activation on trials in which a self-generated action produced predictable sensory stimulation compared with when the same stimulation was applied in the absence of movement and thus unexpected. It is puzzling that this sensory error signal was observed contralateral to the arm receiving the stimulation, given that somatosensory representations in the cerebellum are generally ipsilateral (Grodd et al., 2001). It is also noteworthy that this study used a blocked design in which the participant either produced sinusoidal movement (with predictable sensory consequences) or received similar sensory stimulation without movement. Our event-related design provides a more direct approach to address hypotheses about the response to sensory prediction errors that are relevant for the motor system, and additionally allowed us to test both the presence of unexpected stimuli and the absence of predicted stimuli.
Neurophysiological evidence, obtained across a range of tasks, have led to the hypothesis that cerebellar error representation is asymmetric. During eyeblink conditioning, complex spike activity increases following the unexpected delivery of an aversive air puff. In contrast, complex spikes are not observed during extinction (McCormick et al., 1985); here, an error occurs when an expected air puff is not presented. Similarly, neuronal activity in the inferior olive of the cat during reaching movements responds asymmetrically to unexpected events (Horn et al., 2004). Olivary responses are observed when an unexpected obstacle disrupts the trajectory, as well as when an unexpected stimulus is applied during the postural phase of the trial. This response is absent when the animal attempts to contact a target that has been removed (the absence of an expected tactile stimulus). It should be noted that, in this study, vision of the target was not precluded; thus, the absence of the expected somatosensory stimulation from contacting the target may not constitute an error given that the animal could see that the target had been withdrawn. Indeed, other studies have shown that climbing fiber signals can be elicited by the unexpected absence of a tactile stimulus, at least when an immediate corrective movement is produced (Andersson and Armstrong, 1987). Our design allows a more direct comparison of errors resulting from the unexpected presence or unexpected absence of a somatosensory stimulus. We observed a similar increase in the cerebellar BOLD signal in both situations.
The cerebellar error signal, evident in the arm area of lobules V and VI, may not reflect a sensory-prediction error per se, but rather provide a signal that the movement has failed to achieve the behavioral goal. We believe this hypothesis does not provide a parsimonious account of our results. The behavioral data clearly show that the direction of the error signal was behaviorally relevant. Indeed, despite instructions and training designed to maintain a constant kinematic profile, participants (unknowingly) showed trial-to-trial adjustments in their behavior, speeding up after experiencing a force pulse and slowing down when the force pulse was absent. It is this type of involuntary trial-by-trial adaptation that is disrupted in patients with cerebellar lesion (Martin et al., 1996; Maschke et al., 2004; Diedrichsen et al., 2005b; Smith and Shadmehr, 2005; Morton and Bastian, 2006; Tseng et al., 2007; Golla et al., 2008).
An error-based hypothesis would predict that the cerebellar signal should carry information about the form of the error (e.g., absence or presence of the force pulse in our study). While we could not detect a reliable difference between the two types of errors, this failure was likely due to the limited spatial resolution and design of our study. If separate but nearby (or interdigitated) populations of neurons are activated in response to different prediction errors, the changes in the BOLD response are likely to be highly similar. Advances in high-resolution imaging combined with multivariate analysis techniques promises to provide a useful tool to analyze the information content within regions of activation (Diedrichsen et al., 2011; Wiestler et al., 2011).
Evidence to date suggests that the BOLD response in the cerebellum is primarily driven by mossy fiber activity and local processing, possibly with very little direct influence of the rate of complex spikes (Thomsen et al., 2009; Diedrichsen et al., 2010; Howarth et al., 2010; but see Zhang et al., 2003). Thus, the activation pattern we observed does not directly contradict evidence suggesting that climbing fibers selectively convey the unexpected presence of sensory events. Unfortunately, our effort to determine climbing fiber activity by studying the BOLD activation in the inferior olive was inconclusive. While we did not observe a signature of prediction errors, such activation may have been masked by physiological changes related to heart rate and breathing (Harvey et al., 2008). Previous studies that have reported error-related signal changes in the inferior olive have ignored this important factor (Xu et al., 2006; Liu et al., 2008).
Our understanding of general principles underlying the role of the cerebellum in motor learning requires the clear identification of the neural correlates of these processes. The current investigation has provided an important step by demonstrating that sensory prediction errors during reaching movements are represented within the cerebellar cortex. Moreover, these signals can represent errors conveyed by both the expected presence and unexpected absence of sensory stimulation.
Footnotes
This work was supported by National Science Foundation Grant 0726685.
References
- Albus J. A theory of cerebellar function. Math Biosci. 1971;10:25–61. [Google Scholar]
- Andersson G, Armstrong DM. Complex spikes in Purkinje cells in the lateral vermis (b zone) of the cat cerebellum during locomotion. J Physiol. 1987;385:107–134. doi: 10.1113/jphysiol.1987.sp016487. [DOI] [PMC free article] [PubMed] [Google Scholar]
- Berthier NE, Moore JW. Cerebellar Purkinje cell activity related to the classically conditioned nictitating membrane response. Exp Brain Res. 1986;63:341–350. doi: 10.1007/BF00236851. [DOI] [PubMed] [Google Scholar]
- Birn RM, Smith MA, Jones TB, Bandettini PA. The respiration response function: the temporal dynamics of fMRI signal fluctuations related to changes in respiration. Neuroimage. 2008;40:644–654. doi: 10.1016/j.neuroimage.2007.11.059. [DOI] [PMC free article] [PubMed] [Google Scholar]
- Blakemore SJ, Wolpert DM, Frith CD. Central cancellation of self-produced tickle sensation. Nat Neurosci. 1998;1:635–640. doi: 10.1038/2870. [DOI] [PubMed] [Google Scholar]
- Blakemore SJ, Frith CD, Wolpert DM. The cerebellum is involved in predicting the sensory consequences of action. Neuroreport. 2001;12:1879–1884. doi: 10.1097/00001756-200107030-00023. [DOI] [PubMed] [Google Scholar]
- Chang C, Cunningham JP, Glover GH. Influence of heart rate on the BOLD signal: the cardiac response function. Neuroimage. 2009;44:857–869. doi: 10.1016/j.neuroimage.2008.09.029. [DOI] [PMC free article] [PubMed] [Google Scholar]
- Cheng S, Sabes PN. Modeling sensorimotor learning with linear dynamical systems. Neural Comput. 2006;18:760–793. doi: 10.1162/089976606775774651. [DOI] [PMC free article] [PubMed] [Google Scholar]
- Christian KM, Thompson RF. Neural substrates of eyeblink conditioning: acquisition and retention. Learn Mem. 2003;10:427–455. doi: 10.1101/lm.59603. [DOI] [PubMed] [Google Scholar]
- Crone EA, Jennings JR, Van der Molen MW. Developmental change in feedback processing as reflected by phasic heart rate changes. Dev Psychol. 2004;40:1228–1238. doi: 10.1037/0012-1649.40.6.1228. [DOI] [PubMed] [Google Scholar]
- Crone EA, Bunge SA, de Klerk P, van der Molen MW. Cardiac concomitants of performance monitoring: context dependence and individual differences. Brain Res Cogn Brain Res. 2005;23:93–106. doi: 10.1016/j.cogbrainres.2005.01.009. [DOI] [PubMed] [Google Scholar]
- Dale AM. Optimal experimental design for event-related fMRI. Hum Brain Mapp. 1999;8:109–114. doi: 10.1002/(SICI)1097-0193(1999)8:2/3<109::AID-HBM7>3.0.CO;2-W. [DOI] [PMC free article] [PubMed] [Google Scholar]
- Damen EJ, Brunia CH. Changes in heart rate and slow brain potentials related to motor preparation and stimulus anticipation in a time estimation task. Psychophysiology. 1987;24:700–713. doi: 10.1111/j.1469-8986.1987.tb00353.x. [DOI] [PubMed] [Google Scholar]
- Desmurget M, Pélisson D, Urquizar C, Prablanc C, Alexander GE, Grafton ST. Functional anatomy of saccadic adaptation in humans. Nat Neurosci. 1998;1:524–528. doi: 10.1038/2241. [DOI] [PubMed] [Google Scholar]
- Desmurget M, Pélisson D, Grethe JS, Alexander GE, Urquizar C, Prablanc C, Grafton ST. Functional adaptation of reactive saccades in humans: a PET study. Exp Brain Res. 2000;132:243–259. doi: 10.1007/s002210000342. [DOI] [PubMed] [Google Scholar]
- Diedrichsen J. A spatially unbiased atlas template of the human cerebellum. Neuroimage. 2006;33:127–138. doi: 10.1016/j.neuroimage.2006.05.056. [DOI] [PubMed] [Google Scholar]
- Diedrichsen J, Hashambhoy Y, Rane T, Shadmehr R. Neural correlates of reach errors. J Neurosci. 2005a;25:9919–9931. doi: 10.1523/JNEUROSCI.1874-05.2005. [DOI] [PMC free article] [PubMed] [Google Scholar]
- Diedrichsen J, Verstynen T, Lehman SL, Ivry RB. Cerebellar involvement in anticipating the consequences of self-produced actions during bimanual movements. J Neurophysiol. 2005b;93:801–812. doi: 10.1152/jn.00662.2004. [DOI] [PubMed] [Google Scholar]
- Diedrichsen J, Balsters JH, Flavell J, Cussans E, Ramnani N. A probabilistic MR atlas of the human cerebellum. Neuroimage. 2009;46:39–46. doi: 10.1016/j.neuroimage.2009.01.045. [DOI] [PubMed] [Google Scholar]
- Diedrichsen J, Verstynen T, Schlerf J, Wiestler T. Advances in functional imaging of the human cerebellum. Curr Opin Neurol. 2010;23:382–387. doi: 10.1097/WCO.0b013e32833be837. [DOI] [PubMed] [Google Scholar]
- Diedrichsen J, Ridgway GR, Friston KJ, Wiestler T. Comparing the similarity and spatial structure of neural representations: a pattern-component model. Neuroimage. 2011;55:1665–1678. doi: 10.1016/j.neuroimage.2011.01.044. [DOI] [PMC free article] [PubMed] [Google Scholar]
- Donchin O, Francis JT, Shadmehr R. Quantifying generalization from trial-by-trial behavior of adaptive systems that learn with basis functions: theory and experiments in human motor control. J Neurosci. 2003;23:9032–9045. doi: 10.1523/JNEUROSCI.23-27-09032.2003. [DOI] [PMC free article] [PubMed] [Google Scholar]
- Fautrelle L, Pichat C, Ricolfi F, Peyrin C, Bonnetblanc F. Catching falling objects: the role of the cerebellum in processing sensory–motor errors that may influence updating of feedforward commands. An fMRI study. Neuroscience. 2011;190:135–144. doi: 10.1016/j.neuroscience.2011.06.034. [DOI] [PubMed] [Google Scholar]
- Gellman RS, Miles FA. A new role for the cerebellum in conditioning? Trends Neurosci. 1985;8:181–182. [Google Scholar]
- Glover GH, Li TQ, Ress D. Image-based method for retrospective correction of physiological motion effects in fMRI: RETROICOR. Magn Reson Med. 2000;44:162–167. doi: 10.1002/1522-2594(200007)44:1<162::aid-mrm23>3.0.co;2-e. [DOI] [PubMed] [Google Scholar]
- Golla H, Tziridis K, Haarmeier T, Catz N, Barash S, Thier P. Reduced saccadic resilience and impaired saccadic adaptation due to cerebellar disease. Eur J Neurosci. 2008;27:132–144. doi: 10.1111/j.1460-9568.2007.05996.x. [DOI] [PubMed] [Google Scholar]
- Grodd W, Hülsmann E, Lotze M, Wildgruber D, Erb M. Sensorimotor mapping of the human cerebellum: fMRI evidence of somatotopic organization. Hum Brain Mapp. 2001;13:55–73. doi: 10.1002/hbm.1025. [DOI] [PMC free article] [PubMed] [Google Scholar]
- Harvey AK, Pattinson KT, Brooks JC, Mayhew SD, Jenkinson M, Wise RG. Brainstem functional magnetic resonance imaging: disentangling signal from physiological noise. J Magn Reson Imaging. 2008;28:1337–1344. doi: 10.1002/jmri.21623. [DOI] [PubMed] [Google Scholar]
- Horn KM, Pong M, Gibson AR. Discharge of inferior olive cells during reaching errors and perturbations. Brain Res. 2004;996:148–158. doi: 10.1016/j.brainres.2003.10.021. [DOI] [PubMed] [Google Scholar]
- Howarth C, Peppiatt-Wildman CM, Attwell D. The energy use associated with neural computation in the cerebellum. J Cereb Blood Flow Metab. 2010;30:403–414. doi: 10.1038/jcbfm.2009.231. [DOI] [PMC free article] [PubMed] [Google Scholar]
- Imamizu H, Miyauchi S, Tamada T, Sasaki Y, Takino R, Pütz B, Yoshioka T, Kawato M. Human cerebellar activity reflecting an acquired internal model of a new tool. Nature. 2000;403:192–195. doi: 10.1038/35003194. [DOI] [PubMed] [Google Scholar]
- Ito M. Cerebellar learning in the vestibulo–ocular reflex. Trends Cogn Sci. 1998;2:313–321. doi: 10.1016/s1364-6613(98)01222-4. [DOI] [PubMed] [Google Scholar]
- Ito M. Cerebellar long-term depression: characterization, signal transduction, and functional roles. Physiol Rev. 2001;81:1143–1195. doi: 10.1152/physrev.2001.81.3.1143. [DOI] [PubMed] [Google Scholar]
- Jennings JR, van der Molen MW. Cardiac timing and the central regulation of action. Psychol Res. 2002;66:337–349. doi: 10.1007/s00426-002-0106-5. [DOI] [PubMed] [Google Scholar]
- Jennings JR, van der Molen MW, Brock K, Somsen RJ. Response inhibition initiates cardiac deceleration: evidence from a sensory-motor compatibility paradigm. Psychophysiology. 1991;28:72–85. doi: 10.1111/j.1469-8986.1991.tb03390.x. [DOI] [PubMed] [Google Scholar]
- Krakauer JW, Ghilardi MF, Mentis M, Barnes A, Veytsman M, Eidelberg D, Ghez C. Differential cortical and subcortical activations in learning rotations and gains for reaching: a PET study. J Neurophysiol. 2004;91:924–933. doi: 10.1152/jn.00675.2003. [DOI] [PubMed] [Google Scholar]
- Liu T, Xu D, Ashe J, Bushara K. Specificity of inferior olive response to stimulus timing. J Neurophysiol. 2008;100:1557–1561. doi: 10.1152/jn.00961.2007. [DOI] [PMC free article] [PubMed] [Google Scholar]
- Marr D. A theory of cerebellar cortex. J Physiol. 1969;202:437–470. doi: 10.1113/jphysiol.1969.sp008820. [DOI] [PMC free article] [PubMed] [Google Scholar]
- Martin TA, Keating JG, Goodkin HP, Bastian AJ, Thach WT. Throwing while looking through prisms. I. Focal olivocerebellar lesions impair adaptation. Brain. 1996;119:1183–1198. doi: 10.1093/brain/119.4.1183. [DOI] [PubMed] [Google Scholar]
- Maschke M, Gomez CM, Ebner TJ, Konczak J. Hereditary cerebellar ataxia progressively impairs force adaptation during goal-directed arm movements. J Neurophysiol. 2004;91:230–238. doi: 10.1152/jn.00557.2003. [DOI] [PubMed] [Google Scholar]
- Mauk MD, Steinmetz JE, Thompson RF. Classical conditioning using stimulation of the inferior olive as the unconditioned stimulus. Proc Natl Acad Sci U S A. 1986;83:5349–5353. doi: 10.1073/pnas.83.14.5349. [DOI] [PMC free article] [PubMed] [Google Scholar]
- McCormick DA, Steinmetz JE, Thompson RF. Lesions of the inferior olivary complex cause extinction of the classically conditioned eyeblink response. Brain Res. 1985;359:120–130. doi: 10.1016/0006-8993(85)91419-2. [DOI] [PubMed] [Google Scholar]
- Morton SM, Bastian AJ. Cerebellar contributions to locomotor adaptations during splitbelt treadmill walking. J Neurosci. 2006;26:9107–9116. doi: 10.1523/JNEUROSCI.2622-06.2006. [DOI] [PMC free article] [PubMed] [Google Scholar]
- Pruessmann KP, Weiger M, Scheidegger MB, Boesiger P. SENSE: sensitivity encoding for fast MRI. Magn Reson Med. 1999;42:952–962. [PubMed] [Google Scholar]
- Rijntjes M, Buechel C, Kiebel S, Weiller C. Multiple somatotopic representations in the human cerebellum. Neuroreport. 1999;10:3653–3658. doi: 10.1097/00001756-199911260-00035. [DOI] [PubMed] [Google Scholar]
- Sadeghi SG, Minor LB, Cullen KE. Neural correlates of motor learning in the vestibulo-ocular reflex: dynamic regulation of multimodal integration in the macaque vestibular system. J Neurosci. 2010;30:10158–10168. doi: 10.1523/JNEUROSCI.1368-10.2010. [DOI] [PMC free article] [PubMed] [Google Scholar]
- Schmitz C, Jenmalm P, Ehrsson HH, Forssberg H. Brain activity during predictable and unpredictable weight changes when lifting objects. J Neurophysiol. 2005;93:1498–1509. doi: 10.1152/jn.00230.2004. [DOI] [PubMed] [Google Scholar]
- Seidler RD, Purushotham A, Kim SG, Uğurbil K, Willingham D, Ashe J. Cerebellum activation associated with performance change but not motor learning. Science. 2002;296:2043–2046. doi: 10.1126/science.1068524. [DOI] [PubMed] [Google Scholar]
- Shmueli K, van Gelderen P, de Zwart JA, Horovitz SG, Fukunaga M, Jansma JM, Duyn JH. Low-frequency fluctuations in the cardiac rate as a source of variance in the resting-state fMRI BOLD signal. Neuroimage. 2007;38:306–320. doi: 10.1016/j.neuroimage.2007.07.037. [DOI] [PMC free article] [PubMed] [Google Scholar]
- Smith MA, Shadmehr R. Intact ability to learn internal models of arm dynamics in Huntington's disease but not cerebellar degeneration. J Neurophysiol. 2005;93:2809–2821. doi: 10.1152/jn.00943.2004. [DOI] [PubMed] [Google Scholar]
- Stoodley CJ, Schmahmann JD. Functional topography in the human cerebellum: A meta-analysis of neuroimaging studies. Neuroimage. 2009;44:489–501. doi: 10.1016/j.neuroimage.2008.08.039. [DOI] [PubMed] [Google Scholar]
- Thomsen K, Piilgaard H, Gjedde A, Bonvento G, Lauritzen M. Principal cell spiking, postsynaptic excitation, and oxygen consumption in the rat cerebellar cortex. J Neurophysiol. 2009;102:1503–1512. doi: 10.1152/jn.00289.2009. [DOI] [PubMed] [Google Scholar]
- Thoroughman KA, Shadmehr R. Learning of action through adaptive combination of motor primitives. Nature. 2000;407:742–747. doi: 10.1038/35037588. [DOI] [PMC free article] [PubMed] [Google Scholar]
- Tseng YW, Diedrichsen J, Krakauer JW, Shadmehr R, Bastian AJ. Sensory prediction errors drive cerebellum-dependent adaptation of reaching. J Neurophysiol. 2007;98:54–62. doi: 10.1152/jn.00266.2007. [DOI] [PubMed] [Google Scholar]
- Wiestler T, McGonigle DJ, Diedrichsen J. Integration of sensory and motor representations of single fingers in the human cerebellum. J Neurophysiol. 2011;105:3042–3053. doi: 10.1152/jn.00106.2011. [DOI] [PubMed] [Google Scholar]
- Wolpert DM, Miall RC, Kawato M. Internal models in the cerebellum. Trends Cogn Sci. 1998;2:338–347. doi: 10.1016/s1364-6613(98)01221-2. [DOI] [PubMed] [Google Scholar]
- Wolpert DM, Diedrichsen J, Flanagan JR. Principles of sensorimotor learning. Nat Rev Neurosci. 2011;12:739–751. doi: 10.1038/nrn3112. [DOI] [PubMed] [Google Scholar]
- Xu D, Liu T, Ashe J, Bushara KO. Role of the olivo-cerebellar system in timing. J Neurosci. 2006;26:5990–5995. doi: 10.1523/JNEUROSCI.0038-06.2006. [DOI] [PMC free article] [PubMed] [Google Scholar]
- Zhang Y, Forster C, Milner TA, Iadecola C. Attenuation of activity-induced increases in cerebellar blood flow by lesion of the inferior olive. Am J Physiol Heart Circ Physiol. 2003;285:H1177–H1182. doi: 10.1152/ajpheart.00240.2003. [DOI] [PubMed] [Google Scholar]