

Abstract
We have previously described strong associations between frailty, a measure of physiologic reserve initially described and validated in geriatrics, and early hospital readmission as well as delayed graft function. The goal of this study was to estimate its association with postkidney transplantation (post-KT) mortality. Frailty was prospectively measured in 537 KT recipients at the time of transplantation between November 2008 and August 2013. Cox proportional hazards models were adjusted for confounders using a novel approach to substantially improve model efficiency and generalizability in single-center studies. We precisely estimated the confounder coefficients using the large sample size of the Scientific Registry of Transplantation Recipients (n = 37 858) and introduced these into the single-center model, which then estimated the adjusted frailty coefficient. At 5 years, the survivals were 91.5%, 86.0% and 77.5% for nonfrail, intermediately frail and frail KT recipients, respectively. Frailty was independently associated with a 2.17-fold (95% CI: 1.01–4.65, p = 0.047) higher risk of death. In conclusion, regardless of age, frailty is a strong, independent risk factor for post-KT mortality, even after carefully adjusting for many confounders using a novel, efficient statistical approach.
Introduction
Current risk prediction in kidney transplantation (KT) is poor; even models based on large national registries with thousands of patients have a C-statistic of 0.67 (1 year) and 0.64 (3 year) (1). In other words, even the best models that we currently have are able to correctly discriminate patients who died from those who survived only slightly better than by chance. This inability to identify which KT recipients are at highest risk of poor outcomes causes regulatory consternation, limits the ability to select appropriate candidates for transplantation, and complicates matching patients to donors. Improvements in our ability to understand which KT recipients are at highest risk of poor outcomes will come from single or multicenter cohort studies of novel predictors. We are interested in a novel domain of risk, namely frailty (2).
Frailty, a measure of physiologic reserve, was initially described and validated by Fried et al (2) in geriatric populations and is emerging as an important risk factor in surgical patients and transplant recipients. In older patients undergoing general surgery, frailty is independently associated with postoperative complications (3,4), as well as length of stay (4), discharge to a skilled or assisted-living facility (4–6) and mortality (6). In general surgery patients of all ages, intermediately frail and frail patients have twice the odds of developing 30-day complications (7). In liver transplant recipients, core muscle size, which has been posited as an objective surrogate of frailty, is associated with higher risk of posttransplant infectious complications (8) and mortality (9). In KT recipients, frailty is associated with 94% increased risk of delayed graft function (10) and 61% increased risk of early hospital readmission (11). However, the association between frailty and mortality in KT recipients remains unclear.
One challenge of studying novel risk factors is that 30 or more predictors of post-KT mortality are already known from registry-based studies. Most single-center studies, while advantageous because they potentially introduce granular ascertainment of novel risk factors, have small sample sizes that cannot statistically accommodate adjustment for all known predictors (i.e. the models would be overfit). This creates a problem in that estimation of the independent effect of a novel risk factor (i.e. adjusting for known predictors) is not typically possible with small sample sizes. In this study, we used a novel hybrid registry-augmented regression method to leverage the precision of large sample size registry estimates with the novelty of a smaller size single-center study; by doing so, we were able to estimate the independent association of frailty and mortality in KT recipients of all ages, adjusting for the many known predictors.
Methods
Study design
This was a prospective, single-center, longitudinal study of 537 KT recipients at Johns Hopkins Hospital, Baltimore, Maryland, between December 2008 and November 2013. The study population described in this analysis was part of an ongoing study of frailty in KT recipients at Johns Hopkins. Participants who were enrolled in the cohort were not different than those who were not enrolled on important factors including percentage of female recipients (40.0% vs. 44.8%, p = 0.15), recipient age (53.0 vs. 53.8 years, p = 0.37), percentage of African American recipients (38.9% vs. 39.0%, p = 0.99) as well as other recipient and transplant factors. Additionally, this study used data from the Scientific Registry of Transplant Recipients (SRTR). The SRTR data system includes data on all donor, waitlisted candidates, and transplant recipients in the United States, submitted by the members of the Organ Procurement and Transplantation Network (OPTN). The Health Resources and Services Administration, US Department of Health and Human Services provides oversight to the activities of the OPTN and SRTR contractors.
Frailty was measured at the time of KT as described below. Recipient factors (age, race, sex, BMI, diabetes as the cause of end-stage renal disease [ESRD], time on dialysis and hepatitis C virus [HCV] status), transplant factors (panel reactive antibody [PRA], number of HLA mismatches, previous transplant, preemptive KT and cold ischemia time) and donor factors (race, donor type, deceased expanded criteria [ECD], donation after cardiac death donor [DCD] and history of hypertension) were obtained from the data that Johns Hopkins reports to the OPTN. The Johns Hopkins Institutional Review Board approved the study.
Frailty
At admission for KT, frailty was measured as defined and validated by Fried in older adults (2,12–21) and by our group in ESRD and KT populations (10,11,22,23). Frailty was based on five components: shrinking (self-report of unintentional weight loss of more than 10 lbs in the past year based on dry weight); weakness (grip-strength below an established cutoff based on gender and BMI); exhaustion (self-report); low activity (kcals/week below an established cutoff); and slowed walking speed (walking time of 15 feet below an established cutoff by gender and height) (Table S1) (2). Each of the five components was scored as 0 or 1 representing the absence or presence of that component. The aggregate frailty score was calculated as the sum of the component scores (range 0–5); nonfrail was defined as a score of 0 or 1, intermediate frailty was defined as a score of 2 and frailty was defined as a score of 3 or higher, as we have previously published (22,23).
Statistical analysis
Differences in recipient, transplant and donor characteristics by frailty status were tested using analysis of variance and Fisher's exact tests where appropriate. The independent association of frailty and post-KT mortality was estimated using a hybrid registry-augmented Cox proportional hazards model. Using a large cohort from the SRTR (n = 37 858 KT recipients between 2009 and 2011), we precisely estimated the coefficients of every SRTR-measured confounder (recipient age, sex, race, diabetes, time on dialysis and preemptive KT, as well as donor type [deceased standard criteria donor, ECD, DCD vs. live] and cold ischemia time). This SRTR registry-based model was estimated using SRTR data. Then, we introduced these coefficients back into the single-center model (using forced values), so that the only coefficients estimated were those of frailty (intermediate vs. nonfrail and frail vs. nonfrail); in other words, this allowed us to estimate an independent effect with only two degrees of freedom. The coefficients of the confounders were constrained to be the coefficients observed in the SRTR model through the use of a model offset. Participants were administratively censored at the end of follow-up (March 7, 2014). Robust standard errors (Huber-White sandwich estimator) were used. The hybrid registry augmented method is:
where Xp is the value confounder as measured in the single-center cohort of the pth variable, and λ0(t) is baseline hazard function. Bp constrained is the constrained coefficient from the registry-based model.
We tested for effect modification of the association of frailty and post-KT mortality by recipient age, sex and race using a Wald test. Finally, as a sensitivity analysis, we estimated the association of frailty and post-KT mortality using an over fitted model where we directly adjusted for the confounders in our single-center cohort model. We also assessed the relative ranking of frailty as a predictor for mortality using a Classification and Regression Tree (CART) (24), which is a machine learning technique for survival analysis. For all analyses, a p-value <0.05 was considered significant. All analyses were performed using STATA 12.0 (College Station, TX) except for the CART analysis, which was performed in R version 3.1 (the R Foundation for Statistical Computing, Vienna, Austria).
Results
Study population
Among 537 study participants, the mean age was 53.0 years (SD = 14.0), 40.0% were female, 38.9% were African American and 44.9% received live donor transplants; 19.9% were frail and 33.0% were intermediately frail at the time of KT (Figure 1). The median follow up time was 2.7 years (interquartile range [IOR]: 1.4–4.2). Consistent with previous findings of frailty as an independent domain (11), no recipient factors were statistically significantly associated with frailty except age (Table 1). Frail patients were more likely to receive ECD kidneys (12.2% vs. 4.0% for intermediately frail and 4.0% for nonfrail, p = 0.01). While 13.2% of the cohort received a live donor HLA incompatible KT, 4.3% received a deceased donor HLA incompatible KT and 7.5% received a live donor ABO incompatible KT, desensitization was not associated with frailty (live donor, HLA incompatible p = 0.32; deceased donor, HLA incompatible p = 0.28; and live donor, ABO incompatible KT p = 0.75; any desensitization technique p = 0.89).
Figure 1. Distribution of frailty score at the time of kidney transplantation (n = 537).

Nonfrail was defined as a score of 0 or 1, intermediately frail was defined as a score of 2 and frail was defined as a score of 3 or higher.
Table 1.
Kidney transplantation (KT) recipients, stratified by frailty status at the time of transplantation (n = 537)
| Nonfrail (n = 253) | Intermediately frail (n = 177) | Frail (n = 107) | p-Value | |
|---|---|---|---|---|
| Recipient | ||||
| Age | 50.7 (14.0) | 54.5 (13.7) | 55.8 (14.0) | 0.002 |
| African American race | 37.6 | 39.6 | 41.1 | 0.8 |
| Female sex | 39.9 | 40.7 | 39.3 | 0.9 |
| BMI (kg/m2) | 27.3 (6.0) | 27.6 (5.7) | 27.6 (5.9) | 0.9 |
| Diabetes | 13.8 | 22.0 | 20.6 | 0.1 |
| Time on dialysis (years) | 2.0 (0.4–4.4) | 2.0 (0.5–3.8) | 1.7 (0.4–3.7) | 0.5 |
| HCV positive | 8.3 | 7.9 | 12.2 | 0.4 |
| Previous transplant | 18.2 | 13.0 | 17.8 | 0.3 |
| Transplant | ||||
| PRA = 0 | 38.3 | 36.2 | 59.8 | 0.8 |
| 0 HLA mismatch | 4.0 | 5.7 | 3.7 | 0.7 |
| Preemptive KT | 21.3 | 13.6 | 17.8 | 0.1 |
| Cold ischemia time | 9.7 (1.7–24.0) | 12.8 (1.6–28.6) | 10.5 (2.1–26.4) | 0.5 |
| Donor | ||||
| Live donor | 48.2 | 42.8 | 42.1 | 0.3 |
| ECD | 4.0 | 4.0 | 12.2 | 0.01 |
| DCD | 7.5 | 9.6 | 8.4 | 0.7 |
| White race | 73.9 | 71.2 | 74.8 | 0.8 |
| History of hypertension | 14.2 | 15.3 | 20.6 | 0.3 |
| Creatinine > 1.5 | 15.8 | 17.0 | 12.2 | 0.6 |
Nonfrail was defined as a score of 0 or 1, intermediately frail was defined as a score of 2 and frail was defined as a score of 3 or higher. The mean [SD] are presented for age and BMI. The median and interquartile range are presented for time on dialysis and cold ischemia time. All other measures are %. HCV, hepatitis C virus; PRA, panel reactive antibody; ECD, deceased expanded criteria; DCD, donation after cardiac death donor.
Frailty and mortality
Frail KT recipients had the lowest survival (Figure 2) (p = 0.04). At 1 year, the survival was 98.4% for those who were nonfrail, 97.6% for those who were intermediately frail and 94.3% for those who were frail; at 5 years, the corresponding survivals were 91.5%, 86.0% and 77.5%, respectively (Table 2). When stratified by age, frail KT recipients had higher 1-, 3- and 5-year mortality than their nonfrail counterparts (Table 2), although the 1-year survival was similar for recipients who were nonfrail and frail at age 45–64 as well as the 3-year survival for recipients who nonfrail and frail at age ≥65.
Figure 2. Survival, by frailty status at the time of transplantation (n = 537).
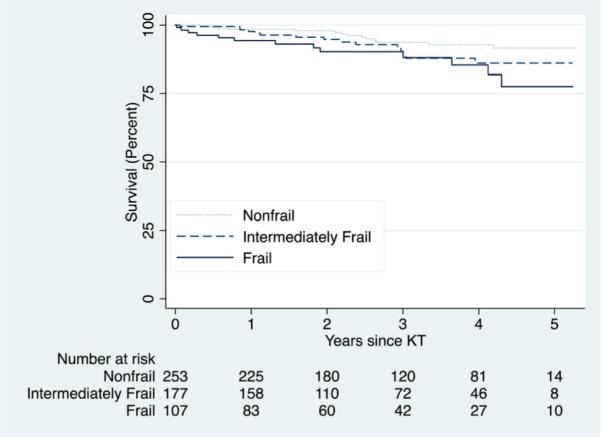
Log-rank test p-value = 0.0396. Nonfrail was defined as a score of 0 or 1, intermediately frail was defined as a score of 2 and frail was defined as a score of 3 or higher.
Table 2.
Survival, by frailty status at the time of transplantation (n = 537) and stratified by chronologic age
| Nonfrail (n = 253) | Intermediately frail (n = 177) | Frail (n = 107) | |
|---|---|---|---|
| All ages | |||
| 1-year | 98.4 (95.8–99.4) | 97.6 (93.7–99.1) | 94.3 (87.7–97.4) |
| 3-year | 93.7 (89.0–96.4) | 90.3 (81.4–93.7) | 90.2 (81.7–94.8) |
| 5-year | 91.5 (85.6–95.1) | 86.0 (77.1–91.7) | 77.5 (60.9–87.7) |
| <45 | |||
| 1-year | 100 | 100 | 96.7 (72.9–99.4) |
| 3-year | 100 | 92.2 (71.8–98.0) | 89.7 (64.0–97.4) |
| 5-year | 100 | 92.2 (71.8–98.0) | 89.7 (64.0–97.4) |
| 45–64 | |||
| 1-year | 97.7 (93.2–99.3) | 96.5 (89.6–98.9) | 98.2 (87.8–99.7) |
| 3-year | 94.5 (87.9–97.5) | 88.1 (76.8–94.1) | 93.0 (79.5–97.7) |
| 5-year | 92.9 (85.1–96.6) | 84.1 (69.3–92.2) | 76.5 (50.9–89.9) |
| ≥65 | |||
| 1-year | 97.5 (83.6–99.6) | 97.4 (83.2–99.6) | 85.8 (66.3–94.4) |
| 3-year | 80.8 (61.8–91.0) | 87.9 (65.4–96.2) | 85.8 (66.3–94.4) |
| 5-year | 74.0 (50.9–87.5) | 82.4 (58.2–93.3) | 73.5 (39.7–90.3) |
Patient survival is %. Nonfrail was defined as a score of 0 or 1, intermediately frail was defined as a score of 2 and frail was defined as a score of 3 or higher. Survival is shown as estimate and 95% confidence interval, and was estimated using a Kaplan-Meier approach.
In an unadjusted regression model, frail KT recipients had 2.58-fold (95% CI: 1.21–5.49, p = 0.014) increased risk of mortality compared to those who were nonfrail (Table 3). There was a “dose response” of frailty, such that the risk of mortality was lowest for the nonfrail, greater for the intermediately frail and greatest for the frail KT recipients (p for trend = 0.013). After adjusting for confounders using our novel hybrid registry-augmented model, frail KT recipients had 2.17-fold (95% CI: 1.01–4.65, p = 0.047) increased risk of mortality than those who were nonfrail. The dose response of frailty and mortality remained after adjustment for confounders (p for trend = 0.046). Results were similar when we directly adjusted for the confounders in a single-center forced model sensitivity analysis (Table 3) and using CART we identified frailty as the third most important independent predictor of mortality among all the SRTR variables.
Table 3.
Risk of mortality in kidney transplantation (KT) recipients, by frailty status at the time of transplantation (n = 537)
| Hazard ratio (95% confidence interval) for mortality |
|||
|---|---|---|---|
| Unadjusted | Adjusted (hybrid) | Adjusted (traditional | |
| Intermediately frail | 1.70 (0.82–3.52) | 1.49 (0.73–3.06) | 1.44 (0.69–3.02) |
| p-Value | 0.153 | 0.276 | 0.332 |
| Frail | 2.58 (1.21–5.49) | 2.17 (1.01–4.65) | 2.22 (1.03–4.81) |
| p-Value | 0.014 | 0.047 | 0.042 |
Nonfrail was defined as a score of 0 or 1, intermediately frail was defined as a score of 2 and frail was defined as a score of 3 or higher. The adjusted model was adjusted for recipient age, sex, race, diabetes, time on dialysis and preemptive KT, as well as donor type (deceased standard criteria donor, deceased expanded criteria, donation after cardiac death donor vs. live) and cold ischemia time. In the hybrid approach, we constrained the coefficients for all the adjustment factors to be the coefficients as estimated from the Scientific Registry of Transplant Recipients. In the traditional approach, a forced model was fit to only our single-center data.
Additionally, frailty improves the predictive accuracy (C-statistic 0.735 without frailty and 0.751 with frailty)— to the same extent as age and diabetes but to a greater extent than sex or race. In other words, the improvement of C-statistic by adding frailty was similar to the improvement observed by adding age (C-statistic 0.740 without age and 0.751 with age) and diabetes (C-statistic 0.737 without diabetes and 0.750 with diabetes), but stronger than the improvement observed by adding sex (C-statistic 0.748 without sex and 0.748 with sex) or race (C-statistic 0.750 without race and 0.751 with race).
Effect heterogeneity
Consistent with our previous findings in KT (11), the association of frailty and mortality did not differ between older and younger KT recipients (interaction p = 0.74), men and women (interaction p = 0.26) or African American and white KT recipients (interaction p = 0.37).
Discussion
In this single-center prospective, longitudinal study of 537 patients, frail KT recipients were at 2.17-fold increased risk of mortality compared to their nonfrail counterparts, even after accounting for recipient, donor and transplant confounders using a novel, efficient analytical method. The hybrid registry-augmented model proved to be a feasible solution to the problem of adjusting for multiple confounders in a single-center (relatively small-volume) study of a novel risk factor.
In community-dwelling older adults, frailty was a strong predictor of mortality, with a 2.24-fold (95% CI: 1.51–3.33) increased risk of mortality in those who were frail after adjusting for potential confounders (2). In older adults undergoing percutaneous coronary interventions, frailty was associated with a 4.19-fold (95% CI: 1.85–9.51) increased risk of mortality (25). Additionally, in a cohort of patients of all ages undergoing hemodialysis, we observed a 2.60-fold (95% CI: 1.04–6.49) increased risk of mortality in those who were frail after adjusting for confounders (22). These estimates of the independent association of frailty and mortality are similar to the risk we observed in this study of KT recipients of all ages. These similarities across study populations suggest that frailty captures a unique domain of risk, namely physiologic reserve, that is, associated with increased mortality risk, not only older adults, but also patients with ESRD.
Identification of novel recipient risk factors, like frailty, has previously been challenging, as most studies of post-KT outcomes were either registry studies that draw on a large sample size but limited breadth of data capture, or single-center studies that could potentially capture novel factors but were commonly too small to properly adjust for the many factors that are already well-known. However, our novel hybrid registry-augmented model helps overcome the challenge of adjusting for all of these confounders in single-center studies. Our method allows for the estimation of the impact of a novel risk factor with precision but without the risk of overfitting inherent in models with small sample sizes. This novel method is needed to adjust for all of the confounders that are measured in SRTR/OPTN registry models when estimating the association of novel risk factors and post-KT mortality in single-center studies. However, there are limitations to this novel method. While we are able to leverage information from the SRTR/OPTN registry, we recognize that we are limited by missing and misclassified data.
Strengths of this study were the prospective measurement of a validated, objective frailty instrument and reliable ascertainment of the recipient, donor and transplant factors. Additionally, our novel analytical method helped us properly yet efficiently adjust for many confounders, without overfitting the model. The main limitation was the single-center study design. However, we were able to overcome this limitation by developing a new method to leverage registry data and apply it to our single-center cohort. Furthermore, the lack of effect heterogeneity by major recipient characteristics suggests that our findings are generalizable to other populations that might not share the same characteristics as ours. We recognize that due to the relatively few outcomes in our single-center study, we may not be powered to detect all interactions with frailty. Additionally, measurements of frailty were only available at the time of transplantation; however, any subsequent measures of frailty will be impacted by the transplant.
In conclusion, frailty is an independent risk factor for mortality in KT recipients of all ages. This novel measure of physiologic reserve was associated with a 2.17-fold increase in risk even after accounting for many recipient, donor and transplant factors. Frailty, as defined by Fried et al (2), may be useful in clinical transplant practice because it takes less than 10 min to measure, patients are able to complete the assessment prior to KT and the score is easy to interpret. Recipients who are frail at the time of KT should be identified and managed accordingly. Patient survival may be improved by closer monitoring of frail recipients after KT.
Supplementary Material
Acknowledgments
We thank the study participants, as well as the research staff at Johns Hopkins, especially Amanda Brennan Weaver and Erika Jones for their dedication to this study. This study was supported by NIH grant R01AG042504 (PI: DS). MAM-D was supported by the American Society of Nephrology Carl W. Gottschalk Research Scholar Grant and Johns Hopkins University Claude D. Pepper Older Americans Independence Center, National Institute on Aging (P30-AG021334) and K01AG043501 from the National Institute on Aging. MS was supported by T32AG000247 from the National Institute on Aging. EK was supported by F32AG044994 from the National Institute on Aging. BO was supported by F32DK093218 from the National Institute of Diabetes and Digestive and Kidney Diseases of the NIH. NG and DS were supported by the Doris Duke Charitable Foundation Clinical Research Mentorship Grant. The data reported here have been supplied by the Minneapolis Medical Research Foundation (MMRF) as the contractor for the Scientific Registry of Transplant Recipients (SRTR). The interpretation and reporting of these data are the responsibility of the author(s) and in no way should be seen as an official policy of or interpretation by the SRTR or the US Government.
Abbreviations
- CART
Classification and Regression Tree
- DCD
donation after cardiac death donor
- ECD
deceased expanded criteria
- ESRD
end-stage renal disease
- HCV
hepatitis C virus
- IQR
interquartile range
- KT
kidney transplantation
- OPTN
Organ Procurement and Transplant Network
- PRA
panel reactive antibody
- SRTR
Scientific Registry of Transplantation Recipients
Footnotes
Disclosure
The authors of this manuscript have no conflicts of interest to disclose as described by the American Journal of Transplantation.
Supporting Information
Additional Supporting Information may be found in the online version of this article.
References
- 1.Schold JD, Srinivas TR, Howard RJ, Jamieson IR, Meier-Kriesche HU. The association of candidate mortality rates with kidney transplant outcomes and center performance evaluations. Transplantation. 2008;85:1–6. doi: 10.1097/01.tp.0000297372.51408.c2. [DOI] [PubMed] [Google Scholar]
- 2.Fried LP, Tangen CM, Walston J, et al. Frailty in older adults: Evidence for a phenotype. J Gerontol A. 2001;56:M146–156. doi: 10.1093/gerona/56.3.m146. [DOI] [PubMed] [Google Scholar]
- 3.Robinson TN, Wu DS, Pointer L, Dunn CL, Cleveland JC, Jr, Moss M. Simple frailty score predicts postoperative complications across surgical specialties. Am J Surg. 2013;206:544–550. doi: 10.1016/j.amjsurg.2013.03.012. [DOI] [PMC free article] [PubMed] [Google Scholar]
- 4.Makary MA, Segev DL, Pronovost PJ, et al. Frailty as a predictor of surgical outcomes in older patients. J Am Coll Surg. 2010;210:901–908. doi: 10.1016/j.jamcollsurg.2010.01.028. [DOI] [PubMed] [Google Scholar]
- 5.Robinson TN, Wallace JI, Wu DS, et al. Accumulated frailty characteristics predict postoperative discharge institutionalization in the geriatric patient. J Am Coll Surg. 2011;213:37–42. doi: 10.1016/j.jamcollsurg.2011.01.056. discussion 42–34. [DOI] [PMC free article] [PubMed] [Google Scholar]
- 6.Robinson TN, Eiseman B, Wallace JI, et al. Redefining geriatric preoperative assessment using frailty, disability and co-morbidity. Ann Surg. 2009;250:449–455. doi: 10.1097/SLA.0b013e3181b45598. [DOI] [PubMed] [Google Scholar]
- 7.Revenig LM, Canter DJ, Taylor MD, et al. Too frail for surgery? Initial results of a large multidisciplinary prospective study examining preoperative variables predictive of poor surgical outcomes. J Am Coll Surg. 2013;217:665–670. e1. doi: 10.1016/j.jamcollsurg.2013.06.012. [DOI] [PubMed] [Google Scholar]
- 8.Krell RW, Kaul DR, Martin AR, et al. Association between sarcopenia and the risk of serious infection among adults undergoing liver transplantation. Liver Transplant. 2013;19:1396–1402. doi: 10.1002/lt.23752. [DOI] [PMC free article] [PubMed] [Google Scholar]
- 9.Englesbe MJ, Patel SP, He K, et al. Sarcopenia and mortality after liver transplantation. J Am Coll Surg. 2010;211:271–278. doi: 10.1016/j.jamcollsurg.2010.03.039. [DOI] [PMC free article] [PubMed] [Google Scholar]
- 10.Garonzik-Wang JM, Govindan P, Grinnan JW, et al. Frailty and delayed graft function in kidney transplant recipients. Arch Surg. 2012;147:190–193. doi: 10.1001/archsurg.2011.1229. [DOI] [PubMed] [Google Scholar]
- 11.McAdams-DeMarco MA, Law A, Salter ML, et al. Frailty and early hospital readmission after kidney transplantation. Am J Transplant. 2013;13:2091–2095. doi: 10.1111/ajt.12300. [DOI] [PMC free article] [PubMed] [Google Scholar]
- 12.Bandeen-Roche K, Xue QL, Ferrucci L, et al. Phenotype of frailty: Characterization in the women's health and aging studies. J Gerontol A. 2006;61:262–266. doi: 10.1093/gerona/61.3.262. [DOI] [PubMed] [Google Scholar]
- 13.Barzilay JI, Blaum C, Moore T, et al. Insulin resistance and inflammation as precursors of frailty: The Cardiovascular Health Study. Arch Intern Med. 2007;167:635–641. doi: 10.1001/archinte.167.7.635. [DOI] [PubMed] [Google Scholar]
- 14.Cappola AR, Xue QL, Fried LP. Multiple hormonal deficiencies in anabolic hormones are found in frail older women: The Women's Health and Aging studies. J Gerontol A. 2009;64:243–248. doi: 10.1093/gerona/gln026. [DOI] [PMC free article] [PubMed] [Google Scholar]
- 15.Leng SX, Hung W, Cappola AR, Yu Q, Xue QL, Fried LP. White blood cell counts, insulin-like growth factor-1 levels, and frailty in community-dwelling older women. J Gerontol A Biol Sci Med Sci. 2009;64:499–502. doi: 10.1093/gerona/gln047. [DOI] [PMC free article] [PubMed] [Google Scholar]
- 16.Leng SX, Xue QL, Tian J, Walston JD, Fried LP. Inflammation and frailty in older women. J Am Geriatr Soc. 2007;55:864–871. doi: 10.1111/j.1532-5415.2007.01186.x. [DOI] [PubMed] [Google Scholar]
- 17.Newman AB, Gottdiener JS, McBurnie MA, et al. Associations of subclinical cardiovascular disease with frailty. J Gerontol A. 2001;56:M158–M166. doi: 10.1093/gerona/56.3.m158. [DOI] [PubMed] [Google Scholar]
- 18.Walston J, McBurnie MA, Newman A, et al. Frailty and activation of the inflammation and coagulation systems with and without clinical comorbidities: Results from the Cardiovascular Health Study. Arch Intern Med. 2002;162:2333–2341. doi: 10.1001/archinte.162.20.2333. [DOI] [PubMed] [Google Scholar]
- 19.Xue QL, Bandeen-Roche K, Varadhan R, Zhou J, Fried LP. Initial manifestations of frailty criteria and the development of frailty phenotype in the Women's Health and Aging Study II. J Gerontol A. 2008;63:984–990. doi: 10.1093/gerona/63.9.984. [DOI] [PubMed] [Google Scholar]
- 20.Chang SS, Weiss CO, Xue QL, Fried LP. Association between inflammatory-related disease burden and frailty: Results from the Women's Health and Aging Studies (WHAS) I and II. Arch Gerontol Geriatr. 2012;54:9–15. doi: 10.1016/j.archger.2011.05.020. [DOI] [PMC free article] [PubMed] [Google Scholar]
- 21.Chang SS, Weiss CO, Xue QL, Fried LP. Patterns of comorbid inflammatory diseases in frail older women: The Women's Health and Aging Studies I and II. J Gerontol A. 2010;65:407–413. doi: 10.1093/gerona/glp181. [DOI] [PMC free article] [PubMed] [Google Scholar]
- 22.McAdams-Demarco MA, Law A, Salter M, et al. Frailty as a novel predictor of mortality and hospitalization in hemodialysis patients of all ages. J Am Geriatr Soc. 2013;61:896–901. doi: 10.1111/jgs.12266. [DOI] [PMC free article] [PubMed] [Google Scholar]
- 23.McAdams-Demarco MA, Suresh S, Law A, et al. Frailty and falls among adult patients undergoing chronic hemodialysis: A prospective cohort study. BMC Nephro. 2013;14:224. doi: 10.1186/1471-2369-14-224. [DOI] [PMC free article] [PubMed] [Google Scholar]
- 24.Breiman L, Friedman J, Olshen R, Stone C. Classification and Regression Trees. Wadsworth Books; Belmont, CA: 1984. [Google Scholar]
- 25.Singh M, Rihal CS, Lennon RJ, et al. Influence of frailty and health status on outcomes in patients with coronary disease undergoing percutaneous revascularization. Circ Cardiovasc Qual Outcomes. 2011;4:496–502. doi: 10.1161/CIRCOUTCOMES.111.961375. [DOI] [PMC free article] [PubMed] [Google Scholar]
Associated Data
This section collects any data citations, data availability statements, or supplementary materials included in this article.