Abstract
Bioluminescence imaging (BLI) detects light generated by luciferase-mediated oxidation of substrate and is used widely for evaluating transgene expression in cell-based assays and in vivo in relevant preclinical models. The most commonly used luciferase for in vivo applications is firefly luciferase (fLuc), for which D-luciferin serves as the substrate. We demonstrated previously that the expression of the ABCG2 efflux transporter can significantly reduce BLI signal output and that HhAntag-691 can inhibit the efflux of D-luciferin, thereby enhancing BLI signal. Here we show that an HhAntag-691-sensitive uptake mechanism facilitates the intracellular concentration of D-luciferin and that the BLI dynamics of different cell lines are coregulated by this uptake mechanism in conjunction with ABCG2-mediated efflux. After administration of D-luciferin, the HhAntag-691-sensitive uptake mechanism generates a rapid increase in BLI signal that decreases over time, whereas ABCG2-mediated efflux stably reduces signal output. We implicate SLC22A4 (OCTN1), a member of the organic cation/zwitterion uptake transporter family, as one potential mediator of the HhAntag-691-sensitive D-luciferin uptake. These findings provide insight into mechanisms that contribute to the cellular uptake kinetics and in vivo biodistribution of D-luciferin.
BIOLUMINESCENCE IMAGING (BLI) is the most commonly used method to image transgene expression in vivo and for drug screening in vitro.1,2 BLI uses a variety of luciferases as reporters to provide an indirect report on the activity of a gene of interest. Of the various luciferase reporters, firefly luciferase (fLuc) is most commonly used. fLuc catalyzes the oxidation of D-luciferin in the presence of oxygen, magnesium ion, and adenosine triphosphate (ATP), which is accompanied by the release of photons that are detected by an externally placed camera.3 In the in vitro cell lysate luciferase assay, where luciferase has direct access to excess concentrations of D-luciferin, light output is directly proportional to luciferase activity. However, BLI involves intact cells, and exogenously administrated D-luciferin must gain access to cytoplasmic fLuc before the light-emitting reaction can occur.1,3 Previous work has shown that D-luciferin is not present in excess relative to fLuc at concentrations commonly used for BLI.1,3–6 It has been a concern that there may not be a homogeneous distribution of D-luciferin within cells and tissues, suggesting that BLI signal may not be reporting directly on fLuc activity.1,3–6 Other factors that might confound BLI include the degree of hypoxia in the tumor microenvironment and the presence of differentially expressed multidrug resistance pumps because D-luciferin is not freely permeable across the cell membrane.1,4,7 Studies that used radiolabeled analogues of D-luciferin determined that uptake varied significantly between different organs and was dependent on the route of administration.4,8 For studies performed in vivo, the pharmacokinetics of D-luciferin have important implications for determining the optimal times postinjection at which to image, achievable signal intensity, sensitivity of detection, and reproducibility.1,6
We previously reported that the ATP-binding cassette (ABC) family transporter ABCG2 causes efflux of D-luciferin, thereby impacting BLI readout in both tissue culture and animal models.5 Here we report that the cellular concentration of D-luciferin is also influenced by a partially characterized uptake mechanism and that BLI dynamics in different cell lines are affected by this mechanism in conjunction with ABCG2. We show that by facilitating inward transport of D-luciferin, the uptake mechanism causes an initial increase in signal followed by a smooth decline over time, whereas ABCG2 overexpression causes a reduced but more stable signal throughout the course of imaging. We found that expression of SLC22A4 (OCTN1), a member of the organic cation/zwitterion uptake transporter family, correlates with the D-luciferin uptake mechanism. These findings provide insight into how membrane transporters affect the cellular uptake kinetics and in vivo biodistribution of D-luciferin. Such information may be used to understand and improve BLI for more precise quantification of gene expression in vivo.
Materials and Methods
Reagents
D-Luciferin sodium salt was purchased from Gold Biotechnology (St. Louis, MO). Fumitremorgin C (FTC) was kindly provided by Dr. Robert Robey (National Cancer Institute, Bethesda, MD). All compounds were prepared in dimethyl sulfoxide (DMSO) for in vitro experiments. HhAntag-691 was kindly provided by Genentech (South San Francisco, CA).
Cell Culture
The human prostate cancer cell line 22Rv1 was cultured in RPMI 1640 (Invitrogen, Carlsbad, CA) supplemented with 10% fetal bovine serum (FBS), 30 mg/L Na2CO3, 45 mg/L glucose, 0.1 mmol/L HEPES, and 0.01 mmol/L sodium pyruvate. Madin-Darby canine kidney (MDCK II) cells were cultured in Dulbecco’s Modified Eagle’s Medium (Invitrogen) supplemented with 10% FBS. Human embryonic kidney (HEK-293) cells were cultured in Minimum Essential Medium (Invitrogen) supplemented with 10% FBS. Cells transiently or stably expressing fLuc have been described previously.5,9,10 All cultures were maintained at 37°C in a humidified 5% CO2/95% air incubator.
Quantitative Reverse Transcriptase–Polymerase Chain Reaction
Expression levels of SLC22A4, SLC22A2 (OCT2), and ABCG2 genes in different cell lines were measured by quantitative reverse transcriptase–polymerase chain reaction (RT-PCR) using ABI PRISM 7500HT (Applied Biosystems, Foster City, CA). Total ribonucleic acid (RNA) was prepared using the RNeasy Mini Kit (Qiagen, Valencia, CA) and quantified using NanoDrop 2000 (Thermoscientific, Rockford, IL). Complementary deoxyribonucleic acid (cDNA) was synthesized from total RNA samples using the High Capacity cDNA Reverse Transcription Kit (Applied Biosystems) and then amplified using SYBR Green Universal PCR Master Mix Reagents (Applied Biosystems). Reaction mixtures with water only were prepared as negative controls, and each sample was prepared in triplicate. The expression level of each gene was normalized to actin as the difference between the threshold values (Ct) of the two genes. The 7500 Fast System SDS software (Applied Biosystems) was used for calculation.
The following primer sequences were used for PCR amplification:
Human ABCG2:
Forward: 5′-TTTCAGCCGTGGAACTCTTT-3′
Reverse: 5′-TGAGTCCTGGGCAGAAGTTT-3′
Human SLC22A2 (OCT2):
Forward: 5′-GGAATCTTGGCGTCCACATC-3′
Reverse: 5′-CCATCAGCGGGAGCTCAA-3′
Canine SLC22A2 (OCT2):
Forward: 5′-GTGGCTGCAGGTCACTGTTA-3′
Reverse: 5′-CAGGTCTGAGGCTCTGAAGG-3′
Human SLC22A4:
Forward: 5′-TTTGGGATCACCTCTGCTTTCT-3′
Reverse: 5′-TGTTGTAAGCACCGAGGTAAACA-3′
Canine SLC22A4:
Forward: 5′-TCGCCAACTTCTCGGCGCTC-3′
Reverse: 5′-GGGAGGAGGTGAGGGGCGTC-3′
fLuc Assay
Cell extracts were prepared using passive lysis buffer (Promega, Madison, WI) according to the manufacturer’s instructions, and the luciferase assay was performed using the Luciferase Assay System (Promega).
BLI of Cell Lines
Cells were plated at the indicated density. Immediately before imaging, D-luciferin was added to a final concentration of either 50 or 150 μg/mL. BLI signal was captured with the IVIS 200 small animal imaging system (Caliper Life Sciences, Hopkinton, MA). Acquisition times varied depending on signal intensity.
Data Analysis
LivingImage (Caliper Life Sciences) and IGOR (Wave-metrics, Lake Oswego, OR) image analysis software were used to analyze the BLI results. Signal intensities of regions of interest were defined manually. Light intensities of the regions of interest were expressed as total flux (photons per second). Data are presented as mean ± standard error of the mean (SE, n = 3), where indicated.
Results
HhAntag-691-Sensitive D-Luciferin Uptake Mechanism Affects fLuc BLI Signal Output
We previously reported that D-luciferin is a substrate of ABCG2 and that HhAntag-691, a hedgehog (Hh) pathway inhibitor,11 is a potent ABCG2 inhibitor.5,9 By blocking ABCG2-mediated efflux of D-luciferin, HhAntag-691 causes enhanced BLI output from cells that express both fLuc and ABCG2, including 22Rv1 prostate cancer cells.5 In 22Rv1 cells, HhAntag-691 was also found to cause a transient, dose-dependent signal decrease at early time points sampled rapidly after applying D-luciferin to cells (Figure 1A).
Figure 1.
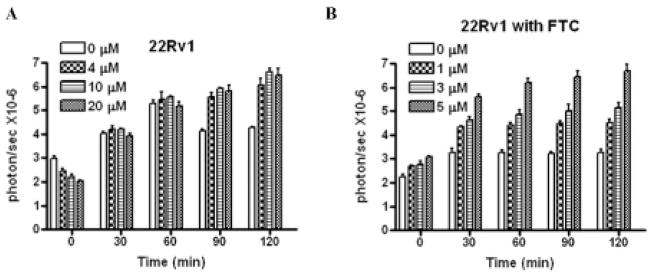
Time course of BLI signal in 22Rv1 cells treated with HhAntag-691 (A) or fumitremorgan C (FTC) (B). Cells were transiently transfected with a cytomegalovirus promoter–controlled trifusion reporter gene that produces fLuc, red fluorescent protein (RFP), and a mutated form of herpes simplex virus 1 thymidine kinase (sr39ttk), as previously described.4 HhAntag-691 or FTC was added at the indicated concentration, followed by D-luciferin, which was at a final concentration of 150 mg/mL. Imaging commenced immediately after adding D-luciferin. HhAntag-691 caused a transient, dose-dependent signal decrease before a dose-dependent signal increase became evident, whereas FTC caused enhanced BLI signal from the outset.
The decrease in BLI signal could not be explained by the effect of HhAntag-691 on ABCG2 activity because FTC,12 a specific ABCG2 inhibitor, caused only signal enhancement without the initial, transient signal decrease (Figure 1B). Given that HhAntag-691 does not interfere with the luciferase reaction per se,5 these results suggest that a membrane uptake mechanism exists that facilitates the entry of D-luciferin into cells and is inhibited by HhAntag-691.
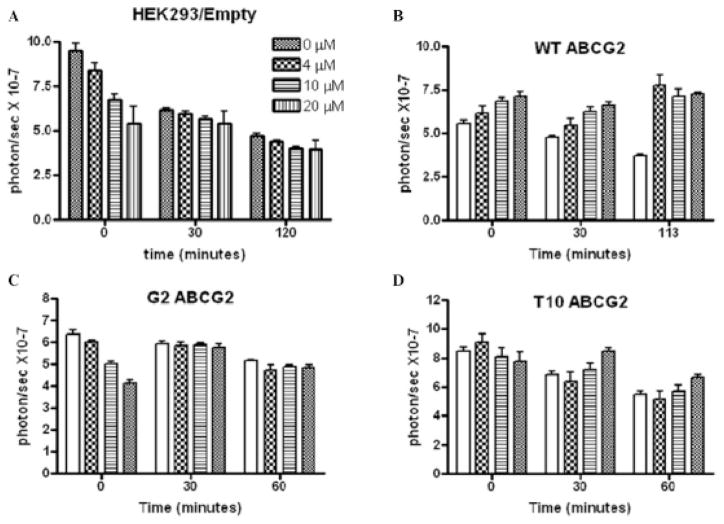
In HEK293 cells transfected with an empty vector, HhAntag-691 caused a dose-dependent BLI signal decrease that became less prominent over time (Figure 2A), consistent with partial inhibition of D-luciferin uptake at early time points and the gradual accumulation of D-luciferin within cells over time. HhAntag-691 did not enhance signal in HEK293 cells at later time points due to their lack of ABCG2 expression.13 That was confirmed by the presence of signal enhancement in response to HhAntag-691 in HEK293 cells engineered to express wild-type (wt) ABCG2 (Figure 2B). On the other hand, expressing either of two mutant forms of ABCG2, T10 (R482T) and G2 (R482G), each of which has altered substrate specificity and does not transport D-luciferin as effectively as wt ABCG2,5,13 failed to restore the signal enhancement by HhAntag-691 (Figure 2, C and D).
Figure 2.
Time course of BLI signal in HEK293 cells treated with HhAntag-691. Cells were transfected with (A) empty vector; (B) wild-type ABCG2; (C) G2 (R482G); or (D) T10 (R482T) mutant ABCG2. In HEK293/empty cells, a dose-dependent initial BLI signal decrease was observed and became less prominent over time (A). When wild-type ABCG2 was overexpressed, the transient signal decrease was abolished and signal was enhanced from the beginning of the imaging session (B). The overexpression of G2 mutant ABCG2 did not abolish the initial signal decrease (C). The overexpression of T10 mutant ABCG2 abolished the initial signal decrease but did not cause immediate signal enhancement. Cells were transiently transfected with the CMV-driven trifusion reporter, and BLI was performed identically as in Figure 1.
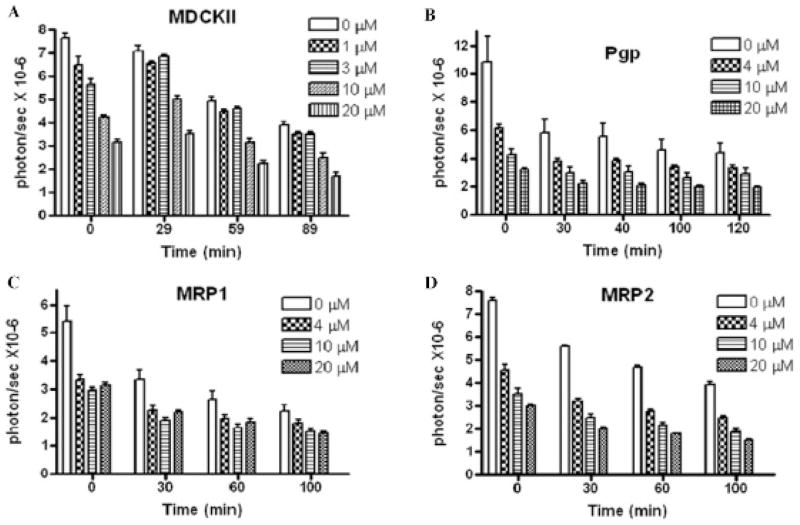
A more prominent dose-dependent signal decrease was observed in MDCK II cells, suggesting higher expression of the HhAntag-691-sensitive uptake mechanism than in the HEK293 cells (Figure 3A). Overexpressing ABCB1/P-glycoprotein, ABC transporter family member 1 (ABCC1)/multidrug resistance protein 1 (MRP1), or ABC transporter family member 2 (ABCC2)/multidrug resistance protein 2 (MRP2)14 had no effect on signal decrease induced by HhAntag-691 (Figure 3, B–D), consistent with a previous report stating that these ABC transporters do not transport D-luciferin.5
Figure 3.
Time course of BLI signal in HhAntag-691-treated MDCK II parent control cells (A) or MDCK II cells expressing ABCB1/Pgp (B), ABCC1/MRP1 (C), or ABCC2/MRP2 (D). In control cells, a dose-dependent initial BLI signal decrease was observed and lasted over time (A). The overexpression of ABCB1/Pgp (B), ABCC1/MRP1 (C), or ABCC2/MRP2 (D) did not affect the signal decrease. Cells were transiently transfected with the CMV-driven trifusion reporter, and BLI was performed identically as in Figure 1 and Figure 2.
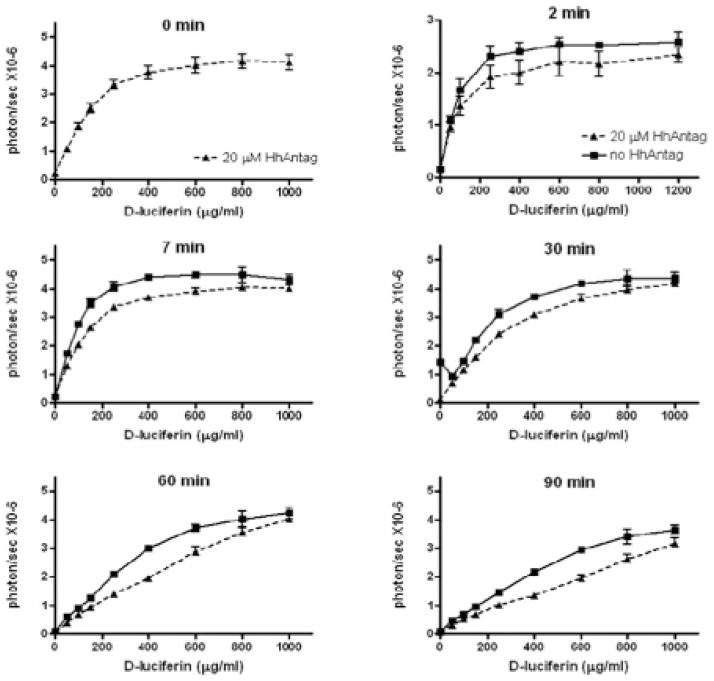
The inhibition of BLI signal output by HhAntag-691 was observed over a wide range of D-luciferin concentrations (up to 1,000 μg/mL) (Figure 4). MDCK II cells were imaged with increasing D-luciferin concentrations in the presence or absence of HhAntag-691, and the dose-dependent BLI signal was plotted with respect to the concentration of D-luciferin over time. Compared to the control, at each time point and every concentration of D-luciferin tested, HhAntag-691 decreased the BLI signal, consistent with what is expected when the uptake mechanism is inhibited, namely, lower signal.
Figure 4.
HhAntag-691 inhibits the initial high BLI signal produced by MDCK II cells over the time course of imaging. MDCK II/cytomegalovirus-driven trifusion reporter–expressing cells were imaged for 90 minutes in the presence or absence of HhAntag-691 with increasing concentrations of D-luciferin.
D-Luciferin-Based BLI Signal Dynamics Are Affected by the HhAntag-691-Sensitive Uptake Mechanism and the ABCG2 Efflux Transporter Combined
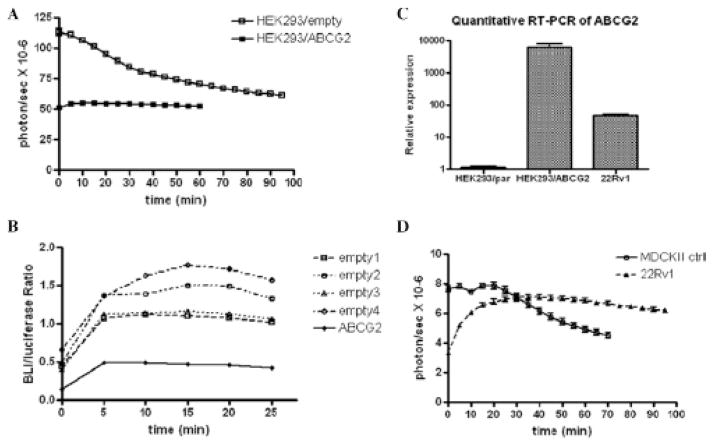
We analyzed the BLI signal dynamics of several cell lines to understand whether and how ABCG2 efflux and HhAntag-691-sensitive uptake mechanisms together affect BLI signal output. The dynamic BLI profiles of HEK293 cells, with or without ABCG2 overexpression, were compared (Figure 5A). In control HEK293 cells, there is an initial high signal output, followed by a gradual decrease over time, similar to that shown in Figure 2A. In HEK293 cells overexpressing ABCG2, signal was lower but more stable over the entire imaging period of 60 minutes when compared to control HEK293 cells. That ABCG2 overexpression reduces BLI signal output was confirmed by plotting the ratio of BLI signal in cellulo over that produced by cell lysates to normalize for the levels of fLuc expression within these different cell lines. We did that normalization because the in vitro fLuc assay was performed with an excess amount of D-luciferin and the signal output is directly proportional to fLuc expression (Figure 5B). For this analysis, both ABCG2-overexpressing HEK293 cells and the control HEK293 cells were stably transfected with the fLuc reporter and subjected to BLI followed by cell lysate extraction and luciferase assay. ABCG2 overexpression decreased the BLI signal in intact cells, as indicated by the ratio of (BLI output in intact cells)/(BLI output from lysate), compared to the control (see Figure 5B). We formulated the following hypothesis: (1) in the absence of ABCG2 expression, the uptake mechanism facilitates inward transport of D-luciferin and causes an initial high signal; (2) when ABCG2 is expressed, the initial high signal is inhibited due to the more active efflux of D-luciferin, providing a lower overall signal and more stable dynamics, that is, no continuous increase or decrease in signal over time; and (3) the integrated dynamics of BLI depend on the relative levels of expression of the uptake mechanism and ABCG2 (as illustrated in Figure 6). Initially, with little intracellular D-luciferin, the uptake process dominates, and the inhibition of this uptake causes a decrease in BLI signal. Later, after intracellular accumulation of D-luciferin, efflux begins to overwhelm the uptake process, and the net result is increased signal output.
Figure 5.
BLI signal dynamics in different cell lines are affected by the level of ABCG2 expression. A, BLI signal from HEK293/empty cells started from a higher level, while decreasing smoothly over time, than did signal from ABCG2-overexpressing HEK293 cells, which remained constant in BLI signal output. B, The BLI/luciferase assay (in vitro) signal output ratio in ABCG2-overexpressing HEK293 cells was significantly lower than that produced by four different HEK293/empty colonies, confirming that the lower BLI signal from the HEK293/ABCG2 cells was caused by the relatively lower availability of intracellular D-luciferin in this cell line. C, Quantitative RT-PCR indicated that ABCG2 is expressed at very low levels in the HEK293/empty cells but is elevated in HEK293/ABCG2 cells, while being intermediate in expression in the 22Rv1 cell line. D, The BLI signal dynamics of 22Rv1 cells is relatively stable, consistent with its moderate expression of ABCG2. MDCK II cells demonstrated an initial high BLI signal, followed by a continuously decreasing signal, consistent with a high level of expression of the HhAntag-691-sensitive uptake pump and little expression of ABCG2.
Figure 6.
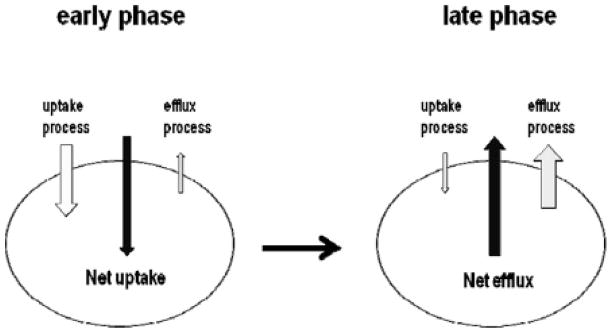
Schematic diagram of proposed transporter involvement in D-luciferin transport across the cell membrane and the effect on BLI signal output. Soon after (early phase) D-luciferin administration and imaging, there is little intracellular D-luciferin, such that the uptake process dominates the overall signal, and inhibiting that uptake, such as with HhAntag-691, decreases the signal. By later time points (late phase), there has been sufficient time for D-luciferin to accumulate within cells, such that efflux (ABCG2) dominates and inhibition of ABCG2 enhances signal.
We tested this hypothesis in two other cell lines, 22Rv1 and MDCK II (see Figure 2 and Figure 3). Both of those cell lines express the HhAntag-691-sensitive uptake mechanism, but their ABCG2 expression levels differ dramatically. Consistent with the imaging dynamics when treated with HhAntag-691 (see Figure 3), MDCK II cells express a high level of the HhAntag-691-sensitive uptake mechanism, with 22Rv1 cells expressing at a relative lower level. MDCK II cells have previously been shown not to express ABCG2,15 but 22Rv1 cells express high levels of ABCG2, as revealed by quantitative RT-PCR (Figure 5C). Our hypothesis predicts that differences in BLI dynamics will depend on ABCG2 expression levels. It also predicts that MDCK II cells generate an initial high signal followed by decreasing signal, whereas 22Rv1 cells generate an initial low signal that remains essentially constant over time, as shown in Figure 5D. BLI signal output in 22Rv1 cells reached equilibrium at a higher level than in HEK293/ABCG2 cells, likely because the level of ABCG2 expression in 22Rv1 cells is not as high as that in HEK293/ABCG2 cells (see Figure 5C). In these different cell lines, the level of fLuc expression may be different and will affect the absolute BLI signal output. However, our main object is to understand the pattern of change of the signal output over time rather than compare the absolute level of signal from each cell line.
SLC22A4 Expression Correlates with the D-Luciferin Uptake Mechanism
SLC22A4 is a member of the organic cation/zwitterion uptake transporter family and has been identified as a drug transporter that confers enhanced sensitivity to chemotherapeutic agents, including doxorubicin and mitoxantrone.16 We hypothesized that D-luciferin is a substrate of SLC22A4 because SLC22A4 and ABCG2 share mitoxantrone as a substrate, and D-luciferin is a substrate of ABCG2. In addition, an uptake mechanism in MDCK II cells has been reported that affects mitoxantrone transport across the cell membrane,17 and quantitative RT-PCR reveals very high expression of SLC22A4 in MDCK II cells (Figure 7). SLC22A4 expression was also detected in 22Rv1 and HEK293 cells, the other cells lines in which the HhAntag-691-sensitive D-luciferin uptake mechanism was identified (see Figure 7). Therefore, SLC22A4 may be the uptake pump that facilitates D-luciferin uptake.
Figure 7.
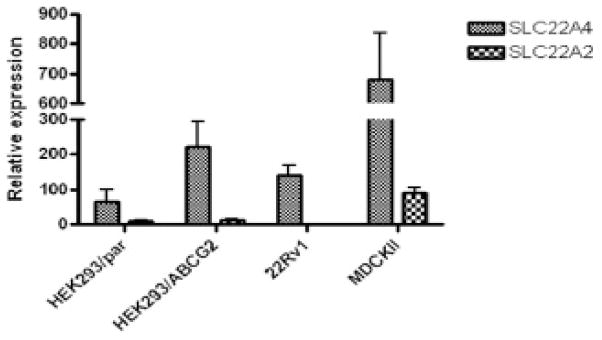
The expression levels of the SLC22A4 and SLC22A2 uptake pumps in different cell lines revealed by quantitative RT-PCR. RNA was extracted from HEK293 parent cells (HEK293/par) or from cells stably transfected with an ABCG2-expressing plasmid (HEK293/ABCG2).4 22Rv1 cells and MDCK II cells were similarly treated.
SLC22A2 (OCT2) is another organic cation uptake pump that has been reported to have high expression in MDCK II cells,18 and we examined its expression in other cell lines to see whether its message was also present, suggesting that it, too, could facilitate D-luciferin uptake. Although quantitative RT-PCR reveals an intermediate level of expression of SLC22A2 in MDCK II cells, its expression in HEK293 cells was very low, and no expression in 22Rv1 cells was detected (see Figure 7). Accordingly, SLC22A2 is not likely to contribute to D-luciferin uptake in these cells.
Discussion
fLuc-based BLI has been used widely in vivo to report on the activity of various anticancer therapies and other treatments. It is well known that both regional availability of D-luciferin and the imaging time postinjection affect the sensitivity and reproducibility of imaging signal.1,4,6,8 Yet it is unknown what factors account for that regional availability. In this study, we showed that a HhAntag-691-sensitive D-luciferin uptake mechanism exists in multiple cell lines and has an impact on BLI. In an earlier report, we found that HhAntag-691 was an inhibitor of the ABCG2 transporter, which mediates D-luciferin efflux.9,11 We now show that these two D-luciferin transport systems, mediating uptake and efflux, together affect the dynamics of overall BLI signal output. We analyzed how these uptake and efflux mechanisms concurrently affect the BLI dynamics of different cell lines and found that the uptake mechanism contributes to an initial high BLI signal, whereas ABCG2 expression (efflux) causes reduced and relatively stable signal output. The net BLI signal was found to result from a balance between the activity of uptake and efflux (ABCG2) pumps, where ABCG2 activity dominates at later time points during the imaging session. Because HhAntag-691 proved capable of inhibiting D-luciferin influx, which was best noted at early time points, we refer to the uptake pump affected as the HhAntag-691-sensitive uptake mechanism. Experimental evidence and existing literature support a role for SLC22A4 in facilitating the uptake of D-luciferin into cells. More than 360 SLC uptake pump family members exist, suggesting that pumps other than SLC22A4 may also contribute to D-luciferin uptake as many demonstrate similar substrate specificity.16,19
Sim and colleagues used pharmacokinetic modeling to evaluate quantitatively the rate of D-luciferin transport in and out of tumors in vivo and discovered that efflux eventually becomes the determining factor in D-luciferin distribution.20 Our current findings are consistent with their results and offer an underlying molecular mechanism to explain cellular uptake kinetics and in vivo biodistribution of D-luciferin. These findings will be useful for optimizing imaging protocols that use D-luciferin and should facilitate the development of more precise and quantitative BLI.
Acknowledgments
We thank Joseph Bressler for providing cells expressing mutant ABCG2.
Footnotes
Financial disclosure of reviewers: None reported.
Financial disclosure of authors: This study was supported by National Institutes of Health grants CA92871 and NS43987 and the Maryland Stem Cell Foundation.
References
- 1.Rettig GR, McAnuff M, Liu D, et al. Quantitative bioluminescence imaging of transgene expression in vivo. Anal Biochem. 2006;355:90–4. doi: 10.1016/j.ab.2006.04.026. [DOI] [PubMed] [Google Scholar]
- 2.Gross S, Piwnica-Worms D. Molecular imaging strategies for drug discovery and development. Curr Opin Chem Biol. 2006;10:334–42. doi: 10.1016/j.cbpa.2006.06.028. [DOI] [PubMed] [Google Scholar]
- 3.de Wet JR, Wood KV, DeLuca M, et al. Firefly luciferase gene: structure and expression in mammalian cells. Mol Cell Biol. 1987;7:725–37. doi: 10.1128/mcb.7.2.725. [DOI] [PMC free article] [PubMed] [Google Scholar]
- 4.Lee KH, Byun SS, Paik JY, et al. Cell uptake and tissue distribution of radioiodine labelled D-luciferin: implications for luciferase based gene imaging. Nucl Med Commun. 2003;24:1003–9. doi: 10.1097/00006231-200309000-00009. [DOI] [PubMed] [Google Scholar]
- 5.Zhang Y, Bressler JP, Neal J, et al. ABCG2/BCRP expression modulates D-luciferin based bioluminescence imaging. Cancer Res. 2007;67:9389–97. doi: 10.1158/0008-5472.CAN-07-0944. [DOI] [PubMed] [Google Scholar]
- 6.Burgos JS, Rosol M, Moats RA, et al. Time course of bioluminescent signal in orthotopic and heterotopic brain tumors in nude mice. Biotechniques. 2003;34:1184–8. doi: 10.2144/03346st01. [DOI] [PubMed] [Google Scholar]
- 7.Moriyama EH, Niedre MJ, Jarvi MT, et al. The influence of hypoxia on bioluminescence in luciferase-transfected gliosarcoma tumor cells in vitro. Photochem Photobiol Sci. 2008;7:675–80. doi: 10.1039/b719231b. [DOI] [PubMed] [Google Scholar]
- 8.Berger F, Paulmurugan R, Bhaumik S, et al. Uptake kinetics and biodistribution of 14C-D-luciferin—a radiolabeled substrate for the firefly luciferase catalyzed bioluminescence reaction: impact on bioluminescence based reporter gene imaging. Eur J Nucl Med Mol Imaging. 2008;35:2275–85. doi: 10.1007/s00259-008-0870-6. [DOI] [PMC free article] [PubMed] [Google Scholar]
- 9.Zhang Y, Laterra J, Pomper MG. Hedgehog pathway inhibitor HhAntag691 is a potent inhibitor of ABCG2/BCRP and ABCB1/Pgp. Neoplasia. 2009;11:96–101. doi: 10.1593/neo.81264. [DOI] [PMC free article] [PubMed] [Google Scholar]
- 10.Zhang Y, Byun Y, Ren Y, et al. Identification of inhibitors of ABCG2 by a bioluminescence imaging-based high-throughput assay. Cancer Res. 2009;69:5867–75. doi: 10.1158/0008-5472.CAN-08-4866. [DOI] [PMC free article] [PubMed] [Google Scholar]
- 11.Romer JT, Kimura H, Magdaleno S, et al. Suppression of the Shh pathway using a small molecule inhibitor eliminates medulloblastoma in Ptc1(+/−)p53(−/−) mice. Cancer Cell. 2004;6:229–40. doi: 10.1016/j.ccr.2004.08.019. [DOI] [PubMed] [Google Scholar]
- 12.Rabindran SK, Ross DD, Doyle LA, et al. Fumitremorgin C reverses multidrug resistance in cells transfected with the breast cancer resistance protein. Cancer Res. 2000;60:47–50. [PubMed] [Google Scholar]
- 13.Robey RW, Honjo Y, Morisaki K, et al. Mutations at amino-acid 482 in the ABCG2 gene affect substrate and antagonist specificity. Br J Cancer. 2003;89:1971–8. doi: 10.1038/sj.bjc.6601370. [DOI] [PMC free article] [PubMed] [Google Scholar]
- 14.Evers R, Kool M, Smith AJ, et al. Inhibitory effect of the reversal agents V-104, GF120918 and pluronic L61 on MDR1 Pgp-, MRP1-and MRP2-mediated transport. Br J Cancer. 2000;83:366–74. doi: 10.1054/bjoc.2000.1260. [DOI] [PMC free article] [PubMed] [Google Scholar]
- 15.Mohrmann K, van Eijndhoven MAJ, Schinkel AH, et al. Absence of N-linked glycosylation does not affect plasma membrane localization of breast cancer resistance protein (BCRP/ABCG2) Cancer Chemother Pharmacol. 2005;56:344–50. doi: 10.1007/s00280-005-1004-5. [DOI] [PubMed] [Google Scholar]
- 16.Okabe M, Szakacs G, Reimers MA, et al. Profiling SLCO and SLC22 genes in the NCI-60 cancer cell lines to identify drug uptake transporters. Mol Cancer Ther. 2008;7:3081–91. doi: 10.1158/1535-7163.MCT-08-0539. [DOI] [PMC free article] [PubMed] [Google Scholar]
- 17.Pan G, Elmquist WF. Mitoxantrone permeability in MDCKII cells is influenced by active influx transport. Mol Pharm. 2007;4:475–83. doi: 10.1021/mp060083b. [DOI] [PubMed] [Google Scholar]
- 18.Pan G, Winter TN, Roberts JC, et al. Organic cation uptake is enhanced in bcrp1-transfected MDCKII cells. Mol Pharm. 2010;7:138–45. doi: 10.1021/mp900177r. [DOI] [PMC free article] [PubMed] [Google Scholar]
- 19.Hediger MA, Romero MF, Peng JB, et al. The ABCs of solute carriers: physiological, pathological and therapeutic implications of human membrane transport proteins: Introduction. Pflugers Arch. 2004;447:465–8. doi: 10.1007/s00424-003-1192-y. [DOI] [PubMed] [Google Scholar]
- 20.Sim H, Bibee K, Wickline S, et al. Pharmacokinetic modeling of tumor bioluminescence implicates efflux, and not influx, as the bigger hurdle in cancer drug therapy. Cancer Res. 2011;71:686–92. doi: 10.1158/0008-5472.CAN-10-2666. [DOI] [PMC free article] [PubMed] [Google Scholar]


