Abstract
We present a novel process to encapsulate Indocyanine Green (ICG) in liposomal droplets at high concentration for potential applications in image-guided drug delivery. The microencapsulation process follows two consecutive steps of droplet formation by liquid-driving coaxial flow focusing (LDCFF) and solvent removal by oil phase dewetting. These biocompatible lipid vesicles may have important applications in drug delivery and fluorescence imaging.
Indocyanine green (ICG) is a water-soluble tricarbocyanine dye approved by the Food and Drug Administration (FDA) for many biomedical applications.1,2 However, its broader clinical use is limited by concentration-dependent aggregation, aqueous instability, and rapid degradation.3,4 Especially, the absorption and fluorescence spectra of ICG vary significantly with its concentration and molecular environment, making it difficult for quantitative image analysis. To overcome this limitation, ICG has been encapsulated in various biodegradable carriers, such as polymer micro and nanoparticles, micelles, and liposomes, for the enhanced stability.5–10 However, the commonly used hydration process yields ICG-loaded vesicles with broad size distribution and low encapsulation rate.11,12 They do not offer sufficient sensitivity and accuracy for image-guided drug delivery. The emerging microfluidic methods are able to achieve uniform particle size, controlled chemical compositions, and high encapsulation efficiency.13–16 To create the lipid-stabilized W/O/W template, commonly used methods include glass microcapillaries and PDMS microchannels.17–22 The process produces monodisperse bilayer liposomes by consecutive steps of creating a lipid-stabilized template of water in oil in water (W/O/W) double emulsion followed by oil phase dewetting during solvent evaporation.22–27 After evaporation of the oil phase, the lipid monolayers at the internal and the external oil–water interfaces come together into a bilayer, thereby forming a liposomal membrane. The process of dewetting of the oil phase and formation of a lipid bilayer takes only a couple of minutes.24,25 In this Letter, we report a novel liquid-driving coaxial flow focusing (LDCFF) process to form lipid-stabilized W/O/W template with high ICG concentration. Compared with other methods, the LDCFF process is able to produce monodisperse drug-loaded microdroplets at low cost, high encapsulation rate, and high productivity. To the best of the authors’ knowledge, we are the first to introduce the LDCFF process for microencapsulation of highly concentrated water-soluble reagents that are otherwise difficult to encapsulate at a high loading rate. We are also the first to utilize ICG-loaded liposomes for quantitative fluorescence imaging and image-guided drug delivery.
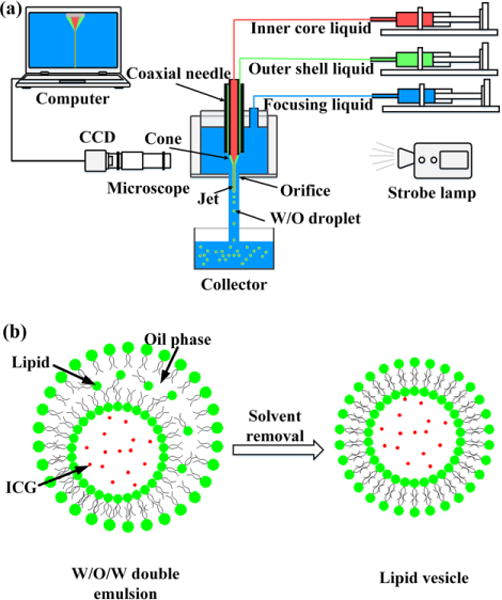
The experimental setup for the LDCFF process includes three injection pumps, a stainless steel coaxial needle, a pressure chamber, and a monitor, as sketched in Fig. 1(a). Lipid vesicles are obtained from the double emulsions by removing the solvent from the hydrophobic layer of W/O/W double emulsions, as shown in Fig. 1(b). The coaxial needle is fabricated by laser welding six silver wires (diameter: 0.15 mm) uniformly distributed on the outside surface of an inner needle (inner diameter: 0.41 mm, outer diameter: 0.71 mm) and then inserting the inner needle into an outer needle (inner diameter: 1.01 mm, outer diameter: 1.48 mm). The positions of the inner and outer needles are adjusted for high concentricity. In this work, the tip of the inner needle is 0.2 mm longer than that of the outer needle. The pressure chamber is made of a PMMA tube, with an inner diameter of 19 mm, an outer diameter of 25 mm, and a length of 18 mm. The coaxial needle assembly is held by a rubber plug and inserted into the top opening of the pressure chamber, with the bottom of the chamber sealed by a thin glass slide. An orifice of 0.3 mm in diameter is machined at the center of the glass slide and the distance from the inner needle tip to the orifice is adjusted to be 1 mm. The LDCFF device is simple so that there is no strict requirement for the size of the chamber as long as it provides an approximately uniform velocity environment for the inner and the outer liquid jets. Three NE-1000 syringe pumps (New Era Pump Systems, Wantagh, NY) are used to provide continuous flow of the inner phase (Qi), the outer phase (Qo) and the focusing phase (Qf), respectively. As Qf reaches the threshold, the inner and the outer fluids are shaped into a coaxial cone between the needle and the orifice. The coaxial liquid jet eventually breaks up into droplets because of flow instability.28,29 The process is continuously monitored by a CCD camera (Allied vision technologies) equipped with a microscopic lens. The illumination is provided by a strobe flashlight (flashing frequency: 3.2 KHz) from the other side of the chamber. The inner phase of the liposomal ICG droplets is 13 mM ICG (Pfaltz & Bauer, Flushing, NY) dissolved in 2–5 wt% poly(vinyl alcohol) (PVA; Mw: 13000–23000 g/mol, 87–89% hydrolyzed, Sigma-Aldrich, St. Louis, MO). The middle organic phase consists of 15 mg/ml lecithin (Thermo Fisher Scientific, Waltham, MA) in an organic solvent mixture of hexane (Mallinckrodt, Hazelwood, MO) and chloroform (Mallinckrodt, Hazelwood, MO) at a volume ratio of 6.4:3.6. The outer aqueous phase is 2–5 wt% PVA solution. Ultrapure deionized water is generated by a Nanopure Infinity water purification system (Barnstead International, Dubuque, IA). All experiments are performed at room temperature.
Fig. 1.

(a) Schematic illustration of the LDCFF experimental setup; (b) ICG is encapsulated in lipid vesicle as the solvent is removed from the outer layer of double emulsions.
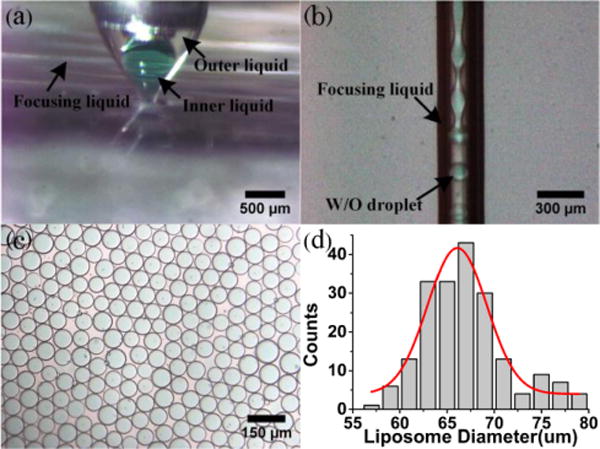
The morphology and the size distribution of the liposomal ICG droplets are closely related to the stability of the cone-jet configurations that are determined by the geometric structures of the device, the physical parameters and the flow rates of the fluids.15,28,29 Stable cone-jet configurations can be obtained and finely controlled by adjusting the flow rates of the inner, outer and focusing phases. An axisymmetric breakup of coaxial inner and outer liquid jets is advantageous for producing monodisperse liposomal ICG droplets. Fig. 2(a) shows the experimental image of a stable cone with two visible menisci. The interface between the inner and the outer flows can be clearly identified as well as that between the outer and the focusing phases. The focused inner and outer fluid streams break up at the orifice exit of the pressure chamber to form monodisperse droplets, as shown in Fig. 2(b). Fig. 2(c) indicates that the collected droplets have uniform size and morphologic characteristics, making them an ideal template for producing uniform lipid vesicles after the solvent removal step. The produced droplets have a mean diameter of 67.3 μm with a standard deviation of 5.03 μm, as plotted in Fig. 2(d).
Fig. 2.

(a) Example of a stable cone: Qf =800ml/h, Qo =10ml/h, Qi =10ml/h; (b) Example of a stable jet: Qf =1500ml/h, Qo =25ml/h, Qi=25ml/h; (c) Example of ICG liposomes: Qf =1200ml/h, Qo =10ml/h, Qi=10ml/h; (d) Size distribution of ICG liposomes in (c).
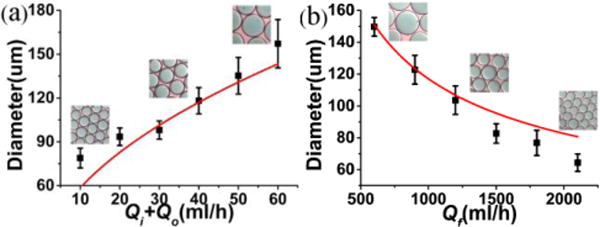
The overall size and the shell thickness of the droplets can be adjusted by changing the flow rates of three phases. In our experiments, the flow rates of the innermost aqueous phase and the outer oil phase are maintained the same in order to ensure synchronous movement of disturbances deposited on liquid interfaces. Under this condition, the innermost aqueous phase forms a large water-in-oil emulsion to facilitate bilayer liposome formation.19,24 Fig. 3 shows the effect of the inner, outer and focusing phase flow rates on the diameter of the formed droplets. As the inner and outer flow rates decrease or the focusing phase flow rate increases, the droplet diameter decreases dramatically. In previous studies of single axial flow focusing,15,28–30 it is found that the droplet size is related to the focused liquid flow rate Q as a function of Q1/2. Similarly, in the LDCFF process after some straightforward calculations, a scaling law can be written as
| (1) |
where α stands for a constant, D, Dorif for the diameters of droplet and orifice, Qi, Qo, Qf for the flow rates of inner, outer and focusing fluids, respectively. In the axisymmetric breakup of inner and outer flows, the value of α is mainly dependent on the process parameters such as the liquid properties and the liquid flow rates. The good agreement between experimental and theoretical results in Fig. 3 can be obtained for a given α= 1.9. Therefore, the LDCFF process can be well controlled and the droplets with smaller size can be produced by increasing the focusing liquid flow rate or decreasing the inner and the outer flow rates. The typical droplet generation frequency in this work is in the range of 104 to 105 Hz, much higher than many conventional processes,18–22 indicating the great potential for scale-up production.
Fig. 3.

(a) Droplet diameter D as a function of Qi+Qo for Qf= 1000 ml/h and Qi= Qo ; (b) Droplet diameter D as a function of Qf for Qi= Qo = 20 ml/h.
To study the optical characteristics of ICG and ICG liposomes, the following samples are prepared in 4.3 ml square cuvettes: (i) ICG in 2 wt% PVA solution, (ii) ICG in bovine plasma (Herman Falter Packing Co., Columbus, OH), (iii) ICG liposomes in 2 wt% PVA solution, and (iv) ICG liposomes in bovine plasma. The samples are excited by a laser diode light source at 690 nm (QualSys, Fremont, CA). The fluorescence emission of each sample is characterized by an USB4000-FL fluorescence spectrometer (Ocean Optics, Dunedin, FL) cooperated with a FGL785 long wave pass filter (Thorlabs, Newton, NJ). An ORCA-ER C4742–80 high resolution digital B/W CCD camera (Hamamatsu, Bridgewater, NJ) is used to capture the fluorescence images of the samples. To demonstrate the technical feasibility of using ICG liposomes for drug release detection, we measure the florescence spectrum of ICG liposomes before and after adding a small volume of ethanol (2 vol%), in comparison with that of free ICG in 2 wt% PVA solution. Adding ethanol dissolves the liposome membrane and simulates the drug release process. Before ethanol is added, the ICG concentration within the liposomes is as high as 1.3 mM. After adding ethanol, ICG is released and its concentration is diluted to lower than 10 μM.
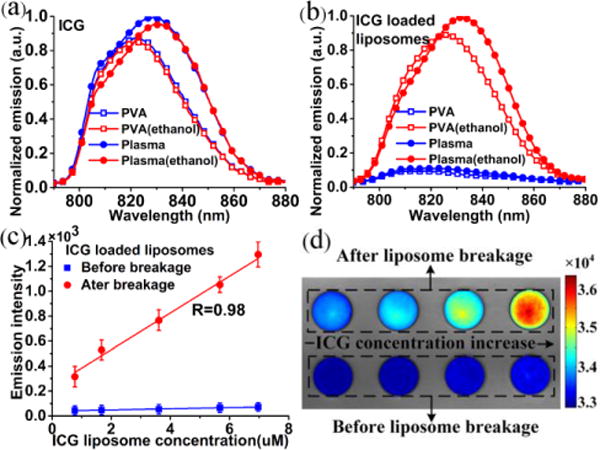
According to Fig. 4(a), the addition of ethanol induces little changes in fluorescence emission spectra for either PVA or plasma solution of ICG. In comparison, addition of ethanol in ICG liposomes significantly changes their fluorescence spectra. According to Fig. 4(b), the fluorescence intensities of ICG liposomes are low in either PVA solution or plasma, partially owing to the aggregation of high concentration ICG in liposomes. After ethanol is added, the liposomal membrane is broken. ICG is released and diluted to a much lower concentration level where fluorescence emission is significantly enhanced. We hypothesize that the fluorescence enhancement of ICG will provide quantitative measurement of the drug release process. To verify this hypothesis, we measure fluorescence emission before and after the addition of ethanol for ICG liposomes at different concentration levels and plot the results in Fig. 4(c). According to the figure, the ethanol-induced fluorescence intensity change is linearly correlated with the concentration of ICG liposomes, with a correlation coefficient R of 0.98 and sensitivity better than 0.7 μM. This experiment shows that ICG liposomes may be used for drug release detection. Fluorescent images of ICG liposomes in plasma at different concentrations are also acquired before and after the addition of ethanol, as shown in Fig. 4(d). The fluorescence imaging results are consistent with the spectral measurements, indicating the technical feasibility for drug release detection by quantitative fluorescence imaging.
Fig. 4.

(a) Normalized fluorescence spectra for 6 μM ICG in 2 wt% PVA solution and in plasma with and without ethanol; (b) Normalized fluorescence spectra for 6 μM ICG liposomes in 2 wt% PVA solution and in plasma with and without ethanol; (c) Peak fluorescence intensities at different concentration levels for ICG liposomes in plasma before and after the addition of 2 vol% ethanol; (d) Fluorescent images of ICG liposomes in plasma at different concentration levels before and after the addition of 2 vol% ethanol. The color bar is the intensity values acquired by the CCD camera.
Conclusions
In conclusion, we propose a novel LDCFF method to encapsulate highly concentrated ICG in monodisperse bilayer liposomes for potential application in quantitative fluorescence imaging and image-guided drug delivery. The influence of the fluid rates on the size of the produced droplets is studied for the improved process control. The utility of the ICG liposomes is tested in the simulated drug release experiments where ethanol is added in the PVA or plasma suspension of ICG liposomes to dissolve the liposomal membrane and release ICG. Fluorescence emission is enhanced significantly after the liposomal membrane is dissolved and the increase of fluorescence emission is linearly correlated with the concentration of ICG liposomes. Considering that ICG is a FDA approved fluorescence agent, the produced ICG liposomes can be used as a biocompatible sensor for quantitative clinical imaging and image-guided drug delivery. The proposed LDCFF process can be extended to encapsulate water-soluble drugs, proteins, and other therapies at high concentration for topical drug delivery applications, such as image-guided intraperitoneal chemotherapy in ovarian cancer,31 intravitreous anti-VEGF therapy for age-related macular degeneration,32 and topical treatment of chronic wounds.33
Supplementary Material
Acknowledgments
This work is supported by National Institute of Health (R21CA15977), the National Natural Science Foundation of China (81327803, 11472270), and The Fundamental Research Funds for the Central Universities.
Footnotes
Electronic supplementary information (ESI) available: ESI (S1): The mathematical formulation for the scaling law in Equation (1); ESI (S2): Discussion of the fitting curves predicted by the scaling law in comparison with experimental observations.
Contributor Information
Ting Si, Email: tsi@ustc.edu.cn.
Ronald X. Xu, Email: xu.ronald@hotmail.com.
Notes and references
- 1.Alander JT, Kaartinen I, Laakso A, Pätilä T, Spillmann T, Tuchin VV, Venermo M, Välisuo P. J Biomed Imaging. 2012;2012:7:7–7:7. doi: 10.1155/2012/940585. [DOI] [PMC free article] [PubMed] [Google Scholar]
- 2.Grosenick D, Wabnitz H, Ebert B. J Infrared Spectrosc. 2012;20:203–221. [Google Scholar]
- 3.Desmettre T, Devoisselle JM, Mordon S. Surv Ophthalmol. 2000;45:15–27. doi: 10.1016/s0039-6257(00)00123-5. [DOI] [PubMed] [Google Scholar]
- 4.Engel E, Schraml R, Maisch T, Kobuch K, König B, Szeimies RM, Hillenkamp J, Bäumler W, Vasold R. Invest Ophthalmol Vis Sci. 2008;49:1777–1783. doi: 10.1167/iovs.07-0911. [DOI] [PubMed] [Google Scholar]
- 5.Saxena V, Sadoqi M, Shao J. J Photochem Photobiol B. 2004;74:29–38. doi: 10.1016/j.jphotobiol.2004.01.002. [DOI] [PubMed] [Google Scholar]
- 6.Rodriguez VB, Henry SM, Hoffman AS, Stayton PS, Li X, Pun SH. J Biomed Opt. 2008;13:014025–014025–10. doi: 10.1117/1.2834296. [DOI] [PubMed] [Google Scholar]
- 7.Xu RX, Huang J, Xu JS, Sun D, Hinkle GH, Martin EW, Povoski SP. J Biomed Opt. 2009;14:034020–034020–6. doi: 10.1117/1.3147424. [DOI] [PubMed] [Google Scholar]
- 8.Rajian JR, Fabiilli ML, Fowlkes JB, Carson PL, Wang X. Opt Express. 2011;19:14335–14347. doi: 10.1364/OE.19.014335. [DOI] [PMC free article] [PubMed] [Google Scholar]
- 9.Mitra K, Melvin J, Chang S, Park K, Yilmaz A, Melvin S, Xu RX. J Biomed Opt. 2012;17:116025–116025. doi: 10.1117/1.JBO.17.11.116025. [DOI] [PMC free article] [PubMed] [Google Scholar]
- 10.Shemesh CS, Hardy CW, Yu DS, Fernandez B, Zhang H. Photodiagnosis Photodyn Ther. 2014;11:193–203. doi: 10.1016/j.pdpdt.2014.02.001. [DOI] [PubMed] [Google Scholar]
- 11.Turner DC, Moshkelani D, Shemesh CS, Luc D, Zhang H. Pharm Res. 2012;29:2092–2103. doi: 10.1007/s11095-012-0738-0. [DOI] [PubMed] [Google Scholar]
- 12.Zheng M, Zhao P, Luo Z, Gong P, Zheng C, Zhang P, Yue C, Gao D, Ma Y, Cai L. ACS Appl Mater Interfaces. 2014;6:6709–6716. doi: 10.1021/am5004393. [DOI] [PubMed] [Google Scholar]
- 13.Capretto L, Carugo D, Mazzitelli S, Nastruzzi C, Zhang X. Adv Drug Deliv Rev. 2013;65:1496–1532. doi: 10.1016/j.addr.2013.08.002. [DOI] [PubMed] [Google Scholar]
- 14.van Swaay D, deMello A. Lab Chip. 2013;13:752. doi: 10.1039/c2lc41121k. [DOI] [PubMed] [Google Scholar]
- 15.Gañán-Calvo AM, Montanero JM, Martín-Banderas L, Flores-Mosquera M. Adv Drug Deliv Rev. 2013;65:1447–1469. doi: 10.1016/j.addr.2013.08.003. [DOI] [PubMed] [Google Scholar]
- 16.Patil YP, Jadhav S. Chem Phys Lipids. 2014;177:8–18. doi: 10.1016/j.chemphyslip.2013.10.011. [DOI] [PubMed] [Google Scholar]
- 17.Vladisavljević GT, Khalid N, Neves MA, Kuroiwa T, Nakajima M, Uemura K, Ichikawa S, Kobayashi I. Adv Drug Deliv Rev. 2013;65:1626–1663. doi: 10.1016/j.addr.2013.07.017. [DOI] [PubMed] [Google Scholar]
- 18.Tan YC, Hettiarachchi K, Siu M, Pan YR, Lee AP. J Am Chem Soc. 2006;128:5656–5658. doi: 10.1021/ja056641h. [DOI] [PubMed] [Google Scholar]
- 19.Kong F, Zhang X, Hai M. Langmuir. 2014;30:3905–3912. doi: 10.1021/la404201m. [DOI] [PubMed] [Google Scholar]
- 20.Bardin D, Martz TD, Sheeran PS, Shih R, Dayton PA, Lee AP. Lab Chip. 2011;11:3990. doi: 10.1039/c1lc20615j. [DOI] [PMC free article] [PubMed] [Google Scholar]
- 21.Bardin D, Kendall MR, Dayton PA, Lee AP. Biomicrofluidics. 2013;7:034112. doi: 10.1063/1.4811276. [DOI] [PMC free article] [PubMed] [Google Scholar]
- 22.Teh SY, Khnouf R, Fan H, Lee AP. Biomicrofluidics. 2011;5:044113. doi: 10.1063/1.3665221. [DOI] [PMC free article] [PubMed] [Google Scholar]
- 23.Davies RT, Kim D, Park J. J Micromechanics Microengineering. 2012;22:055003. doi: 10.1088/0960-1317/22/5/055019. [DOI] [PMC free article] [PubMed] [Google Scholar]
- 24.Arriaga LR, Datta SS, Kim SH, Amstad E, Kodger TE, Monroy F, Weitz DA. Small. 2014;10:950–956. doi: 10.1002/smll.201301904. [DOI] [PubMed] [Google Scholar]
- 25.Herranz-Blanco B, Arriaga LR, Mäkilä E, Correia A, Shrestha N, Mirza S, Weitz DA, Salonen J, Hirvonen J, Santos HA. Lab Chip. 2014;14:1083. doi: 10.1039/c3lc51260f. [DOI] [PMC free article] [PubMed] [Google Scholar]
- 26.Seth A, Béalle G, Santanach-Carreras E, Abou-Hassan A, Ménager C. Adv Mater. 2012;24:3544–3548. doi: 10.1002/adma.201200757. [DOI] [PubMed] [Google Scholar]
- 27.Shum HC, Lee D, Yoon I, Kodger T, Weitz DA. Langmuir. 2008;24:7651–7653. doi: 10.1021/la801833a. [DOI] [PubMed] [Google Scholar]
- 28.Gañán-Calvo AM. Phys Rev Lett. 1998;80:285–288. [Google Scholar]
- 29.Si T, Li F, Yin XY, Yin XZ. J Fluid Mech. 2009;629:1–23. [Google Scholar]
- 30.Gañán-Calvo AM, Montanero JM. Phys Rev E. 2009;79:066305. doi: 10.1103/PhysRevE.79.066305. [DOI] [PubMed] [Google Scholar]
- 31.Pu C, Chang S, Sun J, Zhu S, Liu H, Zhu Y, Wang Z, Xu RX. Mol Pharm. 2014;11:49–58. doi: 10.1021/mp400523h. [DOI] [PMC free article] [PubMed] [Google Scholar]
- 32.Brown DM, Regillo CD. Am J Ophthalmol. 2007;144:627–637.e2. doi: 10.1016/j.ajo.2007.06.039. [DOI] [PubMed] [Google Scholar]
- 33.Davis SC, Cazzaniga AL, Ricotti C, Zalesky P, Hsu LC, Creech J, Eaglstein WH, Mertz PM. Arch Dermatol. 2007;143:1252–1256. doi: 10.1001/archderm.143.10.1252. [DOI] [PubMed] [Google Scholar]
Associated Data
This section collects any data citations, data availability statements, or supplementary materials included in this article.


