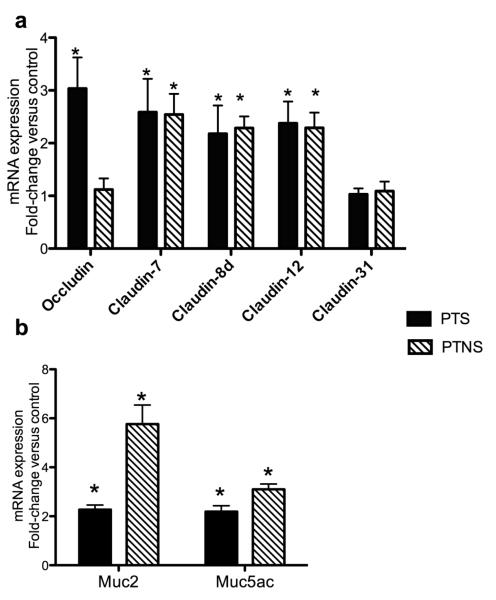
Fig. 6.
Changes in tight junction gene expression (a) and mucin gene expression (b) in PTS and PTNS skin measured by RT-qPCR. Data are expressed as the mean fold-change compared to the control skin group. Bars represent means ± standard error of six fish. Different letters represent statistically significant groups after Tukey’s test (p<0.05).

