

Abstract
The discovery of several genes that affect risk for Alzheimer's disease ignited a worldwide search for Single Nucleotide Polymorphisms (SNPs), common genetic variants that affect the brain. Genome-wide search of all possible SNP-SNP interactions is challenging and rarely attempted, due to the complexity of conducting ∼1011 pairwise statistical tests. However, recent advances in machine learning, e.g., iterative sure independence screening (SIS), make it possible to analyze datasets with vastly more predictors than observations. Using an implementation of the SIS algorithm (called EPISIS), we performed a genome-wide interaction analysis testing all possible SNP-SNP interactions affecting regional brain volumes measured on MRI and mapped using tensor-based morphometry. We identified a significant SNP-SNP interaction between rs1345203 and rs1213205 that explains 1.9% of the variance in temporal lobe volume. We mapped the whole-brain, voxelwise effects of the interaction in the ADNI dataset and separately in an independent replication dataset of healthy twins (QTIM). Each additional loading in the interaction effect was associated with ∼5% greater brain regional brain volume (a protective effect) in both ADNI and QTIM samples.
Keywords: epistasis, interaction, genome-wide, GWAS, GWIA, sure independence screening, tensor-based morphometry
1. Introduction
Many common brain disorders such as Alzheimer's disease (AD), schizophrenia, and bipolar disorder are more prevalent in family members of those affected than in the population as a whole (Pedersen et al., 2004; Lichtenstein et al., 2009). If disease risk increases in relatives of patients, it is possible to use family studies to estimate the overall proportion of disease risk attributable to common or rare transmitted variants in our DNA; this is the concept of heritability (Neale and Cardon, 1992).
However, identifying the specific DNA variants associated with increased disease risk is an incredibly complex task. There are over 3 billion base pairs in our DNA, and over 10 million of these are known to have variations that are somewhat prevalent (>1%) in the population (Altshuler et al., 2010). Each of these variants may have a unique and often unknown role to play in the biology of the human body though the vast majority likely have no role at all. Similarly, for many brain disorders we have an incomplete understanding of the underlying etiology. Commonly measured clinical scores are used for diagnosis, but, in some cases, neuroimaging measures may offer better biomarkers of disease progression and severity (Jack et al., 2004; Braskie et al., 2013).
The field of neuroimaging genetics uses neuroimaging biomarkers as proxies for disease (also called endophenotypes; Gottesman and Gould, 2003) to identify specific genetic variants that affect quantitative measures of brain structure or function. One goal of imaging genetics is to identify common genetic variants that affect the brain, positively or negatively, and then understand if and how any of those variations are associated with increased risk for developing a specific brain disease. Conversely, it is possible to use neuroimaging to identify the effects of Alzheimer's disease risk genes whose function is not yet well understood (Braskie et al., 2011). For example, a common variant in the CLU gene confers a heightened risk for AD (by 10-20%) in a large sector of the population, although the mechanism is not known. Neuroimaging of carriers of this variant revealed widespread reductions in the brains’ fiber integrity around 50 years before the disease is typically diagnosed. Similarly, the TREM2 gene harbors rarer variants that elevate AD by a still greater factor, and neuroimaging has recently establish that carriers of the adverse variant lose brain tissue faster (Rajagopalan et al., 2013).
Until recently, neuroimaging genetics studies have tended to focus on candidate genes such as brain-derived neurotrophic factor (BDNF; Bueller et al., 2006) and catechol-O-methyltransferase (COMT; Egan et al., 2001). Biffi et al. (2010) looked at Alzheimer's disease candidate genes APOE, CR1, and PICALM and found that each gene has significant effects on neuroimaging biomarkers like hippocampal volume. Candidate gene studies examine small subsets of gene changes chosen from the millions of variants in our DNA based on prior hypotheses about underlying disease pathways. However, many candidate gene studies have a mixed history of replication (see Supplementary Table 7 and 8 in Stein et al., 2012). For many candidate genes in psychiatry, although not so much in the dementia field, there is some level of controversy or uncertainty as to whether the effects are robust; very large consortia, such as the Psychiatric Genomics Consortium (Ripke et al., 2011) and the ENIGMA Consortium (Stein et al., 2012; Jahanshad et al., 2013; Hibar et al., 2013) have been set up to verify genetic effects with unprecedented power. In contrast, genome-wide association studies (GWAS), which systematically screen millions of common variants in our DNA, called single nucleotide polymorphisms (SNPs), have recently found a large number of replicated associations of genetic polymorphisms with disease, often using a hypotheses free screen of the genome (Harold et al., 2009). For example, Stein et al. (2012) performed a GWAS of mean hippocampal volume, total brain volume, and intracranial volume in 10,372 subjects for the Enhancing Neuro Imaging Genetics through Meta-Analysis (ENIGMA) Consortium. Stein et al. (2012) identified two genome-wide significant SNPs related to hippocampal volume rs7294919 (located in chromosome 12q24.22) and intracranial volume rs10784502 (located in chromosome 12q14.3). The results were independently replicated in another large GWAS by the Cohorts for Heart and Aging Research in Genomic Epidemiology (CHARGE) Consortium (Bis et al., 2012). The convergent results from the ENIGMA and CHARGE consortia provide evidence and replication for real genetic effects on hippocampal and intracranial volumes that are consistent worldwide.
However, many of the reported findings from GWA studies have small effect sizes and explain only a small proportion of the variance estimated to be due to purely genetic factors. In the ENIGMA study of hippocampal volume, Stein et al. (2012) showed that mean hippocampal volume was 64-72% heritable, but their most significant SNP explained only 0.265% percent of the total observed variance in hippocampal volume. Similarly, height is very highly heritable (around 80%; Silventoinen et al., 2003; Macgregor et al., 2006), and a large GWAS of height in 183,727 subjects identified 180 significant SNPs that collectively explain 10% of the observed variance in height (Allen et al., 2010). These findings have led to speculation about the source of the missing heritability: the proportion of variance in a trait that we know is influenced by genetics, but that is undetectable, so far, in the common genetic variants examined to date in GWA studies. Potential sources of the missing heritability might be caused by non-additive effects like dominance and SNP-SNP interactions (called epistasis; Carlborg et al., 2004) and gene-by-environment interactions (Visscher et al., 2008), and rare genetic variants (Manolio et al., 2009). It is also possible that deeper sequencing of the genome will identify causal loci with greater effects, as GWAS often genotypes only a subset of the common variants in the genome. Whole exome sequencing and whole genome sequencing, for example, are already underway for the ADNI cohort. While interaction testing holds promise, depending on the influence of the underlying interaction current statistical approaches can be underpowered (Marchini et al., 2005). Further still, some estimates show that interactions in regions outside of the highly polymorphic HLA region in the genome might not significantly improve our understanding of the problem of missing heritability (Clayton 2009). In this paper we will focus our analysis on SNP-SNP epistatic interactions. These are not well studied and some of the computational reasons and challenges are explained below, along with a proposed solution.
Some prior studies have examined epistatic effects of SNPs on brain structure (Pezawas et al., 2008; Tan et al., 2007; Wang et al., 2009). Chiang et al., (2012) tested for SNP effects on diffusion imaging measures, and aggregated all SNPs with correlated effects into a network. The concept here is different, and aims to assess gene pairs that influence each other's effects on the brain. None of these prior studies has considered genome-wide genotype data; the closest conceptually related study tested interaction effects for pre-selected SNPs in genes and pathways already known to be related to Alzheimer's disease (Meda et al., 2013). Any approach based on pre-selecting a pair of genes will overlook a vast search space of potential interactions among SNPs in the genome that have no obvious prior connection. In an interaction model, a predictor variable in the model does not have to be significant in order to result in a significant interaction. This is another way of saying that dropping non-significant SNPs from the SNP-SNP interaction search will miss some important interactions (Cordell, 2009). Given this, prior hypotheses focusing only on SNPs that have the largest known individual effects may also overlook large epistatic interaction effects. Intriguingly, power estimates for detecting interactive effects for certain models of the genetic contribution to complex traits are comparable to those for single SNP tests (Marchini et al., 2005). The inclusion of interaction terms was shown to boost the power to detect main effects in models of type 1 diabetes (Cordell et al., 2001). Here we examine the genome-wide, SNP-SNP ‘interactome’ to test genetic associations with a quantitative biomarker of Alzheimer's disease (temporal lobe volume) in the publicly available Alzheimer's Disease Neuroimaging Initiative (ADNI) dataset. We further examine the whole-brain effects of interaction pairs in statistical parametric maps generated with tensor-based morphometry (TBM); we also replicate our tests in an independent, non-overlapping dataset of young healthy twins from the Queensland Twin Imaging (QTIM) study (de Zubicaray et al., 2008).
2. Methods
2.1 Imaging parameters and study information
We downloaded the full baseline set of 818 high-resolution, T1-weighted structural MRI brain scans from the Alzheimer's Disease Neuroimaging Initiative (ADNI). ADNI is a multi-site, longitudinal study of patients with Alzheimer's disease (AD), mild cognitive impairment (MCI) and healthy elderly controls (HC). Subjects were scanned with a standardized protocol to maximize consistency across sites. We used the baseline 1.5 Tesla MRI scans, i.e., the T1-weighted 3D MP-RAGE scans, with TR/TE = 2400/1000 ms, flip angle = 8º, slice thickness = 1.2 mm, and a final voxel resolution = 0.9375 x 0.9375 x 1.2 mm3. Raw MRI scans were pre-processed to remove signal inhomogeneity, non-brain tissue, and affine registered to the MNI template (using 9 parameters).
Additionally, we obtained 753 high-resolution, T1-weighted structural MRI brain scans from the Queensland Twin Imaging (QTIM) study. QTIM is a longitudinal neuroimaging and genetic study of young, healthy twins and their family members. All structural MRI scans were acquired on a single 4-Tesla scanner (Bruker Medspec): T1-weighted images, inversion recovery rapid gradient echo sequence, TR/TE = 1500/3.35 ms, flip angle = 8º, slice thickness = 0.9 mm, 256 x 256 acquisition matrix, with a final voxel resolution = 0.9375 × 0.9375 × 0.9 mm3. Raw MRI scans were pre-processed to remove signal inhomogeneity, non-brain tissue, and affine registered to the ICBM template (using 9 parameters).
2.2 Genotype pre-processing and study demographics
Genome-wide genotyping data were available for the full set of ADNI subjects. We performed standard quality control procedures to ascertain the largest homogenous genetic sub-population in the dataset, using multi-dimensional scaling (MDS) compared to a dataset of subjects of known genetic identity (HapMap III; http://hapmap.ncbi.nlm.nih.gov/). The largest subset contained 737 subjects with CEU ancestry (i.e., Caucasians). We therefore removed the remaining 81 subjects from our analysis to limit the effects of genetic stratification on our statistical analyses (Lander and Schork et al., 1994). Additionally, we applied filter rules to the genotype data to remove rare SNPs (minor allele frequency < 0.01), violations of Hardy-Weinberg Equilibrium (HWE p < 5.7x10⁻⁷), and poor call rate (<95%). Data were further “phased” to impute any missing individual genotypes after filtering using the MaCH program (Abecasis et al., 2010) following our ENIGMA imputation protocol (ENIGMA2 Genetics Support Team, 2012). After filtering and phasing, 534,033 SNPs remained.
All QTIM subjects were ascertained for genetic similarity, so no subjects were removed before analysis. All 753 subjects in the QTIM dataset clustered with the CEU population, in the MDS analysis. The same genotype filter rules from the ADNI dataset were applied to the QTIM sample's genetic data. After filtering and phasing, 521,232 SNPs remained.
After all rounds of genotype pre-processing, the ADNI sample contained 737 subjects (mean age±sd: 75.5±6.8 yrs; 436 males) comprised of 173 patients diagnosed with Alzheimer's disease, 358 subjects with mild cognitive impairment, and 206 healthy elderly controls. The QTIM sample contained 753 subjects (mean age±sd: 23.1±3.0 yrs; 286 males) and consisted of 110 monozygotic twin pairs, 147 dizygotic twin pairs, 3 dizygotic twin trios, 143 singletons, and 87 siblings from 438 families.
2.3 Tensor-based morphometric differences in the full brain
We calculated information on regional brain morphometry using an elastic, nonlinear registration algorithm (3DMI; Leow et al., 2005; Hua et al., 2012) applied to the entire brain. Voxelwise volumetric differences were stored, using the Jacobian value of the deformation matrix obtained by nonlinearly registering a subject's scan to a study-specific minimum deformation template (MDT). Scans from the ADNI and QTIM datasets were processed and analyzed separately (using separate study-specific templates). The MDT for the ADNI sample is a nonlinear average of 40 age- and sex-matched healthy elderly controls (Hua et al., 2012). The MDT for the QTIM is a nonlinear average of 32 age- and sex- matched, unrelated subjects (Jahanshad et al., 2012). Nonlinear registration with 3DMI yields an interpolated 110 x 110 x 110 voxel statistical parametric map, where the Jacobian value at each voxel represents the expansion required to match the same voxel in the study-specific MDT.
2.4 Genome-wide, gene-gene interaction testing
The EPISIS software (Ueki and Tamiya, 2012) is an implementation of the machine-learning algorithm called sure independence screening (SIS) developed by Fan and Lv (2008). The SIS algorithm is a correlation learning method that can be applied to ultra-high dimensional datasets where the number of predictors p is much greater than the number of observations n. Despite the development of robust methods for cases where p>n (e.g., the Dantzig selector of Candes and Tao, 2007) the properties of the selector fail when p≫n. Fan and Lv (2008) developed the SIS algorithm to reduce the ultra-high dimension of p to a moderately-sized subset, while guaranteeing that the subset still explains the maximum amount of variance explained by the full set of predictors. It is important to note that the SIS method as implemented in EPISIS is a screening method, one that looks at all possible pair comparisons and selects the most associated among them. This is a different statistical approach from methods that perform dimensionality reduction, extracting the largest components from a set of SNP pairs independent of their relationship with the phenotype (Hahn et al., 2003).
We conducted an exhaustive search of association tests of genome-wide SNP-SNP interactions with temporal lobe volume computed by integrating the Jacobian over a temporal lobe ROI on the MDT (Stein et al., 2010) in the ADNI dataset using the EPISIS software. EPISIS utilizes the massively parallel processing available in GPGPU (General-purpose computing on graphics processing units) framework to test p(p-1)/2 SNP-SNP interactions in the ADNI dataset in a feasible timeframe. We used the SIS algorithm with cell-wise dummy coding (CDC; Ueki and Tamiya, 2012) to reduce the full predictor space into a subset d of n/ln(n) interaction terms (Fan and Lv, 2008). In our dataset n = 737 so in this case d = 111 SNP-SNP pairs. The subset of predictors are chosen based on the strength of the correlation of a SNP pair with the outcome measure. The SNP pairs are coded into a contingency table using cell-wise dummy coding (see Ueki and Tamiya 2012) so that the relationship of a SNP pair with the outcome measure can be estimated in a single correlation test. By selecting the set of predictors with the greatest correlation with the phenotype, by definition that set maximizes the variance explained by a subset of SNPs of size d. After screening the full set of possible two-way SNP-SNP interactions, we applied ridge regression (Hoerl, 1962; Kohannim et al., 2011) to the subset of interaction terms (the multiplicative loading of each SNP-SNP pair) and selected significant SNP-SNP interaction terms using the extended Bayesian Information Criterion (EBIC; Chen and Chen, 2008) with γ = 0.5. Ridge regression with the extended BIC can be thought of as a “double” penalized regression, where the first step is a regular ridge regression where like terms are penalized in a combined model. All of the interaction terms are included in a single model and the terms are fit penalizing unimportant or correlated variables. The second step uses the Bayesian Information Criterion to determine which SNP pairs in the model are significant. The SNPs selected are themselves penalized by the parameter γ to reduce the risk of selecting false positives (Chen and Chen, 2008). The extended BIC does not provide P-values and classical significance measures, but instead provides a cut off that controls the Type 1 error rate and selects the most parsimonious model based on the number of predictors in a model and also the total error variance (see Chen and Chen, 2008). The choice of the parameter γ was chosen based on simulations to control the false positive rate in SNP-SNP interaction testing across the genome (Ueki and Tamiya, 2012). A single exhaustive search of the genome-wide, SNP-SNP interactome with EPISIS was completed in 7 hours (using one NVIDIA Tesla C2050 GPU card).
2.5 Voxelwise interaction analysis and replication
We tested the significant SNP-SNP interaction pair selected by ridge regression for association with voxelwise, regional volume differences (V) at each point, i, in the full brain. The association test at each voxel in the ADNI dataset followed the multiplicative interaction model in multiple linear regression:
| (1) |
Additionally, we used QTIM as an independent replication sample of the top SNP-SNP interaction pair identified by ridge regression after EPISIS. The voxelwise association tests assume the multiplicative interaction model, detailed previously. Due to the family design of the QTIM sample, we tested associations using mixed-effects modeling as implemented in the R package kinship (version 1.3) in order to account for relatedness.
3. Results
After screening the full set of SNP-SNP interaction pairs for association with temporal lobe volume in the ADNI dataset, we obtained a subset 111 of SNP-SNP interaction pairs. Next, we applied ridge regression to the pruned subset of SNP-SNP interaction pairs. Using the extended BIC (γ = 0.5; Ueki and Tamiya, 2012) to estimate significance in our ridge regression, we identified a significant interaction between rs1345203 (located on chromosome 2q13) which lies in a region encoding two transcription factors (ELF1/CEBPB) and an intergenic SNP rs1213205 (located on chromosome 16p13.2). Using a linear regression model for each SNP, we found that rs1345203 explains 1.3% of the variance in residual temporal lobe volume (i.e. after controlling for age and sex), while rs1213205 explains 2.4%. Together the two SNPs explain 3.8% of the variance in residual temporal lobe volume, and including the interaction term, the full model explains 5.7%. The distribution of alleles for each SNP and their interaction is given in Table 1.
Table 1.
The distribution of alleles for the significant SNPs and the number of subjects with each genotype by study. For rs1345203 the minor allele is G (in ADNI MAF = 0.19 and in QTIM MAF = 0.14) and the major allele is A in both studies. The minor allele is A (ADNI MAF = 0.33 and QTIM MAF = 0.30) and the major allele is G for rs1213205. The association testing assumes an additive model (each subject is assigned a value 0,1,2 based on the number of minor alleles they have at a given SNP). The interaction column gives the number of subjects in each category after multiplying together the minor allele counts of each of the SNPs.
| Study | rs1345203 | rs1213205 | Interaction |
|---|---|---|---|
| ADNI (n=737) | G/G: 27 | A/A: 93 | 2 minor alleles: 46 |
| A/G: 223 | G/A: 297 | 1 minor alleles: 79 | |
| A/A: 487 | G/G: 347 | 0 minor alleles: 612 | |
|
| |||
| QTIM (n=753) | G/G: 5 | A/A: 78 | 2 minor alleles: 19 |
| A/G: 193 | G/A: 300 | 1 minor alleles: 70 | |
| A/A: 555 | G/G: 375 | 0 minor alleles: 664 | |
We further examined the significant SNP pair, rs1345203 and rs1213205, for whole-brain effects in the statistical parametric maps generated using tensor-based morphometry (TBM). In the ADNI dataset, we found broad effects bilaterally in the temporal and occipital lobes (Fig. 1) after correcting for multiple tests at a 5% false discovery rate (FDR) using the searchlight FDR method (Langers et al., 2007).
Fig. 1.
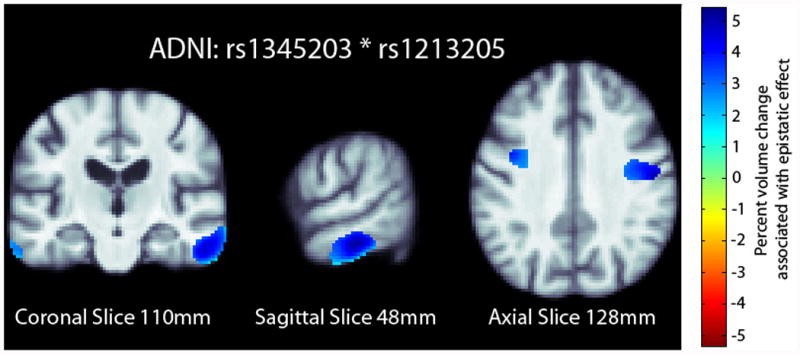
Percent change map from the ADNI overlaid on the study specific template. The percent change map is calculated from the interaction term in the regression equation at each voxel. Only significant regions in the percent change map are shown after correcting for multiple comparisons with searchlight FDR (Langers et al., 2007) at a 5% false discovery rate. Images follow radiological orientation. The origin is placed at the Posterior-Right-Inferior corner. Cooler colors over the tissue represent tissue expansion (larger regional brain volume) compared to an average template. There is a clear ‘protective’ effect of the epistatic loadings bilaterally in the temporal and occipital lobes.
We examined the whole-brain effects of the SNP pair on voxelwise, regional brain volume in the statistical parametric maps in an independent dataset (QTIM). The distribution of alleles for each SNP and their interaction in the QTIM sample is given in Table 1. In the QTIM, we identified significant effects in the left temporal lobe and along the border of the left frontal and occipital lobes (Fig. 2) after correction for multiple tests at 5% false discovery rate (FDR) using the searchlight FDR method (Langers et al., 2007).
Fig. 2.
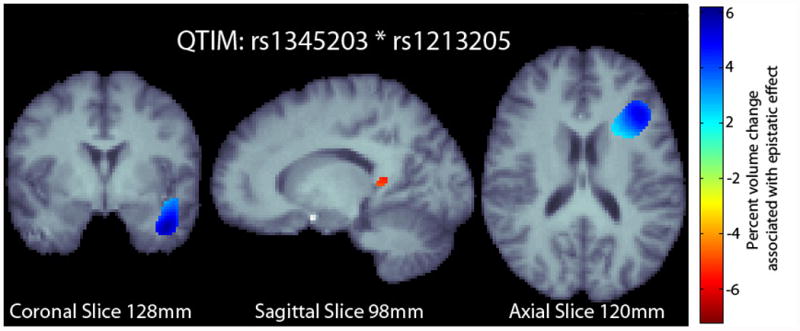
Percent change map from the QTIM sample overlaid on the study specific template. The percent change map is calculated from the interaction term in the regression equation at each voxel. Only significant regions in the percent change map are shown after correcting for multiple comparisons with searchlight FDR (Langers et al., 2007) at a 5% false discovery rate. Images follow radiological orientation. The origin is placed at the Posterior-Right-Inferior corner. Cooler colors over the tissue represent tissue expansion (larger regional brain volume) compared to an average template. There is a clear ‘protective’ effect of the epistatic loadings in the left temporal lobe and along the boundary of the frontal and occipital lobe.
4. Discussion
The genome is incredibly complex, and statistical epistasis has been suggested as an appropriate model for the biological interactions among genes and protein products in related pathways (Moore et al., 2009; Stich et al., 2007). In addition, epistasis has been posited as one biologically meaningful explanation for the missing heritability observed for many common complex traits (Manolio et al., 2009). Following the definition of epistasis given by Fisher (1919), here we examined the multiplicative effect of SNP-SNP pairs on brain volume differences. We found that significant interaction terms explain additional 1.9% (P = 1.23 x 10⁻⁴) more variance in brain volume beyond what is already explained by the additive SNP terms. Considering that many single SNPs explain less than 2% of the variance of a complex phenotype, an additional 1.9% of the variance would go missing in models that only consider main effects. In our primary tests of associations with temporal lobe volume in the ADNI dataset, we screened 1011 possible SNP-SNP interaction pairs using the GPU acceleration implemented in the EPISIS software. The top 111 interaction pairs were selected after ranking the marginal effect of each SNP-SNP pair on temporal lobe volume, using an implementation of the sure independence screening (SIS) algorithm (Fan and Lv, 2008). We used ridge regression and the extended BIC (Chen and Chen, 2008) to identify a significant interaction between rs1345203 and rs1213205. We found significant protective effects of the SNP-SNP pair on brain morphometry in two independent datasets. The 3D maps in Figure 1 and 2 give the effect of the interaction pair on brain change determined by tensor-based morphometry (TBM). Processing images with TBM allows the user to make statistical comparisons of local brain shape, or relative brain volumes, at each location across the brain. A “protective” effect may be interpreted as having more brain tissue at a given voxel when a person has more copies of the minor alleles from the SNP pair compared to those with major alleles.
There are many different methods for testing epistasis in the literature. The EPISIS method screens all possible SNP-SNP combinations using sure independence screening (SIS). The SIS algorithm examines the strength of the correlation between a SNP pair and the outcome variable. EPISIS, which we used in this paper, is one of several possible choices of tools to test for epistasis by exhaustively searching the genome; others include BOOST/gBOOST, epiBLASTER and BiForce. EPISIS has been favorably compared with two other popular programs for testing epistasis, BOOST and PLINK –fast-epistasis; power comparisons and simulations are published in Ueki and Tamiya (2012). There do appear to be similar approaches available that perform an exhaustive search (i.e. epiBLASTER; Kam-Thong et al., 2010). However, the main innovation and advancement of EPISIS is in the dummy coding statistics, which allow a user to screen interaction effects without worrying about sparsity in combined SNP pairs. Note that the results may be biased by the choice of the parameter γ which was chosen based on simulation studies (Ueki and Tamiya 2012). It is likely that a different choice of γ would result in additional significant SNP pairs (or none at all). However, we provide evidence that the chosen SNP pair replicates in a completely independent dataset, providing further evidence that the association detected with EPISIS is in fact a true effect. In this manuscript we only considered additive effects which is only one model for testing interactive effects. It is entirely possible that we have missed effects that could have been detected using a dominance model instead. To test both models in a full genomic search would involve a correction for an even greater number of statistical tests, further reducing power, but a dominant model could be tested post hoc.
The functional relevance of the epistatic effects of the two SNPs is as yet unknown. However, data obtained from the UCSC Genome Browser (http://genome.ucsc.edu/) show that rs1345203 is located in a transcription factor gene (ELF1/CEBPB) and lies within a region susceptible to histone acetylation and is likely highly expressed in the cell (Bernstein et al., 2012). The ELF1 transcription factor is involved in IL-3 immune response (Reddy et al., 2000) and the CEBPB transcription factor is involved in the IL-6 immune response (Naka et al., 2002). In addition, the rs1213205 locus lies in a region sensitive to DNAseI cleavage and may therefore lie in an exposed region of DNA in euchromatin (Bernstein et al., 2012). Loci with sensitivity to DNAseI cleavage are likely to effect gene expression by influencing access to downstream regulatory elements (Degner et al., 2012). Additional work is still required to identify precisely how these two SNPs might affect brain structure, and to further replicate their interaction. Specifically, we need to identify how changes at a given SNP are related to changes in activity in gene transcription or translation into protein products involved in similar biological pathways.
Acknowledgments
DPH is partially supported by NSF grant DGE-0707424. OK was supported in part by an NRSA award NIH F30 AG041681. Algorithm development for this study was also funded by the NIA, NIBIB, the National Library of Medicine, and the National Center for Research Resources (AG016570, EB01651, LM05639, RR019771 to PT).
We thank the twins and siblings for their participation in the QTIM study. In Brisbane, we thank Marlene Grace and Ann Eldridge for twin recruitment, Aiman Al Najjar and other radiographers for scanning, Kori Johnson for scanning and data transfer, Kerrie McAloney and Daniel Park for research support, Grant Montgomery and staff in the Molecular Epidemiology Laboratory for serum and DNA sample processing and preparation. This work was supported by National Institute of Child Health and Human Development Grant R01 HD050735, National Health and Medical Research Council (NHMRC; Australia) and Australian Research Council Future Fellowship FT0991634 (to G.I.d.Z.). Genotyping was supported by NHMRC Grant 389875. Additional support for algorithm development was provided by National Institutes of Health Grants R01 EB008432, R01 EB008281, and R01 EB007813.
Data collection and sharing for the ADNI cohort analyzed here was funded by ADNI (NIH Grant U01 AG024904). ADNI is funded by the National Institute on Aging, the National Institute of Biomedical Imaging and Bioengineering, and through generous contributions from the following: Abbott; Alzheimer's Association; Alzheimer's Drug Discovery Foundation; Amorfix Life Sciences Ltd.; AstraZeneca; Bayer HealthCare; BioClinica, Inc.; Biogen Idec Inc.; Bristol-Myers Squibb Company; Eisai Inc.; Elan Pharmaceuticals Inc.; Eli Lilly and Company; F. Hoffmann-La Roche Ltd and its affiliated company Genentech, Inc.; GE Healthcare; Innogenetics, N.V.; IXICO Ltd.; Janssen Alzheimer Immunotherapy Research & Development, LLC.; Johnson & Johnson Pharmaceutical Research & Development LLC.; Medpace, Inc.; Merck & Co., Inc.; Meso Scale Diagnostics, LLC.; Novartis Pharmaceuticals Corporation; Pfizer Inc.; Servier; Synarc Inc.; and Takeda Pharmaceutical Company. The Canadian Institutes of Health Research is providing funds to support ADNI clinical sites in Canada. Private sector contributions are facilitated by the Foundation for the National Institutes of Health (www.fnih.org). The grantee organization is the Northern California Institute for Research and Education, and the study is coordinated by the Alzheimer's Disease Cooperative Study at the University of California, San Diego. ADNI data are disseminated by the Laboratory for Neuro Imaging at the University of California, Los Angeles. This research was also supported by NIH grants P30 AG010129 and K01 AG030514. Investigators within ADNI contributed to the design and implementation of ADNI and/or provided data but did not participate in analysis or writing of this report. For a complete listing of ADNI investigators, please see: http://adni.loni.ucla.edu/wp-content/uploads/how_to_apply/ADNI_Acknowledgement_List.pdf
Footnotes
Disclosure statement: The authors have no potential financial or personal conflicts of interest including relationships with other people or organizations within three years of beginning the work submitted that could inappropriately influence this work. One of the authors, Michael Weiner, receives private funding unrelated to the content of this paper.
References
- Abecasis GR, et al. MaCH: Using Sequence and Genotype Data to Estimate Haplotypes and Unobserved Genotypes. Genetic Epidemiology. 2010;34(8):816–834. doi: 10.1002/gepi.20533. [DOI] [PMC free article] [PubMed] [Google Scholar]
- Allen HL, et al. Hundreds of variants clustered in genomic loci and biological pathways affect human height. Nature. 2010;467(7317):832–838. doi: 10.1038/nature09410. [DOI] [PMC free article] [PubMed] [Google Scholar]
- Altshuler DM, et al. A Map of Human Genome Variation from Population Scale Sequencing. Nature. 2010;467(7319):1061–1073. doi: 10.1038/nature09534. [DOI] [PMC free article] [PubMed] [Google Scholar]
- Bernstein BE, et al. An integrated encyclopedia of DNA elements in the human genome. Nature. 2012;489(7414):57. doi: 10.1038/nature11247. [DOI] [PMC free article] [PubMed] [Google Scholar]
- Braskie MN, Ringman J, Thompson PM. Neuroimaging measures as endophenotypes in Alzheimer's disease. International Journal of Alzheimer's Disease. 2011:490140. doi: 10.4061/2011/490140. http://www.ncbi.nlm.nih.gov/pmc/articles/PMC3087508/ [DOI] [PMC free article] [PubMed]
- Braskie MN, Toga AW, Thompson PM. Recent advances in imaging Alzheimer's disease. J Alzheimers Dis. 2013;33(0):S313–27. doi: 10.3233/JAD-2012-129016. [DOI] [PMC free article] [PubMed] [Google Scholar]
- Bueller JA, et al. BDNF Val66Met Allele Is Associated with Reduced Hippocampal Volume in Healthy Subjects. Biological Psychiatry. 2006;59(9):812–815. doi: 10.1016/j.biopsych.2005.09.022. [DOI] [PubMed] [Google Scholar]
- Candes E, Tao T. The Dantzig selector: Statistical estimation when p is much larger than n. The Annals of Statistics. 2007;35(6):2313–2351. [Google Scholar]
- Carlborg Ö, Haley CS. Epistasis: too often neglected in complex trait studies? Nature Reviews Genetics. 2004;5(8):618–625. doi: 10.1038/nrg1407. [DOI] [PubMed] [Google Scholar]
- Chen J, Chen Z. Extended Bayesian information criteria for model selection with large model spaces. Biometrika. 2008;95(3):759–771. [Google Scholar]
- Chiang MC, et al. Gene network effects on brain microstructure and intellectual performance identified in 472 twins. Journal of Neuroscience. 2012;32(25):8732–8745. doi: 10.1523/JNEUROSCI.5993-11.2012. [DOI] [PMC free article] [PubMed] [Google Scholar]
- Clayton David G. Prediction and interaction in complex disease genetics: experience in type 1 diabetes. PLoS genetics. 2009;5(7):e1000540. doi: 10.1371/journal.pgen.1000540. [DOI] [PMC free article] [PubMed] [Google Scholar]
- Cordell HJ. Detecting gene–gene interactions that underlie human diseases. Nature Reviews Genetics. 2009;10(6):392–404. doi: 10.1038/nrg2579. [DOI] [PMC free article] [PubMed] [Google Scholar]
- Cordell HJ, et al. Statistical modeling of interlocus interactions in a complex disease: rejection of the multiplicative model of epistasis in type 1 diabetes. Genetics. 2001;158(1):357–367. doi: 10.1093/genetics/158.1.357. [DOI] [PMC free article] [PubMed] [Google Scholar]
- de Zubicaray GI, et al. Meeting the challenges of neuroimaging genetics. Brain Imaging Behavior. 2008;2:258–263. doi: 10.1007/s11682-008-9029-0. [DOI] [PMC free article] [PubMed] [Google Scholar]
- Degner JF, et al. DNaseI sensitivity QTLs are a major determinant of human expression variation. Nature. 2012;482(7385):390–394. doi: 10.1038/nature10808. [DOI] [PMC free article] [PubMed] [Google Scholar]
- Egan MF, et al. Effect of COMT Val108/158 Met genotype on frontal lobe function and risk for schizophrenia. Proceedings of the National Academy of Sciences. 2001;98(12):6917–6922. doi: 10.1073/pnas.111134598. [DOI] [PMC free article] [PubMed] [Google Scholar]
- ENIGMA2 Genetics Support Team. ENIGMA2 1KGP cookbook (v3) [Online]. The Enhancing Neuroimaging Genetics through Meta-Analysis (ENIGMA) consortium. [accessed 27 July 2012]; [Google Scholar]
- Fan J, Lv J. Sure independence screening for ultrahigh dimensional feature space. Journal of the Royal Statistical Society: Series B (Statistical Methodology) 2008;70(5):849–911. doi: 10.1111/j.1467-9868.2008.00674.x. [DOI] [PMC free article] [PubMed] [Google Scholar]
- Fisher RA. XV. - The Correlation between Relatives on the Supposition of Mendelian Inheritance. Transactions of the Royal Society of Edinburgh. 1919;52(02):399–433. [Google Scholar]
- Gottesman II, Gould TD. The endophenotype concept in psychiatry: etymology and strategic intentions. American Journal of Psychiatry. 2003;160(4):636–645. doi: 10.1176/appi.ajp.160.4.636. [DOI] [PubMed] [Google Scholar]
- Hahn LW, et al. Multifactor dimensionality reduction software for detecting gene–gene and gene–environment interactions. Bioinformatics. 2003;19(3):376–382. doi: 10.1093/bioinformatics/btf869. [DOI] [PubMed] [Google Scholar]
- Harold D, et al. Genome-wide association study identifies variants at CLU and PICALM associated with Alzheimer's disease. Nature Genetics. 2009;41(10):1088–1093. doi: 10.1038/ng.440. [DOI] [PMC free article] [PubMed] [Google Scholar]
- Hibar DP for the ENIGMA-Consortium. ENIGMA2: Genome-wide scans of subcortical brain volumes in 16,125 subjects from 28 cohorts worldwide. Organization of Human Brain Mapping Seattle, WA; 2013. [Google Scholar]
- Hoerl AE. Application of ridge analysis to regression problems. Chemical Engineering Progress. 1962;58:54–59. [Google Scholar]
- Hua X, et al. Unbiased tensor-based morphometry: Improved robustness and sample size estimates for Alzheimer's disease clinical trials. Neuroimage. 2012 doi: 10.1016/j.neuroimage.2012.10.086. EPUB. [DOI] [PMC free article] [PubMed] [Google Scholar]
- Jack CR, et al. Comparison of different MRI brain atrophy rate measures with clinical disease progression in AD. Neurology. 2004;62(4):591–600. doi: 10.1212/01.wnl.0000110315.26026.ef. [DOI] [PMC free article] [PubMed] [Google Scholar]
- Jahanshad N, et al. Brain structure in healthy adults is related to serum transferrin and the H63D polymorphism in the HFE gene. Proc Natl Acad Sci. 2012;109(14):E851–9. doi: 10.1073/pnas.1105543109. [DOI] [PMC free article] [PubMed] [Google Scholar]
- Jahanshad N, et al. Multi-Site Genetic Analysis of Diffusion Images and Voxelwise Heritability Analysis: A Pilot Project of the ENIGMA–DTI Working Group. Neuroimage. doi: 10.1016/j.neuroimage.2013.04.061. In Press. [DOI] [PMC free article] [PubMed] [Google Scholar]
- Kam-Thong T, et al. EPIBLASTER-fast exhaustive two-locus epistasis detection strategy using graphical processing units. European Journal of Human Genetics. 2010;19(4):465–471. doi: 10.1038/ejhg.2010.196. [DOI] [PMC free article] [PubMed] [Google Scholar]
- Kohannim O, et al. Boosting power to detect genetic associations in imaging using multi-locus, genome-wide scans and ridge regression. Biomedical Imaging: From Nano to Macro IEEE. 2011 EPUB. [Google Scholar]
- Lander ES, Schork NJ. Genetic dissection of complex traits. Science. 1994;265(5181):2037–2048. doi: 10.1126/science.8091226. [DOI] [PubMed] [Google Scholar]
- Langers DR, et al. Enhanced signal detection in neuroimaging by means of regional control of the global false discovery rate. NeuroImage. 2007;38(1):43–56. doi: 10.1016/j.neuroimage.2007.07.031. [DOI] [PubMed] [Google Scholar]
- Leow A, et al. Inverse consistent mapping in 3D deformable image registration: its construction and statistical properties. Inf Process Med Imaging. 2005;19(2005):493–503. doi: 10.1007/11505730_41. [DOI] [PubMed] [Google Scholar]
- Lichtenstein P, et al. Common genetic determinants of schizophrenia and bipolar disorder in Swedish families: a population-based study. Lancet. 2009;373(9659):234–239. doi: 10.1016/S0140-6736(09)60072-6. [DOI] [PMC free article] [PubMed] [Google Scholar]
- Macgregor S, et al. Bias, precision and heritability of self-reported and clinically measured height in Australian twins. Human Genetics. 2006;120(4):571–580. doi: 10.1007/s00439-006-0240-z. [DOI] [PubMed] [Google Scholar]
- Manolio TA, et al. Finding the missing heritability of complex diseases. Nature. 2009;461(7265):747–753. doi: 10.1038/nature08494. [DOI] [PMC free article] [PubMed] [Google Scholar]
- Marchini J, et al. Genome-wide strategies for detecting multiple loci that influence complex diseases. Nature Genetics. 2005;37(4):413–417. doi: 10.1038/ng1537. [DOI] [PubMed] [Google Scholar]
- Meda SA, et al. Genetic interactions associated with 12-month atrophy in hippocampus and entorhinal cortex in Alzheimer's Disease Neuroimaging Initiative. Neurobiology of Aging. 2013;34(5):1518–e9. doi: 10.1016/j.neurobiolaging.2012.09.020. [DOI] [PMC free article] [PubMed] [Google Scholar]
- Moore JH, Williams SM. Epistasis and its implications for personal genetics. American Journal of Human Genetics. 2009;85(3):309. doi: 10.1016/j.ajhg.2009.08.006. [DOI] [PMC free article] [PubMed] [Google Scholar]
- Naka T, Nishimoto N, Kishimoto T. The paradigm of IL-6: from basic science to medicine. Arthritis Res. 2002;4(Suppl 3):S233–S242. doi: 10.1186/ar565. [DOI] [PMC free article] [PubMed] [Google Scholar]
- Neale MC, Cardon LR. Methodology for genetic studies of twins and families. 67. Kluwer Academic Pub; 1992. [Google Scholar]
- Pedersen NL, et al. How heritable is Alzheimer's disease late in life? Findings from Swedish twins. Annals of Neurology. 2004;55(2):180–185. doi: 10.1002/ana.10999. [DOI] [PubMed] [Google Scholar]
- Pezawas L, et al. Evidence of biologic epistasis between BDNF and SLC6A4 and implications for depression. Molecular Psychiatry. 2008;13(7):709–716. doi: 10.1038/mp.2008.32. [DOI] [PubMed] [Google Scholar]
- Rajagopalan P, et al. Carriers of TREM2 Alzheimer risk gene show accelerated temporal lobe atrophy and cognitive decline. OHBM, Seattle, WA; Jun, 2013. [Google Scholar]
- Reddy EP, et al. IL-3 signaling and the role of Src kinases, JAKs and STATs: a covert liaison unveiled. Oncogene. 2000;19(21):2532–2547. doi: 10.1038/sj.onc.1203594. [DOI] [PubMed] [Google Scholar]
- Ripke S, et al. Genome-wide association study identifies five new schizophrenia loci. Nature Genetics. 2011;43(10):969. doi: 10.1038/ng.940. [DOI] [PMC free article] [PubMed] [Google Scholar]
- Silventoinen K, et al. Heritability of adult body height: a comparative study of twin cohorts in eight countries. Twin Research. 2003;6(5):399–408. doi: 10.1375/136905203770326402. [DOI] [PubMed] [Google Scholar]
- Stich B, et al. Power to detect higher-order epistatic interactions in a metabolic pathway using a new mapping strategy. Genetics. 2007;176(1):563–570. doi: 10.1534/genetics.106.067033. [DOI] [PMC free article] [PubMed] [Google Scholar]
- Stein JL, et al. Genome-wide analysis reveals novel genes influencing temporal lobe structure with relevance to neurodegeneration in Alzheimer's disease. Neuroimage. 2010;51(2):542–554. doi: 10.1016/j.neuroimage.2010.02.068. [DOI] [PMC free article] [PubMed] [Google Scholar]
- Tan HY, et al. Epistasis between catechol-O-methyltransferase and type II metabotropic glutamate receptor 3 genes on working memory brain function. PNAS. 2007;104(30):12536–12541. doi: 10.1073/pnas.0610125104. [DOI] [PMC free article] [PubMed] [Google Scholar]
- Ueki M, Tamiya G. Ultrahigh-dimensional variable selection method for whole-genome gene-gene interaction analysis. BMC Bioinformatics. 2012;13(1):72. doi: 10.1186/1471-2105-13-72. [DOI] [PMC free article] [PubMed] [Google Scholar]
- Visscher PM, Hill WG, Wray NR. Heritability in the genomics era—concepts and misconceptions. Nature Reviews Genetics. 2008;9(4):255–266. doi: 10.1038/nrg2322. [DOI] [PubMed] [Google Scholar]
- Wang Y, et al. Evidence of Epistasis Between the Catechol-O-Methyltransferase and Aldehyde Dehydrogenase 3B1 Genes in Paranoid Schizophrenia. Biological Psychiatry. 2009;65(12):1048–1054. doi: 10.1016/j.biopsych.2008.11.027. [DOI] [PubMed] [Google Scholar]
- Wray NR, et al. Multi-locus models of genetic risk of disease. Genome Med. 2010;2(10) doi: 10.1186/gm131. [DOI] [PMC free article] [PubMed] [Google Scholar]