Abstract
Chronic Kidney Disease (CKD) is associated with abnormalities in bone quantity and quality leading to increased fractures. Recent studies suggest abnormalities of Wnt signaling in animal models of CKD and elevated sclerostin levels in patients with CKD. The goal of this study was to evaluate the effectiveness of anti-sclerostin antibody treatment in an animal model of progressive CKD with low and high parathyroid hormone (PTH) levels. Cy/+ male rats (CKD) were treated without or with calcium in the drinking water at 25 weeks of age to stratify the animals into high PTH and low PTH groups, respectively, by 30 weeks. Animals were then treated with anti-sclerostin antibody at 100 mg/kg IV weekly for 5 doses, a single 20 ug/kg subcutaneous dose of zoledronic acid, or no treatment and sacrificed at 35 weeks. As a positive control, the efficacy of anti-sclerostin antibody treatment was also evaluated in normal littermates. The results demonstrated that the CKD animals with high PTH had lower calcium, higher phosphorus, and lower FGF23 compared to the CKD animals with low PTH. Treatment with anti-sclerostin Ab had no effect on any of the biochemistries, while zoledronic acid lowered dkk-1 levels. The anti-sclerostin antibody increased trabecular BV/TV., trabecular mineralization surface, in animals with low, but not high, PTH. Neither anti-sclerostin antibody nor zoledronic acid improved biomechanical properties in the animals. Cortical porosity was severe in high PTH animals and unaffected by either treatment. In contrast, in normal animals treated with anti-sclerostin antibody, there was an improvement in bone volume, cortical geometry, and biomechanical properties. In summary, this is the first study to test the efficacy of anti-sclerostin Ab treatment on animals with advanced CKD. We found efficacy in improving bone properties only when the PTH levels were low.
Keywords: Renal Osteodystrophy, parathyroid hormone, sclerostin, Wnt, FGF23, CKD-MBD
INTRODUCTION
Chronic Kidney Disease affects over 20 million Americans and many of these individuals are older and at risk for fragility fractures (1). CKD-Mineral Bone Disorder is a systemic disease in patients with estimated glomerular filtration rates (eGFR) < 60 ml/min (CKD stage 3–5) that manifests as abnormal biochemistries, renal osteodystrophy, and extra skeletal calcification (2,3). The potential contribution of renal osteodystrophy, versus osteoporosis, in the pathogenesis of fragility fractures in patients with impaired kidney function has led to confusion on the treatment of bone loss. In human trials, secondary analyses of individuals with CKD stage 3–5 have found a beneficial effect of bisphosphonates, raloxifene, and denosumab in post-menopausal women with reduced fractures and improved bone mineral density without adverse consequences (4–8). However, these individuals were enrolled into the studies based on normal kidney function and parathyroid hormone levels and only subsequently identified to have CKD in post hoc analyses. With normal PTH levels, one can argue that the change in GFR is related to age based decline in kidney function rather than intrinsic disease and therefore not representative of CKD-MBD.
The role of PTH in renal osteodystrophy has been the focus of therapies for many years. Low and high levels of PTH have been correlated with low and high bone formation rates, and lowering elevated PTH with calcitriol and its analogs or cinacalcet is currently the primary therapy for renal osteodystrophy. Clinical practice guidelines recommend correction of elevated PTH prior to any consideration for other bone/anti-osteoporotic treatment in patients with bone loss (1). The concern over the use of anti-resorptives has stemmed from reports that these agents may ‘over suppress’ PTH and cause a dynamic bone disease (1), which may be associated with bone fractures and extra-skeletal calcification. Unfortunately, PTH, despite being a major contributor to the pathogenesis of renal osteodystrophy, lacks ideal discriminatory ability for the differentiation of low and high turnover and thus misclassification is common (9). Therefore, treatments that are efficacious in improving or ameliorating bone loss regardless of the PTH are needed.
In addition to elevated PTH, patients with CKD also have elevated FGF23 and sclerostin levels. PTH stimulates FGF23 secretion from osteocytes via a sclerostin mediated pathway (10,11) and suppresses sclerostin secretion from osteocytes (12). Sclerostin levels are increased in CKD compared to normal individuals with osteoporosis, and levels are inversely associated with PTH levels (13). Sclerostin, the protein product of the gene SOST, binds to LRP5/6 on the osteocyte to competitively inhibit the binding of Wnt ligands. Normally, Wnt binding to LRP5/6 leads to stabilization of β-catenin (canonical pathway), and regulation of normal bone accrual via osteoblast differentiation. In the presence of sclerostin, the β-catenin is degraded and mesenchymal stem cell differentiation to mature bone cells is inhibited (Reviewed in (14)). In animal models, sclerostin deletion enhances bone accrual (15–19) and in early human trials (20) treatment with an antibody to sclerostin is anabolic. Given that sclerostin levels are elevated in blood of patients with CKD (21) and bone of patients and animals with CKD (22) the anabolic agent anti-sclerostin antibody may be efficacious in all forms of renal osteodystrophy independent of PTH and bone turnover. To test this hypothesis we used a slowly progressive model of CKD-MBD, manipulating the PTH to low and high levels. We then compared treatment with anti-sclerostin Ab, zoledronic acid, or no treatment on biochemical, vascular calcification, and bone outcomes.
MATERIALS AND METHODS
Animal model and experimental design
We tested the hypothesis that anti-sclerostin antibody is efficacious in preventing bone loss in animals with both high PTH and low PTH, the latter induced by calcium in the drinking water. We have previously shown that these two extremes of PTH lead to high and low activation frequencies and bone formation rates, respectively (23,24). Briefly, male Cy/+ rats, Han:SPRD rats with autosomal dominant polycystic kidney disease, and normal age matched Han:SPRD rats (NL) were used for this study. Male heterozygous rats (Cy/+) develop characteristics of CKD (azotemia) around 10 weeks of age which progresses gradually. By 35 weeks, as we have previously reported (25–27), untreated CKD animals at 35 weeks of age have biochemical abnormalities that parallel advanced CKD in humans: in the CKD animals versus NL littermates, the BUN was 49.3 ± 8.3 vs 22.0 + 4.7 mg/dl, the PTH was 1560 ± 859 vs 132 ± 67 pg/ml; the phosphorus was 8.4 ± 1.8 vs. 3.6 + 0.6 mg/dl; and the calcium was 8.99 ± 2.0 vs. 10.3 ± 0.5 mg/dl.
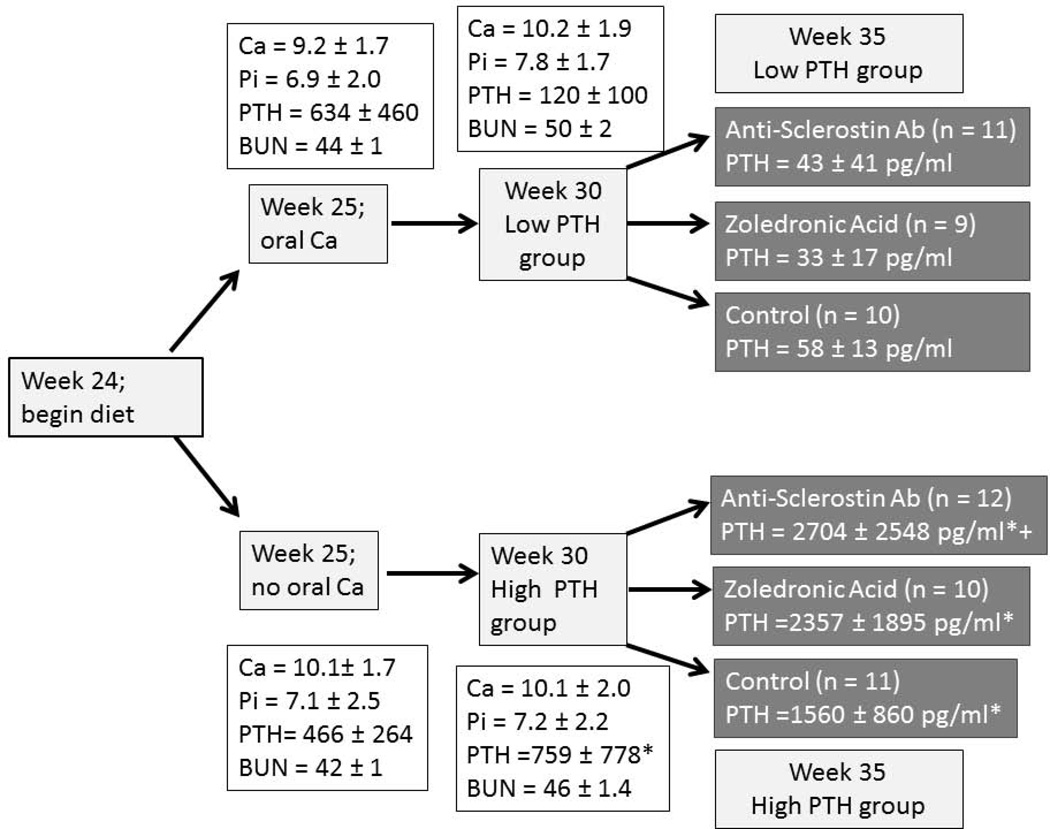
For the current study, animals were placed on a standard casein diet (Purina AIN-76A; 0.53% Ca and 0.56% P) at 24 weeks of age which has been shown to produce a more consistent disease in this model (25). At 25 weeks of age, with an estimated kidney function of 35% of normal, animals were randomly assigned to 3% calcium in the drinking water or normal water to suppress or maintain the hyper parathyroid state (Figure 1). The additional calcium intake based on average water consumption is 1.98 ± 0.57 g/day. At 30 weeks of age with estimated kidney function at 20% of normal, animals in both the low and high PTH groups were randomly assigned to anti- sclerostin Ab (Scl-Ab; 100 mg/kg given by tail vein IV q week for 5 total doses; Novartis Institutes for BioMedical Research, Novartis Pharma AG), zoledronic acid (ZOL; 20 µg/kg body weight given subcutaneously once at week 30, a dose previously shown to suppress bone remodeling in this model (23)), or no treatment (CTL) for 5 weeks. In addition, we studied age-matched normal (NL) littermate animals as a positive control for the anti-sclerostin Ab. Each group had a final n of 9 to 12 animals (Fig 1); 1 animal died suddenly in each of three groups: the CKD group treated with zoledronic acid, the CKD group treated with calcium and anti-sclerostin Ab, and the CKD group treated without calcium and anti-sclerostin Ab. This is consistent with our previous studies. In addition, two animals had to be sacrificed early in the anti-sclerostin treatment groups due to saphenous vein inflammation resulting from pharmacokinetic blood sampling. These animals were not included in the final analyses. At 35 weeks of age all animals were euthanized by an overdose of sodium pentobarbital. All procedures were reviewed and approved by the Indiana University School of Medicine Institutional Animal Care and Use Committee.
Figure 1. Schematic of study design.
CKD animals were fed a casein based diet beginning at 24 weeks, then given drinking water with or without 3% calcium beginning at 25 weeks. Drug administration began at 30 weeks of age, and sacrifice was at 35 weeks. Data are mean ± SD. * = p < 0.05 for comparison between animals given calcium or no calcium, + = p < 0.05 for anti-sclerostin Ab versus control. Final n for each group is included in the boxes.
Tissues collection and analysis
At sacrifice at 35 weeks, blood was collected by cardiac puncture. Left tibiae were placed in 10% neutral buffered formalin for 48 hours and then changed to 70% ethanol for imaging followed by histological processing. Right femora were wrapped in saline-soaked gauze and frozen for later biomechanical analyses and CT evaluation. Left ventricular mass index (LVMI) was determined by dividing total heart weight by body weight. To quantify aorta and heart calcification, proximal segments of the ascending aorta were snap frozen and the degree of calcification determined biochemically as previously described (27,28).
Serum and urine biochemical measurements
Pharmacokinetics analyses of the Scl-Ab were performed by measuring levels of the anti-sclerostin Ab in serum of eight CKD rats after the first and last dose at 6 and 24 hours post injection using a custom made immunoassay (Novartis Pharma AG). Blood plasma was analyzed for BUN, calcium, phosphorus, and creatinine using colorimetric assays (Point Scientific, Canton, MI, USA, or Sigma kits). Intact PTH was determined by ELISA (Alpco, Salem, NH, USA). FGF23 was assessed with a two-site assay (Immunotopics, San Clemente, CA, USA). Dickkopf-related protein family-1 (Dkk-1) and Sclerostin levels were measured by ELISA (Enzo Life Sciences, Farmingdale NY; R&D systems, Minneapolis, MN, respectively).
Computed tomography (CT)
Morphological parameters of the proximal tibia and femoral mid-diaphysis were assessed using high-resolution micro CT (Skyscan 1172) as previously described (27). Scans were obtained using a 60kV x-ray source (167 µA), an angular range of 180 degrees (rotational steps of 0.70 degrees with 2 frame averaging) with a 12-µm pixel size and 0.5mm Al filter. Projection images were reconstructed using standard Skyscan software (NRecon). A 1mm region of interest of the proximal tibia (located ~ 0.5 mm distal to the growth plate) was analyzed by manually segmenting the trabecular bone from the cortical shell and calculating trabecular bone volume normalized to total volume (BV/TV) in accordance with recommended guidelines (29). The most distal slice of the region of interest was analyzed for cortical porosity. Scans of the femoral diaphysis were conducted with similar scan settings to assess geometry (bone area, perimeter, cross-sectional moment of inertia) for normalization of mechanical properties. Measures were made in accordance with recommended guidelines (30).
Biomechanics
Femoral diaphysis mechanical properties were assessed in 4-point bending studies on a servo-hydraulic test system (Test Resources). Bones were thawed, hydrated in saline, and then placed posterior surface down on bottom supports (span = 18 mm). The upper supports (span = 6 mm) were brought down in contact with the specimen’s anterior surface, and then testing was conducted at a displacement rate of 2 mm/min. Force versus displacement data was collected at 10 Hz and structural parameters were determined from curves using a customized MATLAB program. Material properties were estimated using standard equations (31).
Bone Histomorphometry
Proximal tibiae were embedded in methylmethacrylate for sectioning as previously described (23,32). The proximal tibial metaphysis was thin sectioned (4 µm) and mounted unstained using non-fluorescent medium. Sections were analyzed using a microscope interfaced with a semiautomatic analysis system (Bioquant OSTEO 7.20.10, Bioquant Image Analysis Co.). For trabecular bone analyses, a region of interest of ~ 8 mm2 within the secondary spongiosa (~ 0.5 mm distal to the growth plate) was outlined, and then measures of single- and double-label perimeter (sL.Pm, dL.Pm), total bone perimeter (B.Pm) and interlabel width (Ir.L.Wi) were conducted. From these primary measurements, derived parameters were calculated as: mineralizing surface (MS/BS = [1/2sL.Pm + dL.Pm]/B.Pm; %), mineral apposition rate (MAR =Ir.l.W/days between labels; µm/day), and bone formation rate (BFR/BS = MAR × MS/BS × 3.65; µm3/µm2/yr). All parameters were measured and calculated in accordance with ASBMR recommended standards (33).
Real time (quantitative) RT-PCR analysis of SOST expression
Total RNA was isolated from tibiae using miRNeasy Mini kit (Qiagen, Valencia, CA). after flushing out the bone marrow. The SOST expression in bone was determined by real time PCR using 1 ug of total RNA in TaqMan Reverse Transcription reagent (Applied Biosystems, Foster City, CA). Target-specific PCR primer for SOST was obtained from Applied Biosystems. Real-time PCR amplification was performed using TaqMan Gene Expression Assays (TaqMan MGP probes, FAM dye-labeled) using Applied Biosystems ViiA-7 Real Time PCR system (Applied Biosystems). The cycle number at which the amplification plot crosses the threshold was calculated (CT), and the ΔΔCT method was used to analyze the relative changes in gene expression using β-actin as a housekeeping gene.
Western blot analysis of β-catenin activation in bone tissue
To determine the effect of sclerostin antibody treated animals on β-catenin signaling in bone tissue, proteins were isolated from tibiae by homogenizing the tissue with RIPA buffer using the Bullet Blender (Next Advance, Inc, Averill Park, NY) according to manufacturer’s instructions. The β-catenin activation was determined by Western blot as we previously described (34) using phosphorylated β-catenin antibody. Briefly, the blots were incubated with antibody against pSer33/37 β-catenin (1:1000, Cell Signaling Technology, Danvers, MA) overnight at 4°C followed by incubating with peroxidase conjugated secondary antibody (1:5000 dilution), and immunodetection with the Enhanced Chemiluminescence Prime Western blot Detection Reagent (Amersham, Piscataway, NJ). The band intensity was analyzed by Chemi Doc MP Imaging System (Imaging Lab 4.0, Bio-Rad, Richmond, CA).
Statistics
All analyses were run using Sigma Stat software. The two CKD groups (high and low PTH) at week 30, prior to drug treatment and the normal animals with and without Scl-Ab were compared by t-test. The six CKD groups at 35 weeks were analyzed by two-way ANOVA after log transformation for non normally distributed data. The two groups compared were PTH status (low vs. high), and drug effect (Scl-Ab, Zol, CTL) in order to test the efficacy of treatments in the setting of low and high PTH. Fisher’s Post hoc tests were done for within group comparisons for the different drugs if the overall drug effect was significant. When there was a significant interaction between PTH group and drug treatment we made statements regarding the relative effect of the drug in the setting of high PTH versus low PTH. Correlations were done by Pearson Product after log transformation if appropriate. A priori α-levels were set at 0.05. Data are presented as means and standard deviation.
RESULTS
Biochemical outcomes
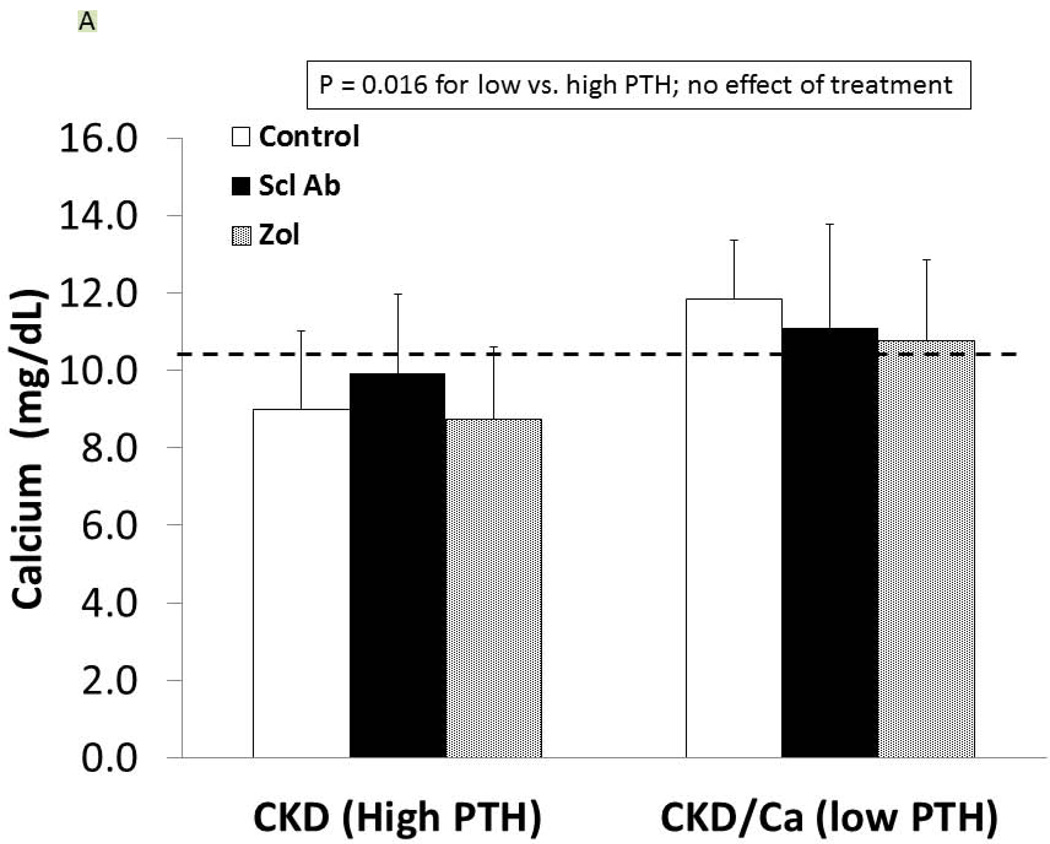
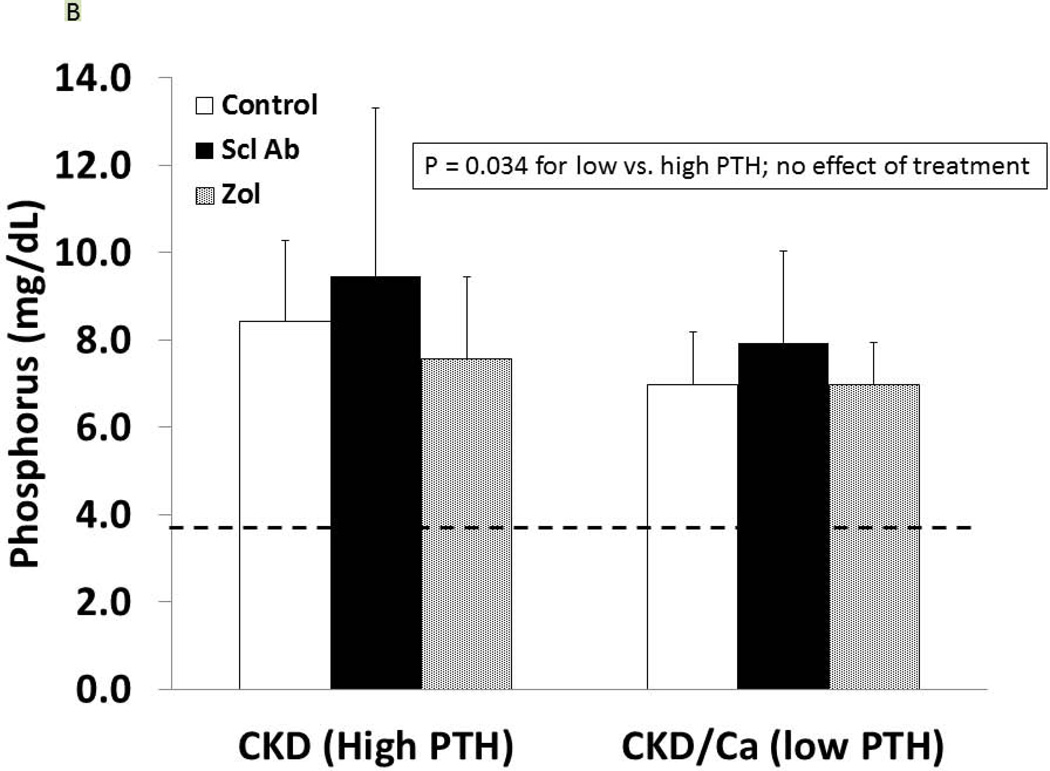
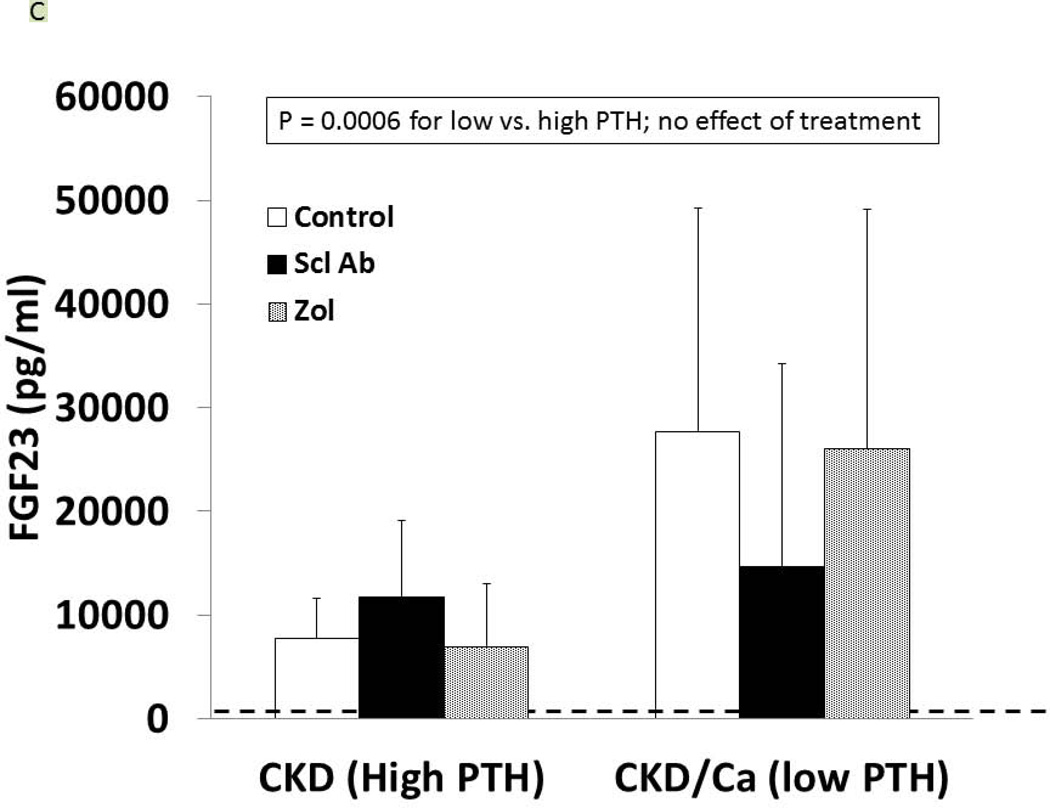
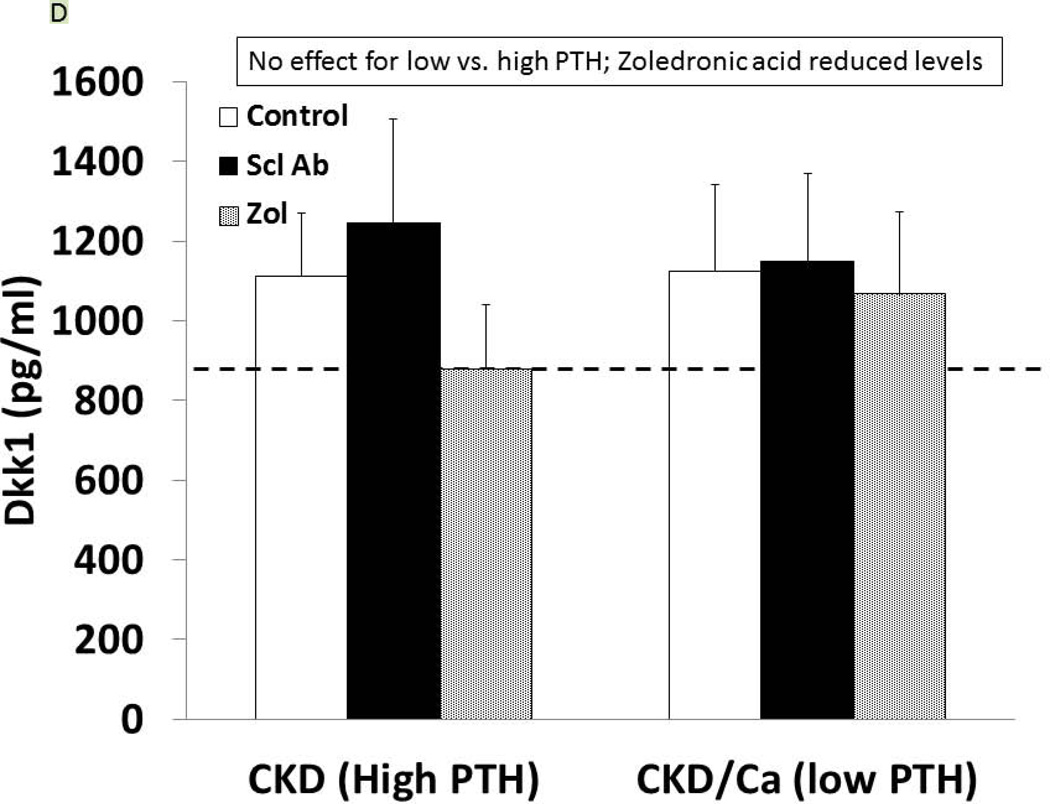
As detailed in Figure 1, at 25 weeks of age, the CKD animals had established secondary hyperparathyroidism. After 5 weeks on oral calcium, the PTH was suppressed to 120 ± 100 pg/ml in the calcium treated group compared to 759 ± 778 in the high PTH (p < 0.05). At 35 weeks, the calcium treated animals (low PTH groups) had a further decline in PTH compared to week 30, whereas the non-calcium (high PTH groups) animals had a further rise in PTH (overall p < 0.001; Figure 1). There was no difference of drug treatment on PTH with the exception of a slightly more elevated PTH in the high PTH group treated with anti-sclerostin Ab compared to control (p = 0.03). At 35 weeks, there was no difference in the level of BUN among CKD groups, indicating no adverse effect on kidney function (data not shown). Figure 2 shows the high PTH (left set of bars) compared to low PTH groups (right set of bars) at 35 weeks for calcium (Figure 2A), phosphorus (2B), FGF23 (2C), and Dkk-1 (2D). The high vs. low PTH groups were different for calcium (p = 0.016), phosphorus (p = 0.034), and FGF23 (p< 0.001), but the drug effect was not significant for any of these and there was no interaction between PTH group and drug treatment by 2 way ANOVA.
Figure 2. Biochemical results.
At 35 weeks, the CKD animals had blood assessed for calcium (A), phosphorus (B), FGF23 (C), and dkk-1 (D) levels. The animals with high PTH (left) were compared to those treated with calcium and with low PTH (right) by two way ANOVA examining effect of PTH and treatment. For calcium (p = 0.016), and FGF23 (p = 0.0003) there was a difference between the high and low PTH (large bar across top), but no effect of treatments (groups of 3 bars). For phosphorus, there was a significant effect of both PTH (p < 0.001), and a significant effect of treatment (p < 0.001) due to significant effects of zoledronic acid to increase phosphorus levels compared to both sclerostin Ab treated and control treated animals (both p < 0.001). In contrast, for dkk-1, there was no effect by PTH group, but the treatment effect was significant (p = 0.004), with zoledronic acid lowering the dkk-1 compared to both control (p = 0.03).
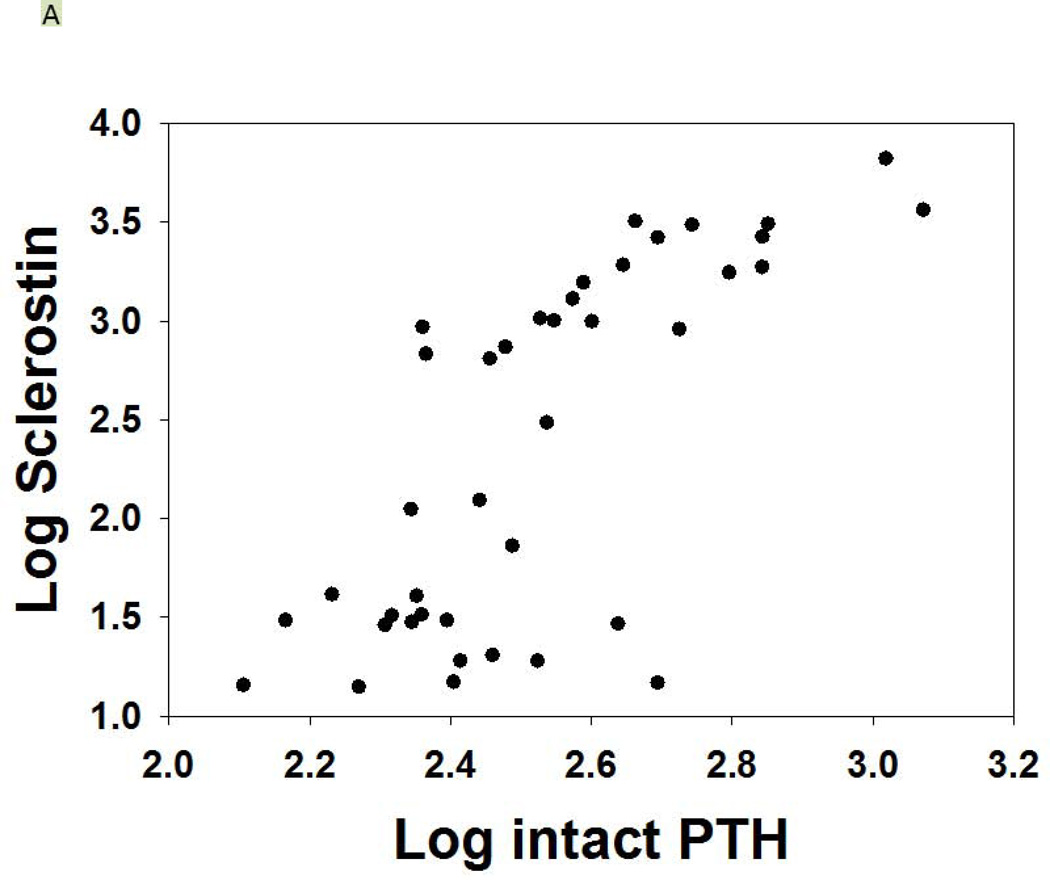
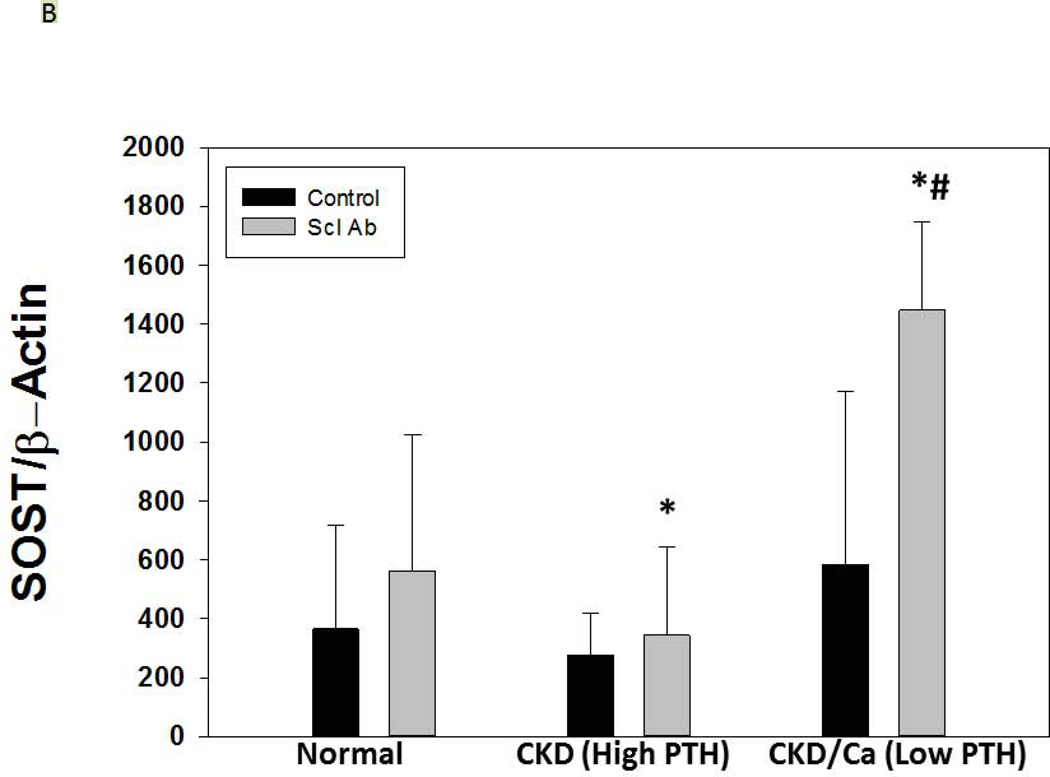
As expected, serum levels of Dkk-1 and sclerostin were both elevated in CKD compared to NL animals (p = 0.04, p < 0.001). In the CKD animals, Dkk-1 levels were unaffected by PTH group (p = 0.52), but were affected by drug treatment (overall p = 0.004; ZOL different than Scl-Ab and CTL, both p < 0.03; Figure 2D). There was a weak correlation between Dkk-1 and FGF23 (r = 0.32, p = 0.01) and calcium (r = 0.25, p = 0.047), a modest correlation with kidney function (BUN; r = 0.51, p < 0.001), but no significant correlation with PTH. The sclerostin levels were inconsistent in the groups treated with the anti-sclerostin Ab due to probable cross-reactivity with the antigen-antibody complex and the assay in both the CKD and the NL animals and thus only the other groups were evaluated. The sclerostin levels in the high PTH group were 458 ± 122, high PTH with zol= 563 ± 339, low PTH 249 ± 122, and low PTH with zol = 260 ± 102 (p = 0.005). There was a strong positive correlation of the log sclerostin vs log PTH (r = 0.73, p < 0.001; Figure 3A). Given the assay limitations, we measured SOST gene expression in the bone by real time PCR to determine if anti-sclerostin Ab had any effect on SOST gene expression. The results showed an increase in SOST expression with the administration of the anti-sclerostin Ab, but only in the calcium treated low PTH animals (Figure 3B).
Figure 3. Sclerostin levels and SOST expression.
Figure 3A shows the relationship between the sclerostin and PTH levels (r = 0.73, p < 0.001) for the CKD animals. Those animals treated with anti-sclerostin Ab are not included due to interference with the assay. Figure 3B shows the expression of total bone SOST with and without treatment with anti-sclerostin Ab. There was an increase with Ab treatment in only the low PTH animals (* p < 0.001). The expression level of SOST in the low PTH animals was significantly greater than in the high PTH animals (#, p < 0.001). Data are mean ± SD.
Cardiovascular outcomes
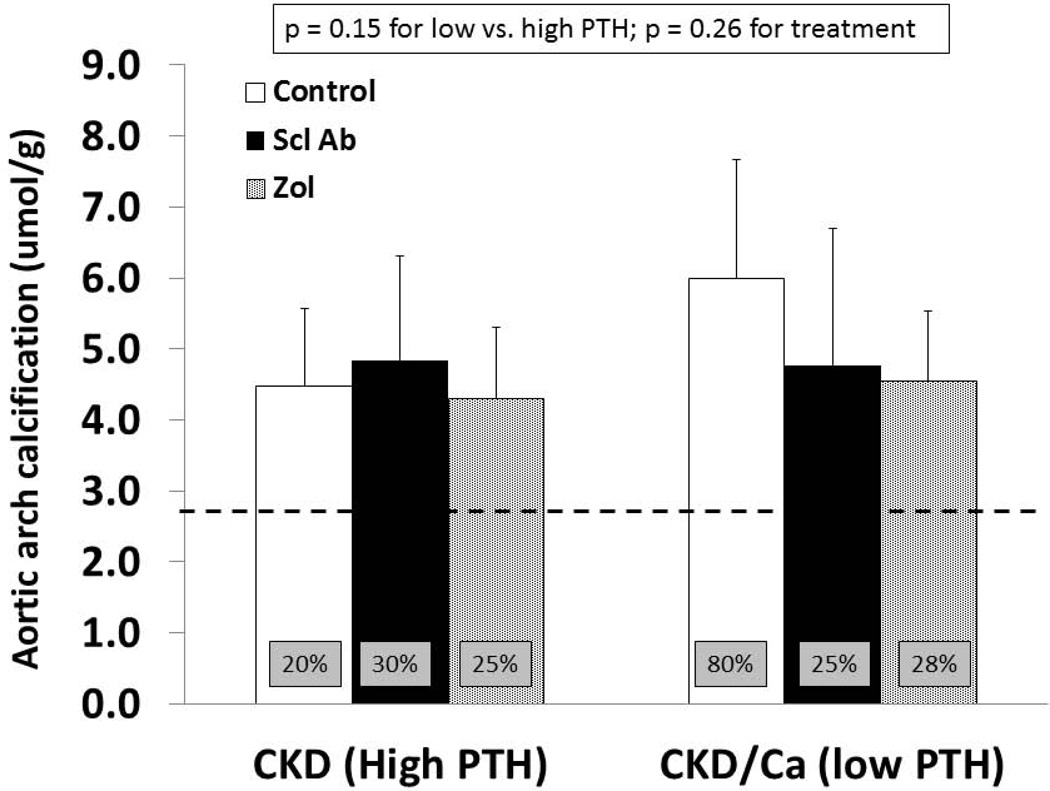
As previously reported, the left ventricular mass index was greater in untreated CKD animals (3.59 ± 0.12) compared to NL animals (2.99 ± 0.24) (p < 0.001). Within the CKD groups there was no difference by PTH or by drug treatment by two way ANOVA (p = 0.26). Similarly, there was a difference between the aorta arch calcification between untreated CKD and NL animals (p = 0.01) but within the CKD animals no effect on calcification by PTH (p = 0.15) or treatments (p = 0.26) by 2 way ANOVA (Figure 4). There was a trend towards reduction in calcification by both zoledronic acid and anti-sclerostin Ab in the low PTH group. Eighty percent of animals in the low PTH control group had significant calcification (defined as > 5.26 umol/g which is the normal littermate average value of mean + 2SD), compared to 20–30% of animals in the other groups (boxes in bars in Figure 4).
Figure 4. Aorta arch calcification.
At 35 weeks, the aorta arch was dissected free and analyzed for calcium content after HCl extraction, normalizing for tissue weight. By 2-way ANOVA there was no significant difference between the groups, although there was a trend towards increased calcification in the calcium treated control animals; an effect that appeared attenuated by both drug treatments. The bar graphs represent the mean ± SD. The box insets in each bar indicate the percentage of animals in each group with significant calcification (defined as > 5.26 umol/g which is the normal littermate average value of mean + 2SD). The dashed line represents the mean value from the normal littermate animals.
Bone outcomes
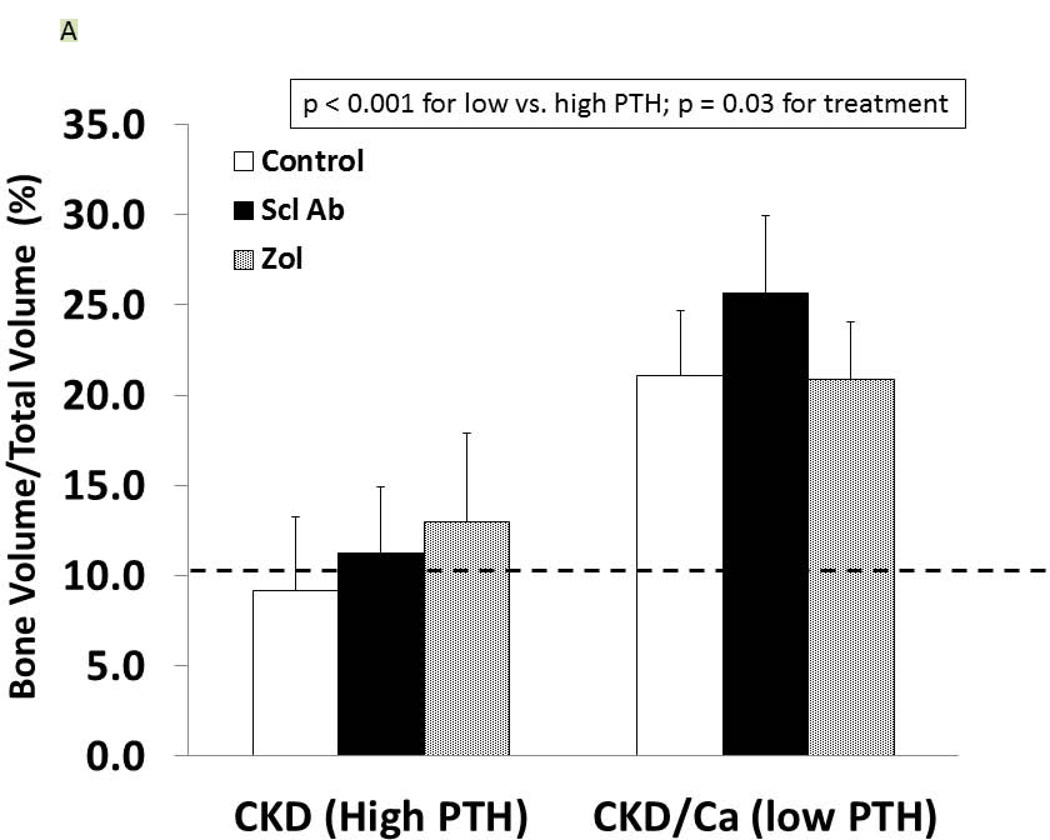
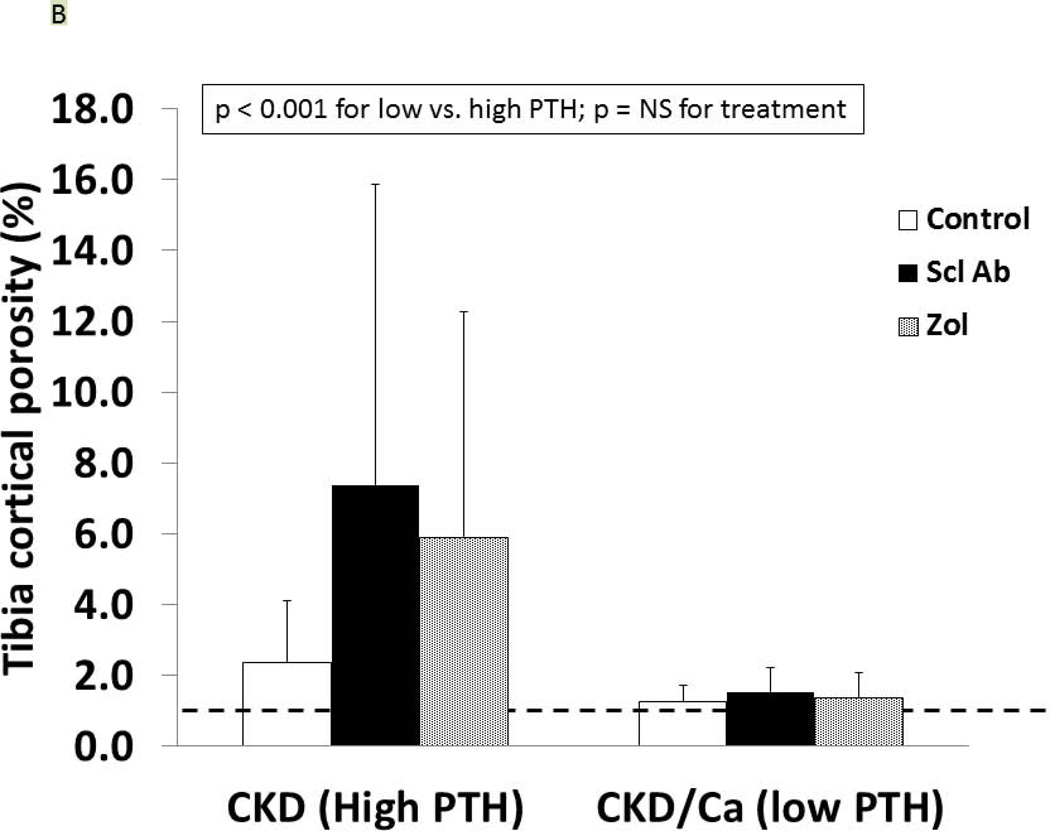
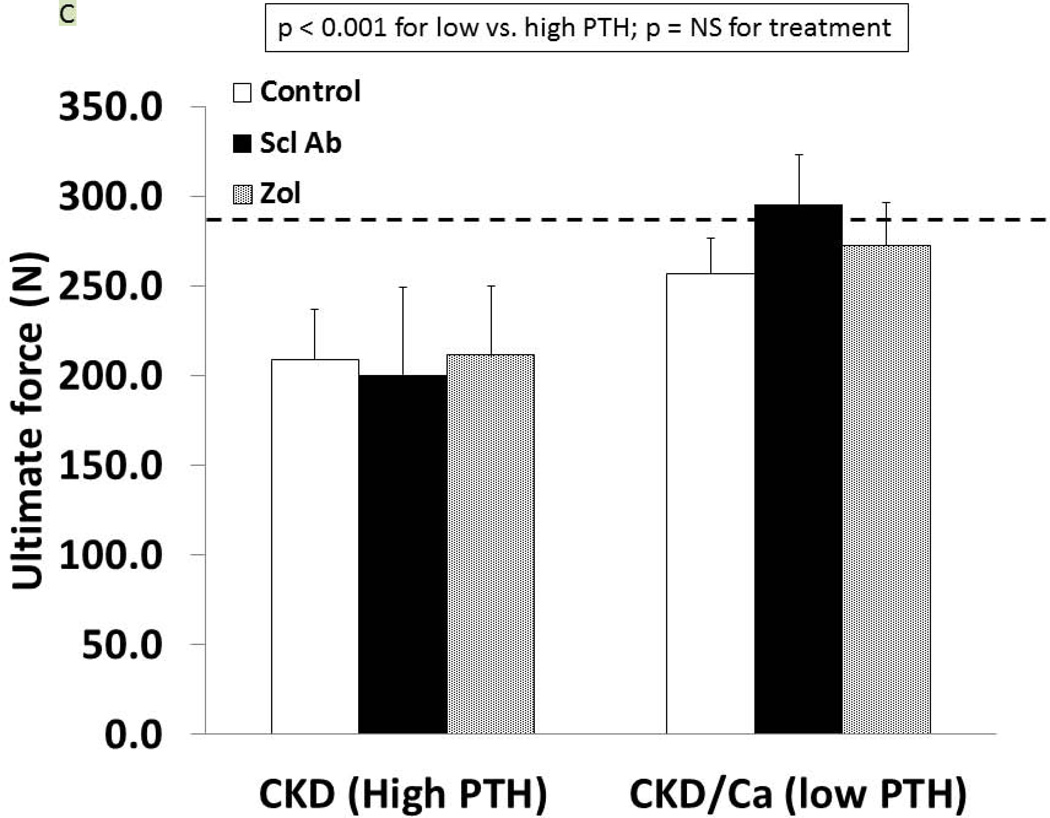
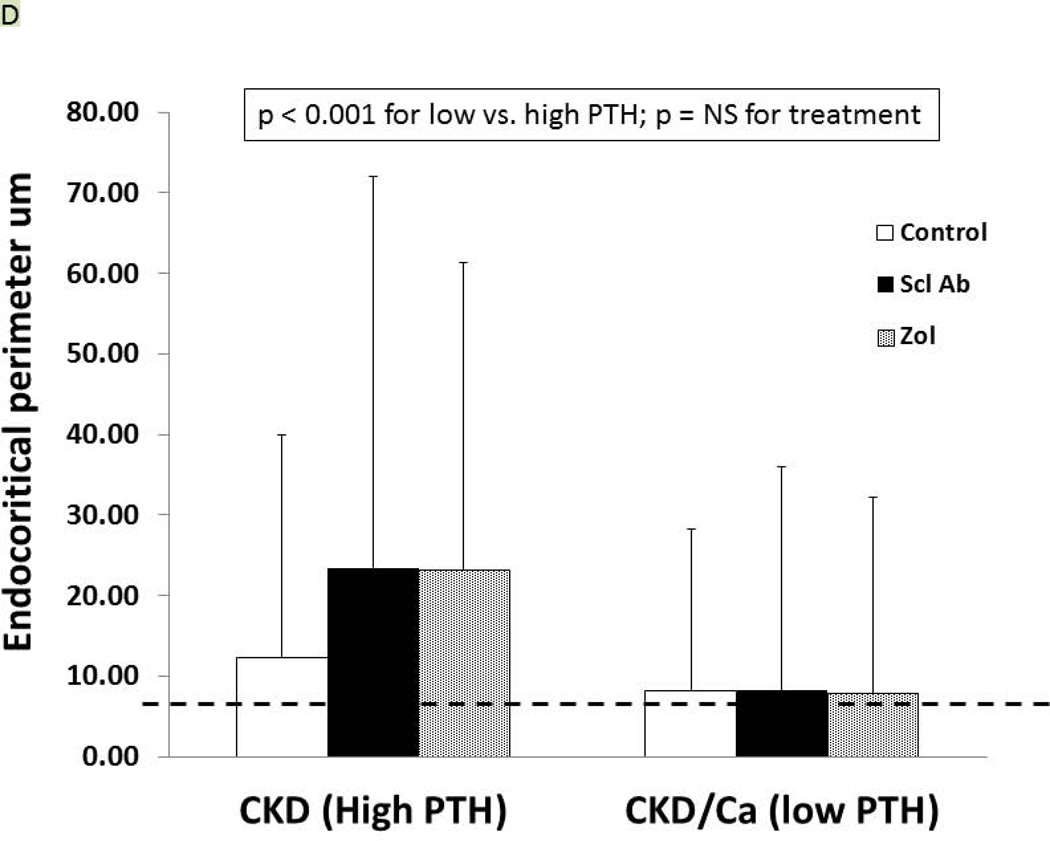
As we have previously reported (27), the trabecular BV/TV of the untreated CKD animals was not different from the normal animals (9.1 ± 4.1 vs. 10.2 ± 4.2%, respectively) but the cortical porosity was greater (CKD: 2.37 ± 1.74 vs NL: 0.97 ± 0.39, p = 0.02). In the CKD animals at 35 weeks, there was an effect of both PTH (p < 0.0001) and drug treatment (p = 0.03) on trabecular BV/TV (Figure 5A). The within drug treatment group difference was significant for only Anti-sclerostin Ab vs. CTL (p = 0.008). There was also a significant PTH group*Drug treatment interaction (p = 0.04) in that the anti-sclerostin Antibody treatment increased BV/TV in the low but not high PTH group. Similar results were demonstrated for femoral mid-diaphysis cortical bone area and cross-sectional moment of inertia (Table 1). In contrast, proximal tibia cortical porosity as well as all mechanical and geometrical parameters of the femoral mid-diaphysis showed significant PTH effects (p < 0.001 for all) but only a trend towards an effect of drug treatment (p = 0.9) (Figure 5B, 5C, Table 1). The periosteal perimeter was not different, but the endocortical perimeter was greater in the high PTH group compared to the low PTH group (p < 0.001) with no effect of treatment due to the wide variability (Figure 5D). Corresponding cross sectional microCT images are shown in Figure 5E. As a positive control, NL animals given similar doses of Scl-Ab, demonstrated a robust increase in trabecular BV/TV (p < 0.001). There was also an increase in biomechanical properties and cortical geometry (Table 1). The anti-sclerostin Ab treatment of NL animals had no effect on any of biochemistries. Thus, in the NL rats, there was the expected benefit of the anti-sclerostin antibody.
Figure 5. Bone Results.
At 35 weeks, bone from the CKD animals was assessed by microCT for proximal tibial trabecular bone volume (A), cortical porosity (B), femur ultimate force (C) and for femur cortical bone endocortical perimeter (D) and ultimate force (D). The animals with high PTH (left) were compared to those treated with calcium and with low PTH (right) by two way ANOVA examining effect of PTH and treatment. For bone volume, porosity, and ultimate force (all p < 0.001) there was a difference between the high and low PTH. There was a positive effect of treatment on bone volume with the sclerostin Ab increasing the volume more than control (p = 0.008). There was no effect of treatment for cortical porosity or ultimate force. The dashed line represents the mean value from the normal littermate animals. Figure E shows representative images by microCT of the animals. Cortical porosity (blue arrow) was prominent in the high PTH animals and not affected by drug treatment. Figures 5 A through D are presented as mean ± SD.
Table 1.
Bone CT and Biomechanical Results
| Proximal tibia | Femoral mid-diaphysis | |||||||||||
|---|---|---|---|---|---|---|---|---|---|---|---|---|
| BV/TV (%) |
Cortical Porosity (%) |
Ultimate Force (N) |
Stiffness (N/mm) |
Energy to failure (mJ) |
Ultimate Stress (MPa) |
Modulus (MPa) | Toughness (MJ/m3) |
Cortical thickness(mm) |
Cortical bone area (mm2) |
Cortical porosity (%) |
CSMI (mm4) |
|
| CKD High PTH | ||||||||||||
| CTL | 10.2 ± 1.9 | 2.4 ± 1.7 | 208.9 ± 27.7 | 456.7 ± 64.6 | 93.8 ± 18.5 | 100 ± 16 | 3686 ± 546 | 2.7 ± 0.6 | 0.58 ± 0.10 | 7.4 ± 0.4 | 2.8 ± 2.9 | 22.4 ± 1.8 |
| Scl-Ab | 11.3 ± 3.7 | 7.4 ± 8.5 | 200.5 ± 48.7 | 471.9 ± 99.0 | 83.8 ± 35.4 | 92 ± 28 | 3527 ± 916 | 2.3 ± 1.1 | 0.49 ± 0.19 | 8.1 ± 0.4 | 7.2 ± 5.8 | 23.9 ± 2.2 |
| Zol | 13.0 ± 4.9 | 5.9 ± 6.4 | 211.2 ± 38.3 | 428.8 ± 59.7 | 96.6 ± 30.0 | 104 ± 25 | 3570 ± 683 | 2.8 ± 0.9 | 0.54 ± 0.18 | 7.8 ± 0.6 | 6.2 ± 7.0 | 21.9 ± 2.7 |
| CKD Low PTH | ||||||||||||
| CTL | 21.1 ± 3.6 | 1.3 ± 0.5 | 256.7 ± 20.2 | 561.6 ± 47.5 | 112.6 ± 15.2 | 115 ± 9 | 4306 ± 419 | 2.9 ± 0.5 | 0.80 ± 0.07 | 8.8 ± 0.7 | 4.5 ± 8.3 | 23.6 ± 2.5 |
| Scl-Ab | 25.6 ± 4.3* | 1.5 ± 0.7 | 295.1 ± 27.8 | 593.9 ± 31.1 | 126.6 ± 29.7 | 127 ± 19 | 4224 ± 555 | 3.3 ± 0.9 | 0.80 ± 0.05 | 9.0 ± 0.7 | 0.77 ± 0.48 | 25.7 ± 3.1 |
| Zol | 20.9 ± 3.2 | 1.4 ± 0.7 | 272.3 ± 24.3 | 567.6 ± 43.9 | 111.9 ± 23.5 | 124 ± 11 | 4349 ± 667 | 3.0 ± 0.7 | 0.82 ± 0.06 | 8.9 ± 0.8 | 0.71 ± 0.57 | 23.9 ± 3.7 |
| Normal animals | ||||||||||||
| CTL | 10.2 ± 1.9 | 1.0 ± 0.4 | 268.0 + 21.0 | 562.4 ± 37.5 | 131.1 ± 29.1 | 116 ± 16 | 3767 ± 320 | 3.6 ± 1.0 | 0.73 ± 0.05 | 8.6 ± 0.3 | 1.8 ± 0.6 | 26.4 ± 2.4 |
| Scl-Ab | 16.0 ± 1.9* | 1.2 ± 0.6 | 339.5 ± 31.3+ | 663.5 ± 101.9* | 169.7 ± 29.5* | 114 ± 12 | 3254 ± 443* | 3.9 ± 0.9 | 0.79 ± 0.03 * | 10.3 ± 0.6+ | 1.3 ± 0.3 | 36.8 ± 3.5+ |
CTL= control or no treatment; Scl-Ab = treatment with anti-sclerostin Ab; Zol = treatment with zoledronic acid; CSMI = cross sectional moment of inertia. Data presented as mean and standard deviation.
The CKD animals were compared by two-way ANOVA evaluating the effect of PTH and treatment. There were significant differences (p < 0.01) by PTH group for all bone parameters. There was a significant effect of drug treatment in that treatment with sclerostin Ab was different than control for trabecular bone volume (p = 0.03), cortical bone area (P = 0.05), and CSMI (p = 0.043) with no differences among treatments for the other parameters. Data are mean ± SD.
The Normal animals with and without treatment with anti-sclerostin Ab were compared by t-test.
= p < 0.05,
= p < 0.01.
As we have previously reported, the high PTH group is a high bone remodeling model of CKD, with untreated animals having BFRs of nearly three times NL controls. There were significantly higher dynamic bone formation properties of the proximal tibia trabecular bone in the high PTH animals (Table 2) compared to the low PTH animals. In both high and low PTH cohorts those animals treated with anti-sclerostin antibody had higher remodeling rates compared to animals treated with zoledronic acid.
Table 2.
| N, # | MAR, um/day |
MS/BS, % | BFR/BS, um3/um2/year |
|
|---|---|---|---|---|
| CKD High PTH | ||||
| CTL | 11 | 2.2 ± 1.1 | 31 ± 8 | 280 ± 156 |
| Scl-Ab | 12 | 2.8 ± 1.7 | 29 ± 8 | 323 ± 221 |
| Zol | 9 | 2.0 ± 1.0 | 21 ± 10 | 166 ± 117 |
| CKD Low PTH | ||||
| CTL | 10 | 1.2 ± 0.3 | 11 ± 5 | 49 ± 18 |
| Scl-Ab | 12 | 1.2 ± 0.6 | 28 ± 17 | 154 ± 154 |
| Zol | 9 | 0.4 ± 0.2 | 5 ± 4 | 8 ± 7 |
| Normal animals | ||||
| CTL | 8 | 1.2 ± 0.3 | 21 ± 7 | 94 ± 42 |
| Scl-Ab | 8 | 1.4 ± 0.3 | 24 ± 9 | 133 ± 66 |
CTL= control or no treatment; Scl-Ab = treatment with anti-sclerostin Ab; Zol = treatment with zoledronic acid; MAR = mineral apposition rate; MS/BS = mineralizing surface per bone surface; BFR/BS = bone formation rate per bone surface. Data presented as mean and standard deviation. The CKD animals were compared by two-way ANOVA evaluating the effect of PTH and drug treatment. After log transformation, there were significant PTH (all < 0.001) and overall drug treatment (p < 0.02 for all) effects for MAR, MS/BS and BFR/BS, and a significant PTH*drug treatment interaction for MS/BS% (p = 0.006) and BFR/BS (p = 0.009). Between group analyses revealed that Animals with higher PTH had values compared to low PTH (p < 0.002 for all three measurements). The MAR and BFR/BS were both different in ZOL compared to anti-sclerostin Ab and control (both p < 0.02) but the anti-sclerostin Ab was not different from control. All three treatments were different from each other for the MS/BS% (all p < 0.03). The Normal animals with and without treatment with anti-sclerostin Ab were compared by t-test but there was no significant difference for any parameter.
To understand the differential effects of anti-sclerostin Ab on bone in the low and high PTH group, we measured phosphorylated β-catenin by Western blot from total bone extracts. In the CKD animals basal expression was 0.39 ± 0.18. In the CKD animals treated with anti-sclerostin Ab, the expression was 0.52 ± 0.28 in the high PTH group and 0.19 ± 0.17 in the low PTH group (p = 0.3, with differences in the two treated groups of p = 0.008). Phosphorylated β-catenin expression represents degradation, and therefore less degradation would indicate a positive effect of the anti-sclerostin Ab in the low PTH group, consistent with the bone volume findings.
Pharmacokinetic results
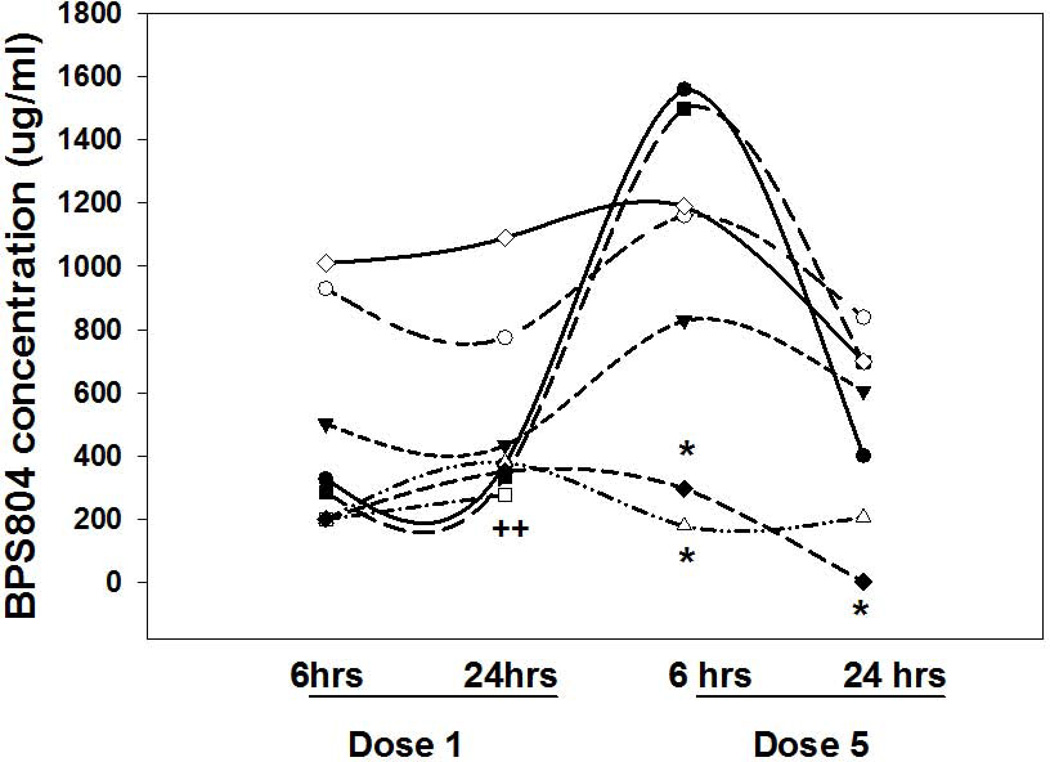
Three of 8 CKD rats treated with anti-sclerostin AB developed auto-antibodies to the drug. The animals that developed auto-antibodies did not have appreciably lower BV/TV than those without auto-antibodies and therefore are included in all of the analyses. The pharmacokinetic curves are shown in Figure 6. Thus, auto-antibodies to anti-human sclerostin antibody were formed, similar to previously reported in studies using humanized anti-OPG antibody (35,36).
Figure 6. Pharmacokinetic results.
Eight animals had blood drawn for measurement of the anti-sclerostin antibody 6 and 24 hours after the first and fifth dose.. The y-axis represents the measured level of the anti-sclerostin antibody (BPS804) in the blood of each animal. Each symbol represents a different animal. * = the presence of auto-antibodies in serum at that time point. For the animal denoted by the open square (++), levels were undetectable at dose 5 and auto antibodies were present.
DISCUSSION
In the present study we demonstrated that treating rats by inhibiting the activity of sclerostin in advanced CKD with a relatively normal PTH improved tibial trabecular bone volume and cortical bone geometry. In contrast, in animals with high PTH no benefit was observed. In the high PTH animals, the magnitude of hyperparathyroidism was severe, leading to profound cortical porosity but relatively normal tibial trabecular bone volume; neither anti-sclerostin antibody nor zoledronic acid improved the porosity. The phosphorylated β-catenin was not changed over baseline in the CKD animals treated with anti-sclerostin Ab with a high PTH but were appropriately decreased in the low PTH group, consistent with the lack of benefit in the high PTH group. As expected, dynamic histomorphometry (Table 2) demonstrated differences between low and high PTH for MAR, MS/BS and BFR. There was also a significant interaction between PTH group and treatment in the MS/BS and BFR/BS but not MAR. The MS/BS was decreased in the ZOL and increased in the anti-sclerostin Ab treated animals in the Low PTH but not the High PTH groups. The BFR/BS was suppressed by ZOL in the Low PTH but not the High PTH groups. Biomechanical testing demonstrated that neither anti-sclerostin antibody nor zoledronic acid were effective in improving the biomechanical properties of the bone, regardless of PTH level. These results demonstrate that cortical bone abnormalities prevail in CKD animals with elevated PTH, similar to what is observed in patients with CKD (37). However, even in the setting of low PTH, the improvement in bone volume did not translate to improved biomechanics, suggesting other factors alter bone quality in CKD. The efficacy of anti-sclerostin Ab to improve bone volume, geometry, and biomechanics in normal rats confirms that the observed lack of efficacy in the CKD animals was due to the disease state, and not because of auto-antibody development in rats. These results suggest that abnormal Wnt signaling, especially in the high PTH group, may negate any effect of blockade of the sclerostin mediated pathway. Alternatively, or additively, other factors in CKD may lead to such altered bone quality that anabolic changes due to the anti-sclerostin antibody are overshadowed.
Wnt signaling is mediated through the LRP5/6 pathway that is inhibited by the circulating factors sclerostin and dkk-1. PTH binds to its receptor PTH1R and activates β-catenin signaling via multiple mechanisms: 1) binding to LRP6 to activate LRP5/LRP6 signaling even in the absence of Wnt, 2) cAMP signaling to directly activate β-catenin, and 3) indirectly via osteoclast activation which then increase β-catenin activity in osteoblasts (Reviewed in (14)). Thus, PTH can activate β-catenin through non Wnt-mediated pathways. Mice expressing a constitutively active PTH1R in osteocytes leads to cAMP signaling which increases β-catenin and osteoblast mediated bone modeling in periosteal bone (38,39). Deletion of LRP6 in osteoblasts blunts the anabolic activity of intermittent PTH administration (40) whereas deletion of LRP5 does not (41). Mice expressing a constitutively active PTH1R or animals receiving continuous infusion of PTH 1–84 (analogous to the secondary hyperparathyroidism in the animals in the present study) also have Wnt-dependent remodeling with increased osteoclast bone resorption via RANKL/OPG leading to osteoblast activation and β-catenin activation (39,42). PTH suppresses expression of dkk-1 in osteoblasts, but even if dkk-1 is overexpressed, PTH can still activate the Wnt pathway via stabilization of phosphorylation of β-catenin (30). In the present study we found increased phosphorylated (degraded) β-catenin in the high PTH animals compared to the low PTH animals treated with anti-sclerostin Ab suggesting that the elevated PTH itself does not increase β-catenin directly but more likely interferes with the LRP5/6 receptor. It is important to point out that our high PTH animals had very severe hyperparathyroidism and other studies are needed to determine if more moderate hyperparathyroidism would show beneficial bone effects of anti-sclerostin antibody.
The importance of Wnt signaling in renal osteodystrophy was first shown by Sabbagh et al (22) who characterized progressive secondary hyperparathyroidism with osteitis fibrosa in the jck mouse model of cystic kidney disease. They found an initial increase in immunoexpression of sclerostin and phosphorylated β-catenin in earlier CKD, but as the disease progressed and secondary hyperparathyroidism and hyperphosphatemia developed there was a relative decline in the number of osteocytes expressing sclerostin. They also found no further increase in the phosphorylated β-catenin expression with rising PTH consistent with our results of a lower phosphorylated β-catenin in animals with high PTH compared to low PTH. They hypothesized this was due to progressive rises in PTH or in serum frizzled related protein 4 (sFRP4), another inhibitor of sclerostin (22). We did not measure sFRP4 in our animals but this remains a possibility. In a diabetic/atherosclerotic mouse model of early stage 2 CKD, serum levels of sclerostin and Dkk1 were increased. The administration of Dkk1 monoclonal antibody to these mice led to a decrease in PTH levels, an increase in circulating sclerostin levels, and an increase in the low bone formation rate, osteoblast and osteoclast number (43). The PTH levels, while initially increased in these animals were lower at the end of the study and equivalent in both the vehicle and anti-dkk treated animals (43). Those results with the anti-dkk-1 antibody parallel the efficacy observed in our low PTH group with anti-sclerostin antibody treatment. Taken together the data suggest that PTH plays a major role in β-catenin signaling in renal osteodystrophy.
Circulating sclerostin levels are increased in patients with progressive decline in kidney function, beginning as early as stage 3 CKD (44). In contrast to other circulating biomarkers, these increases do not appear related to reduced renal excretion (45). However, in patients with primary hyperparathyroidism, sclerostin levels are lower than euparathyroid controls (46). In patients on hemodialysis, elevated sclerostin levels, but not serum Dkk-1 levels, were associated with increased bone mineral density at both trabecular and cortical sites by DXA and improved trabecular architecture by microCT in dialysis patients (13). By multivariate analyses in a cohort of 60 dialysis patients, elevated sclerostin levels were only correlated with osteoblast number on bone biopsy. However, sclerostin levels had positive predictive value of 0.93 for high bone formation rate compared to only 0.57 for intact PTH; for low bone formation rates, PTH was superior (21). Dkk-1 levels were not significantly correlated with any histomorphometric analyses. We also found elevated Dkk1 levels in our naturally occurring CKD animal model. We also saw a slight increase in the dkk-1 levels in animals treated with anti-sclerostin Ab in the high PTH group only, perhaps another explanation for a lack of efficacy of the anti-sclerostin Ab in the high PTH group.
In the present study, the sclerostin levels were greater in the high PTH animals compared to the low PTH animals. In contrast to other studies (21), we found a positive correlation between PTH and blood sclerostin levels. Given that PTH is known to suppress SOST, we then evaluated the levels of SOST expression in total bone extracts. There was no difference in basal expression of SOST in the CKD compared to normal animals, but there was a trend towards an increase in the CKD animals with low PTH (treated with calcium), and a further increase in the with treatment with anti-sclerostin Ab. We hypothesize that treatment with the Ab reduces sclerostin levels leading to upregulation of SOST. Unfortunately we could not confirm this as the assay cross reacted with the Ab. The increase in SOST with the anti-sclerostin Ab was much greater in the animals with low PTH. This may suggest that PTH inhibits SOST as has been shown (12), and/or that the elevated calcium or FGF23 in these animals increases SOST. Another potential reason why we saw a positive relationship of sclerostin with PTH may be due to the elevated phosphorus in these same animals. In a study of dialysis patients, elevated sclerostin levels were associated with lower GFR, male sex and high phosphorus levels (44). In a rat model of CKD induced by nephrectomy, parathyroidectomy and a high phosphorus diet vs parathyroidectomy and a normal phosphorus diet led to higher circulating sclerostin levels, lower bone volume, and increased bone expression of SOST, Dkk-1, and Gsk3b suggesting that phosphorus has a PTH independent effect to suppress Wnt signaling (47). Treating normophosphatemic stage 3 to 4 CKD patients with the non calcium containing phosphate binder sevelamer led to a reduction in sclerostin levels, however, calcium binders had no effect on sclerostin levels despite effectively lowering phosphorus (48). In the present study we utilized calcium in the drinking water to suppress PTH, which also acts like a phosphate binder to lower phosphorus levels. Thus it is possible that the elevated sclerostin levels in the high PTH group are due to hyperphosphatemia, and/or that the calcium administration used to lower PTH decreases sclerostin levels (21). Clearly more work is needed to understand the regulation of SOST, especially in the setting of CKD.
Calcium (or lower PTH) also increases FGF23 levels in our animals as we have previously reported (27). In the present study, anti-sclerostin Ab had no effect on FGF23 levels although there was a trend towards lowering of FGF23 levels in the low PTH group. However, the variability of FGF23 in this naturally occurring animal model of CKD was such that this did not reach significance. However, treatment with anti-dkk-1 Ab in mice with early stage of CKD did not alter FGF23 levels (43). PTH also stimulates FGF23 via cAMP and Wnt signaling (11) and thus we would have expected lower, not higher FGF23 levels in our low PTH animals. In addition, the low PTH group had elevated FGF23 that was unaffected by anti-sclerostin Ab. This implies that the calcium treatment used to lower PTH likely has a direct effect on FGF23 synthesis. Calcium treatment also led to more animals with arterial calcification, an observation that was moderated by both zoledronic acid and anti-sclerostin antibody treatment. Similarly, Fang et al found that anti-dkk-1 therapy in CKD animals reduced arterial calcification (43). Whether sclerostin plays a pathogenic role in arterial calcification or the expression is simply a marker of osteo-chondrogenic transformation remains to be seen.
In summary, our study is the first to test the efficacy of anti-sclerostin Ab in the setting of renal osteodystrophy. In our rat model of slowly progressive CKD, the antibody enhanced trabecular bone volume and mineralization surface, but only in the setting of low PTH and this did not translate to improved biomechanical properties. In the animals with severe secondary hyperparathyroidism, the antibody was not efficacious, most likely due to PTH interference of Wnt signaling by alteration of the LRP5/6 receptor, or through effects of changes in phosphorus or FGF23.
ACKNOWLEDGEMENTS
All authors were involved in the design, conduct and analyses of the study. Sharon M. Moe, Neal X. Chen, Christopher L. Newman, Jason M. Organ, and Matthew R. Allen were involved in manuscript preparation. The authors would like to thank Drew Brown, Shannon Roy, and Kali O’Neill for technical assistance. They would also like to thank Denise Sickert at the Novartis Institutes for Biomedical Research, Novartis Switzerland, for the pharmacokinetic analyses. The authors would like to dedicate this paper to Vincent H. Gattone II (1951–2013) whose dedication to research was an inspiration to us all.
Grant Support: NIH AR 058005 and Novartis.
SM has received honoraria and grant support from Sanofi, consulted for Novartis, and owns stock in Eli Lilly. MRA has received consultation honoraria from Merck and research support from Merck and Eli Lilly. MK and IK are employees of Novartis.
Footnotes
Disclosures: All other authors report no conflicts of interest.
REFERENCES
- 1.KDIGO. Clinical Practice Guidelines for the Management of CKD-MBD. Kidney International. 2009;76(S113):S1–S130. doi: 10.1038/ki.2009.188. [DOI] [PubMed] [Google Scholar]
- 2.Moe S, Drueke T, Cunningham J, Goodman W, Martin K, Olgaard K, Ott S, Sprague S, Lameire N, Eknoyan G Kidney Disease: Improving Global O. Definition, evaluation, and classification of renal osteodystrophy: a position statement from Kidney Disease: Improving Global Outcomes (KDIGO) Kidney Int. 2006;69(11):1945–1953. doi: 10.1038/sj.ki.5000414. [DOI] [PubMed] [Google Scholar]
- 3.Moe SM, Drueke T, Lameire N, Eknoyan G. Chronic kidney disease-mineral-bone disorder: a new paradigm. Adv Chronic Kidney Dis. 2007;14(1):3–12. doi: 10.1053/j.ackd.2006.10.005. [DOI] [PubMed] [Google Scholar]
- 4.Miller PD, Roux C, Boonen S, Barton IP, Dunlap LE, Burgio DE. Safety and efficacy of risedronate in patients with age-related reduced renal function as estimated by the Cockcroft and Gault method: a pooled analysis of nine clinical trials. J Bone Miner Res. 2005;20(12):2105–2115. doi: 10.1359/JBMR.050817. [DOI] [PubMed] [Google Scholar]
- 5.Miller PD, Schwartz EN, Chen P, Misurski DA, Krege JH. Teriparatide in postmenopausal women with osteoporosis and mild or moderate renal impairment. Osteoporos Int. 2007;18(1):59–68. doi: 10.1007/s00198-006-0189-8. [DOI] [PubMed] [Google Scholar]
- 6.Jamal SA, Bauer DC, Ensrud KE, Cauley JA, Hochberg M, Ishani A, Cummings SR. Alendronate treatment in women with normal to severely impaired renal function: an analysis of the fracture intervention trial. J Bone Miner Res. 2007;22(4):503–508. doi: 10.1359/jbmr.070112. [DOI] [PubMed] [Google Scholar]
- 7.Ishani A, Blackwell T, Jamal SA, Cummings SR, Ensrud KE. The effect of raloxifene treatment in postmenopausal women with CKD. J Am Soc Nephrol. 2008;19(7):1430–1438. doi: 10.1681/ASN.2007050555. [DOI] [PMC free article] [PubMed] [Google Scholar]
- 8.Jamal SA, Ljunggren O, Stehman-Breen C, Cummings SR, McClung MR, Goemaere S, Ebeling PR, Franek E, Yang YC, Egbuna OI, Boonen S, Miller PD. Effects of denosumab on fracture and bone mineral density by level of kidney function. J Bone Miner Res. 2011;26(8):1829–1835. doi: 10.1002/jbmr.403. [DOI] [PubMed] [Google Scholar]
- 9.Sprague SM, Moe SM. Rebuttal: PTH--a particularly tricky hormone: why measure it at all in kidney patients? Clin J Am Soc Nephrol. 2013;8(2):321. doi: 10.2215/CJN.10331012. [DOI] [PubMed] [Google Scholar]
- 10.Lavi-Moshayoff V, Wasserman G, Meir T, Silver J, Naveh-Many T. PTH increases FGF23 gene expression and mediates the high-FGF23 levels of experimental kidney failure: a bone parathyroid feedback loop. Am J Physiol Renal Physiol. 2010;299(4):F882–F889. doi: 10.1152/ajprenal.00360.2010. [DOI] [PubMed] [Google Scholar]
- 11.Rhee Y, Bivi N, Farrow E, Lezcano V, Plotkin LI, White KE, Bellido T. Parathyroid hormone receptor signaling in osteocytes increases the expression of fibroblast growth factor-23 in vitro and in vivo. Bone. 2011;49(4):636–643. doi: 10.1016/j.bone.2011.06.025. [DOI] [PMC free article] [PubMed] [Google Scholar]
- 12.Bellido T, Saini V, Pajevic PD. Effects of PTH on osteocyte function. Bone. 2013;54(2):250–257. doi: 10.1016/j.bone.2012.09.016. [DOI] [PMC free article] [PubMed] [Google Scholar]
- 13.Cejka D, Jager-Lansky A, Kieweg H, Weber M, Bieglmayer C, Haider DG, Diarra D, Patsch JM, Kainberger F, Bohle B, Haas M. Sclerostin serum levels correlate positively with bone mineral density and microarchitecture in haemodialysis patients. Nephrol Dial Transplant. 2012;27(1):226–230. doi: 10.1093/ndt/gfr270. [DOI] [PubMed] [Google Scholar]
- 14.Baron R, Kneissel M. WNT signaling in bone homeostasis and disease: from human mutations to treatments. Nat Med. 2013;19(2):179–192. doi: 10.1038/nm.3074. [DOI] [PubMed] [Google Scholar]
- 15.Marenzana M, Vugler A, Moore A, Robinson M. Effect of sclerostin-neutralising antibody on periarticular and systemic bone in a murine model of rheumatoid arthritis: a microCT study. Arthritis Res Ther. 2013;15(5):R125. doi: 10.1186/ar4305. [DOI] [PMC free article] [PubMed] [Google Scholar]
- 16.McGee-Lawrence ME, Ryan ZC, Carpio LR, Kakar S, Westendorf JJ, Kumar R. Sclerostin deficient mice rapidly heal bone defects by activating beta-catenin and increasing intramembranous ossification. Biochem Biophys Res Commun. 2013;441(4):886–890. doi: 10.1016/j.bbrc.2013.10.155. [DOI] [PMC free article] [PubMed] [Google Scholar]
- 17.Taut AD, Jin Q, Chung JH, Galindo-Moreno P, Yi ES, Sugai JV, Ke HZ, Liu M, Giannobile WV. Sclerostin antibody stimulates bone regeneration after experimental periodontitis. J Bone Miner Res. 2013;28(11):2347–2356. doi: 10.1002/jbmr.1984. [DOI] [PubMed] [Google Scholar]
- 18.Virk MS, Alaee F, Tang H, Ominsky MS, Ke HZ, Lieberman JR. Systemic administration of sclerostin antibody enhances bone repair in a critical-sized femoral defect in a rat model. J Bone Joint Surg Am. 2013;95(8):694–701. doi: 10.2106/JBJS.L.00285. [DOI] [PMC free article] [PubMed] [Google Scholar]
- 19.Williams BO. Insights into the mechanisms of sclerostin action in regulating bone mass accrual. J Bone Miner Res. 2014;29(1):24–28. doi: 10.1002/jbmr.2154. [DOI] [PubMed] [Google Scholar]
- 20.McColm J, Hu L, Womack T, Tang CC, Chiang AY. Single- and multiple-dose randomized studies of blosozumab, a monoclonal antibody against sclerostin, in healthy postmenopausal women. J Bone Miner Res. 2013 doi: 10.1002/jbmr.2092. [DOI] [PubMed] [Google Scholar]
- 21.Cejka D, Herberth J, Branscum AJ, Fardo DW, Monier-Faugere MC, Diarra D, Haas M, Malluche HH. Sclerostin and Dickkopf-1 in renal osteodystrophy. Clin J Am Soc Nephrol. 2011;6(4):877–882. doi: 10.2215/CJN.06550810. [DOI] [PMC free article] [PubMed] [Google Scholar]
- 22.Sabbagh Y, Graciolli FG, O'Brien S, Tang W, dos Reis LM, Ryan S, Phillips L, Boulanger J, Song W, Bracken C, Liu S, Ledbetter S, Dechow P, Canziani ME, Carvalho AB, Jorgetti V, Moyses RM, Schiavi SC. Repression of osteocyte Wnt/beta-catenin signaling is an early event in the progression of renal osteodystrophy. J Bone Miner Res. 2012;27(8):1757–1772. doi: 10.1002/jbmr.1630. [DOI] [PubMed] [Google Scholar]
- 23.Allen MR, Chen NX, Gattone VH, 2nd, Chen X, Carr AJ, LeBlanc P, Brown D, Moe SM. Skeletal effects of zoledronic acid in an animal model of chronic kidney disease. Osteoporos Int. 2013;24(4):1471–1481. doi: 10.1007/s00198-012-2103-x. [DOI] [PMC free article] [PubMed] [Google Scholar]
- 24.Allen MR, Chen NX, Gattone VH, Ii, Moe SM. Adverse Mandibular Bone Effects Associated with Kidney Disease Are Only Partially Corrected with Bisphosphonate and/or Calcium Treatment. Am J Nephrol. 2013;38(6):458–464. doi: 10.1159/000356335. [DOI] [PMC free article] [PubMed] [Google Scholar]
- 25.Moe SM, Chen NX, Seifert MF, Sinders RM, Duan D, Chen X, Liang Y, Radcliff JS, White KE, Gattone VH., 2nd A rat model of chronic kidney disease-mineral bone disorder. Kidney Int. 2009;75(2):176–184. doi: 10.1038/ki.2008.456. [DOI] [PMC free article] [PubMed] [Google Scholar]
- 26.Moe SM, Radcliffe JS, White KE, Gattone VH, 2nd, Seifert MF, Chen X, Aldridge B, Chen NX. The pathophysiology of early-stage chronic kidney disease-mineral bone disorder (CKD-MBD) and response to phosphate binders in the rat. J Bone Miner Res. 2011;26(11):2672–2681. doi: 10.1002/jbmr.485. [DOI] [PubMed] [Google Scholar]
- 27.Moe SM, Chen NX, Newman CL, Gattone VH, 2nd, Organ JM, Chen X, Allen MR. A Comparison of Calcium to Zoledronic Acid for Improvement of Cortical Bone in an Animal Model of CKD. J Bone Miner Res. 2014;29(4):902–910. doi: 10.1002/jbmr.2089. [DOI] [PMC free article] [PubMed] [Google Scholar]
- 28.Moe SM, Seifert MF, Chen NX, Sinders RM, Chen X, Duan D, Henley C, Martin D, Gattone VH., 2nd R-568 reduces ectopic calcification in a rat model of chronic kidney disease-mineral bone disorder (CKD-MBD) Nephrol Dial Transplant. 2009 doi: 10.1093/ndt/gfp078. [DOI] [PubMed] [Google Scholar]
- 29.Bouxsein ML, Boyd SK, Christiansen BA, Guldberg RE, Jepsen KJ, Muller R. Guidelines for assessment of bone microstructure in rodents using micro-computed tomography. J Bone Miner Res. 2010;25(7):1468–1486. doi: 10.1002/jbmr.141. [DOI] [PubMed] [Google Scholar]
- 30.Guo J, Liu M, Yang D, Bouxsein ML, Saito H, Galvin RJ, Kuhstoss SA, Thomas CC, Schipani E, Baron R, Bringhurst FR, Kronenberg HM. Suppression of Wnt signaling by Dkk1 attenuates PTH-mediated stromal cell response and new bone formation. Cell Metab. 2010;11(2):161–171. doi: 10.1016/j.cmet.2009.12.007. [DOI] [PMC free article] [PubMed] [Google Scholar]
- 31.Hirano T, Turner CH, Forwood MR, Johnston CC, Burr DB. Does suppression of bone turnover impair mechanical properties by allowing microdamage accumulation? Bone. 2000;27(1):13–20. doi: 10.1016/s8756-3282(00)00284-2. [DOI] [PubMed] [Google Scholar]
- 32.Allen MR, Burr DB. The pathogenesis of bisphosphonate-related osteonecrosis of the jaw: so many hypotheses, so few data. J Oral Maxillofac Surg. 2009;67(5 Suppl):61–70. doi: 10.1016/j.joms.2009.01.007. [DOI] [PubMed] [Google Scholar]
- 33.Parfitt AM, Drezner MK, Glorieux FH, Kanis JA, Malluche H, Meunier PJ, Ott SM, Recker RR. Bone histomorphometry: standardization of nomenclature, symbols, and units. Report of the ASBMR Histomorphometry Nomenclature Committee. Journal of Bone & Mineral Research. 1987;2(6):595–610. doi: 10.1002/jbmr.5650020617. [DOI] [PubMed] [Google Scholar]
- 34.Chen NX, O'Neill K, Chen X, Kiattisunthorn K, Gattone VH, Moe SM. Transglutaminase 2 accelerates vascular calcification in chronic kidney disease. Am J Nephrol. 2013;37(3):191–198. doi: 10.1159/000347031. [DOI] [PubMed] [Google Scholar]
- 35.Ominsky MS, Li X, Asuncion FJ, Barrero M, Warmington KS, Dwyer D, Stolina M, Geng Z, Grisanti M, Tan HL, Corbin T, McCabe J, Simonet WS, Ke HZ, Kostenuik PJ. RANKL inhibition with osteoprotegerin increases bone strength by improving cortical and trabecular bone architecture in ovariectomized rats. J Bone Miner Res. 2008;23(5):672–682. doi: 10.1359/jbmr.080109. [DOI] [PubMed] [Google Scholar]
- 36.Kostenuik PJ, Capparelli C, Morony S, Adamu S, Shimamoto G, Shen V, Lacey DL, Dunstan CR. OPG and PTH-(1–34) have additive effects on bone density and mechanical strength in osteopenic ovariectomized rats. Endocrinology. 2001;142(10):4295–4304. doi: 10.1210/endo.142.10.8437. [DOI] [PubMed] [Google Scholar]
- 37.Nickolas TL, Stein EM, Dworakowski E, Nishiyama KK, Komandah-Kosseh M, Zhang CA, McMahon DJ, Liu XS, Boutroy S, Cremers S, Shane E. Rapid cortical bone loss in patients with chronic kidney disease. J Bone Miner Res. 2013;28(8):1811–1820. doi: 10.1002/jbmr.1916. [DOI] [PMC free article] [PubMed] [Google Scholar]
- 38.O'Brien CA, Plotkin LI, Galli C, Goellner JJ, Gortazar AR, Allen MR, Robling AG, Bouxsein M, Schipani E, Turner CH, Jilka RL, Weinstein RS, Manolagas SC, Bellido T. Control of bone mass and remodeling by PTH receptor signaling in osteocytes. PLoS One. 2008;3(8):e2942. doi: 10.1371/journal.pone.0002942. [DOI] [PMC free article] [PubMed] [Google Scholar]
- 39.Rhee Y, Lee EY, Lezcano V, Ronda AC, Condon KW, Allen MR, Plotkin LI, Bellido T. Resorption controls bone anabolism driven by parathyroid hormone (PTH) receptor signaling in osteocytes. J Biol Chem. 2013;288(41):29809–29820. doi: 10.1074/jbc.M113.485938. [DOI] [PMC free article] [PubMed] [Google Scholar]
- 40.Li C, Xing Q, Yu B, Xie H, Wang W, Shi C, Crane JL, Cao X, Wan M. Disruption of LRP6 in osteoblasts blunts the bone anabolic activity of PTH. J Bone Miner Res. 2013;28(10):2094–2108. doi: 10.1002/jbmr.1962. [DOI] [PMC free article] [PubMed] [Google Scholar]
- 41.Sawakami K, Robling AG, Ai M, Pitner ND, Liu D, Warden SJ, Li J, Maye P, Rowe DW, Duncan RL, Warman ML, Turner CH. The Wnt co-receptor LRP5 is essential for skeletal mechano transduction but not for the anabolic bone response to parathyroid hormone treatment. J Biol Chem. 2006;281(33):23698–23711. doi: 10.1074/jbc.M601000200. [DOI] [PubMed] [Google Scholar]
- 42.Jilka RL, O'Brien CA, Bartell SM, Weinstein RS, Manolagas SC. Continuous elevation of PTH increases the number of osteoblasts via both osteoclast-dependent and -independent mechanisms. J Bone Miner Res. 2010;25(11):2427–2437. doi: 10.1002/jbmr.145. [DOI] [PMC free article] [PubMed] [Google Scholar]
- 43.Fang Y, Ginsberg C, Seifert M, Agapova O, Sugatani T, Register TC, Freedman BI, Monier-Faugere MC, Malluche H, Hruska KA. CKD-Induced Wingless/Integration1 Inhibitors and Phosphorus Cause the CKD-Mineral and Bone Disorder. J Am Soc Nephrol. 2014 doi: 10.1681/ASN.2013080818. [DOI] [PMC free article] [PubMed] [Google Scholar]
- 44.Pelletier S, Dubourg L, Carlier MC, Hadj-Aissa A, Fouque D. The relation between renal function and serum sclerostin in adult patients with CKD. Clin J Am Soc Nephrol. 2013;8(5):819–823. doi: 10.2215/CJN.07670712. [DOI] [PMC free article] [PubMed] [Google Scholar]
- 45.Cejka D, Marculescu R, Kozakowski N, Plischke M, Reiter T, Gessl A, Haas M. Renal elimination of sclerostin increases with declining kidney function. J Clin Endocrinol Metab. 2014;99(1):248–255. doi: 10.1210/jc.2013-2786. [DOI] [PubMed] [Google Scholar]
- 46.van Lierop AH, Witteveen JE, Hamdy NA, Papapoulos SE. Patients with primary hyperparathyroidism have lower circulating sclerostin levels than euparathyroid controls. Eur J Endocrinol. 2010;163(5):833–837. doi: 10.1530/EJE-10-0699. [DOI] [PubMed] [Google Scholar]
- 47.Ferreira JC, Ferrari GO, Neves KR, Cavallari RT, Dominguez WV, Dos Reis LM, Graciolli FG, Oliveira EC, Liu S, Sabbagh Y, Jorgetti V, Schiavi S, Moyses RM. Effects of dietary phosphate on adynamic bone disease in rats with chronic kidney disease--role of sclerostin? PLoS One. 2013;8(11):e79721. doi: 10.1371/journal.pone.0079721. [DOI] [PMC free article] [PubMed] [Google Scholar]
- 48.Oliveira RB, Cancela AL, Graciolli FG, Dos Reis LM, Draibe SA, Cuppari L, Carvalho AB, Jorgetti V, Canziani ME, Moyses RM. Early control of PTH and FGF23 in normophosphatemic CKD patients: a new target in CKD-MBD therapy? Clin J Am Soc Nephrol. 2010;5(2):286–291. doi: 10.2215/CJN.05420709. [DOI] [PMC free article] [PubMed] [Google Scholar]


