

Abstract
Context:
The optimal screening test for diabetes and prediabetes in obese youth is controversial.
Objective:
We examined whether glycosylated hemoglobin (HbA1c) or the oral glucose tolerance test (OGTT) is a better predictor of free-living glycemia as measured by continuous glucose monitoring (CGM).
Design:
This was a cross-sectional study of youth 10–18 years old, body mass index (BMI) 85th percentile or greater, with diabetes risk factors.
Setting and Participants:
Participants (n = 118) with BMI 85th percentile or greater, not on medications for glucose management, were recruited from primary care and pediatric endocrinology clinics around Denver, Colorado.
Intervention:
HbA1c, fasting plasma glucose, and 2-hour glucose were collected and all participants wore a blinded CGM for 72 hours.
Main Outcome Measures:
CGM outcomes were determined and descriptive statistics calculated. Performance characteristics at current American Diabetes Association cutpoints were compared with CGM outcomes.
Results:
CGM data were successfully collected on 98 obese youth. Those with prediabetes had significantly higher average glucose, area under the curve (AUC), peak glucose, and time greater than 120 and greater than 140 mg/dL (P < .01) on CGM than youth with normal HbA1c or OGTT. HbA1c had a greater magnitude of correlation to CGM average glucose, AUC, and minimum glucose; 2-hour glucose had a greater magnitude of correlation to CGM SD, peak glucose, and time greater than 140 and greater than 200 mg/dL. However, there were no overall differences in the strength comparisons between 2-hour glucose and HbA1c correlations to CGM outcomes.
Conclusions:
In obese youth, HbA1c and 2-hour glucose performed equally well at predicting free-living glycemia on CGM, suggesting that both are valid tests for dysglycemia screening.
Since hemoglobin A1c (HbA1c) was incorporated into the American Diabetes Association (ADA) Clinical Care Guidelines (1, 2) diagnostic criteria for diabetes in 2010, there has been significant controversy over the optimal method of diagnosing pediatric prediabetes and type 2 diabetes (3–6). Studies in adolescents comparing HbA1c to 2-hour glucose and fasting plasma glucose (FPG) have reported poor agreement among the three tests in classifying youth with dysglycemia (3, 7–9). Furthermore, HbA1c has been reported to have low sensitivity for identifying prediabetes and diabetes, as defined by OGTT (5, 7, 10). Despite these controversies, HbA1c is increasingly used by primary care providers as the screening test of choice (4, 11) due to its many advantages, including: convenience of sampling, being a better index of chronic glycemia, its purported low intraindividual variability, and assay standardization.
HbA1c and 2-hour glucose show variability in classification of individuals as having normal glycemia, prediabetes, or diabetes (5, 7, 8). However, whether one test better identifies individuals at risk for long-term diabetes complications is unclear because the OGTT criteria for prediabetes and diabetes have themselves never been validated in the pediatric population. Similarly, HbA1c criteria for diagnoses of prediabetes or diabetes were derived from adult data and these cutpoints may not be applicable in pediatrics. In addition, the way the temporary insulin resistance of puberty (12, 13) affects these criteria is unknown. Therefore, comparison of HbA1c to the OGTT may not be the relevant question given that what is needed is an understanding of how these tests relate to underlying glycemia.
We hypothesized that HbA1c and OGTT outcomes (FPG and 2-hour glucose) identify individuals with different patterns of glycemic abnormality, and that the OGTT misses the presence of chronic postprandial hyperglycemia because obese adolescents frequently consume more than a 75-g carbohydrate load in their home environment. To test these hypotheses, we recruited overweight and obese adolescents with HbA1c ranging across the ADA classification spectrum from normal to diabetes, measured free-living glucose by continuous glucose monitoring (CGM), and assessed the relationships among CGM outcomes, HbA1c, and OGTT results (FPG and 2-h glucose).
Materials and Methods
This was a cross-sectional study enrolling males and females 10–18 years of age with a body mass index (BMI) in the 85th percentile or greater. Participants were recruited from weight management and endocrine clinics at Children's Hospital Colorado, as well as primary care, school-based, and community health clinics in Denver, Colorado. Exclusion criteria included HbA1c greater than 7.5% because these individuals required immediate initiation of glucose-lowering therapy, medications known to affect blood glucose, known anemia, hemoglobinopathy, chronic illness likely to affect red cell life span, and pregnancy. The study was approved by the Colorado Multiple Institutional Review Board (Aurora, Colorado).
Study visit
This was a single visit study. Subjects arrived to the Clinical and Translational Research Center (CTRC) after a minimum 8-hour overnight fast. Fasting was confirmed verbally. Consent was obtained from all participants. BMI was calculated from standing height (cm) and weight (kg). Trained CTRC staff performed blood pressure and waist and hip circumference measurements. Parents reported ethnicity and family history of diabetes in first- or second-degree relatives. A urine pregnancy test was performed on all females of childbearing age. A physical examination including Tanner staging for breast development and pubic hair and testicular volume measurement using a Prader orchidometer was performed by a single pediatric endocrinologist.
A blinded iPro Continuous Glucose Monitor (Medtronic MiniMed, Inc) was inserted. After a calibration period of 1 hour, fasting laboratory results were collected: FPG, lipids, HbA1c, aspartate aminotransferase (AST) and alanine aminotransferase (ALT). HbA1c was run by immunoassay on a DCA Vantage Analyzer (Siemens), a Diabetes Control and Complications Trial-aligned instrument. The subject then consumed 1.75 g/kg glucose, maximum 75 g (Trutol glucose beverage) and had a second venipuncture 2 hours later for plasma glucose measurement.
While awaiting the 2-hour venipuncture, participants were provided instructions on CGM device care and calibration. Participants were instructed to wear the CGM device for a minimum of 72 hours and to not change any of their current dietary or activity habits for the period of CGM wear. They were trained to use a OneTouch (LifeScan) glucometer and collect capillary blood glucose values at least four times daily, prior to meals and at bedtime. Participants were also asked to complete a simple log of their activity, as well as record dietary intake, and sleep and wake times. The iPro and log-sheet were either returned in person or via self-addressed, stamped envelope to the CTRC after a minimum of 72 hours of recording time. Participants were compensated with a gift card upon return of the CGM device, glucometer, and log sheet.
CGM data
Using software accompanying the iPro recorder, sensor readings were converted into excel format for each subject. Each tracing was individually inspected. The iPro manufacturer instructions recommend calibration with at least three glucometer readings in a 24-hour period to generate accurate and complete sensor tracings; days with fewer than three glucometer readings were reviewed and sensor glucose outliers, including prolonged periods of hypoglycemia below CGM detection limits or discontinuous recordings (ie, indications of a failing sensor or problematic insertion site) were excluded. Data gaps of fewer than 20 minutes were replaced by averaging the preceding and subsequent sensor values to generate a minimum of 48 hours of complete data for each subject. Greater periods of missing data were excluded and only tracings with 48 hours of data were included in the final analysis. Thus, each subject included in this report had an identical number of total sensor glucose values (ie, 576) for analysis.
The following CGM variables were calculated: average sensor glucose, peak and minimum sensor glucose, area under the curve (AUC), SD, percent time spent greater than 120 mg/dL, percent time spent at 140 mg/dL or greater, percent time spent at 200 mg/dL or greater, and number of excursions greater than 140 mg/dL and greater than 200 mg/dL. CGM AUC was calculated using the trapezoidal method and refers to total AUC under the CGM curve. Daytime (0600–2400 h) and nighttime (2400–0600 h) glucose distributions were also assessed. Based on analysis of participant logs, night time frames were selected to capture typical hours when participants were asleep and the remaining time analyzed as daytime hours.
Statistical analysis
All variables were assessed for normality. Descriptive statistics for demographic and clinical variables were calculated by category of HbA1c (<5.7%, 5.7–6.4%, >6.4%) and overall. Descriptive statistics for CGM variables were calculated by category of HbA1c and 2-hour glucose (<140 mg/dL, 140–199 mg/dL, ≥200 mg/dL). Because most variables were not normally distributed, the Spearman correlation coefficient was calculated for each combination of CGM variable with HbA1c, FPG, and 2-hour glucose. CGM AUC was calculated with the trapezoidal method. The Hotelling-Williams test was used to compare Pearson correlation coefficients to evaluate whether each CGM variable was most strongly correlated with HbA1c, FPG, or 2-hour glucose. Because the Hotelling-Williams test is sensitive to departures from normality, this procedure was repeated using Wilcox's method, which is more robust, although its power can be low (14).
The ability of HbA1c and 2-hour glucose to predict abnormal CGM AUC was evaluated: First, patients with normal glycemia, defined as normal HbA1c (<5.7%), FPG (<100 mg/dL), and 2-hour glucose (<140 mg/dL) by ADA criteria were selected and mean and SD CGM AUC calculated. These subjects were excluded from this subanalysis. The remaining subjects were classified as having an abnormal CGM AUC if their AUC was greater than the mean + 2 SDs of the normal subjects. Demographic and anthropometric characteristics of the two groups were compared with the Kruskal-Wallis test. Logistic regression models were used to assess the ability of HbA1c, FPG, and 2-hour glucose to predict an abnormal CGM AUC by comparing the area under the receiver operating characteristic (ROC) curves. The cutoff value for HbA1c and 2-hour glucose that maximized sensitivity and specificity for identifying abnormal CGM AUC was determined.
Results
Data were collected from 118 participants. Eight were excluded due to missing FPG, HbA1c, or 2-hour glucose. Another 12 patients were excluded due to incomplete CGM data, leaving 98 participants with 48 hours of CGM data. Demographic and clinical characteristics by HbA1c category are shown in Table 1. Due to the small number of participants with a diabetes-range HbA1c, P-values are reported only for comparisons of normal HbA1c (<5.7%) to prediabetes HbA1c (5.7–6.4%). There were no differences in age, Tanner staging, nor lipids among those with normal or prediabetes HbA1c. FPG and 2-hour glucose, as well as weight, BMI z score, waist circumference, diastolic blood pressure, and ALT were higher in those with abnormal HbA1c.
Table 1.
Demographic and Clinical Characteristics by HbA1c Category
| Characterisic | HbA1c Category |
Total, Median (Min–Max) | ||
|---|---|---|---|---|
| <5.7%, Median (Min–Max) | 5.7–6.4%, Median (Min–Max) | >6.4%, Median (Min–Max) | ||
| n | 51 | 44 | 3 | 98 |
| Age at enrollment, y | 13.9 (10.0–18.0) | 14.3 (10.1–18.0) | 14.1 (10.6–14.4) | 14.1 (10.0–18.0) |
| Male, N (%) | 19 (37.3) | 15 (34.1) | 1 (33.3) | 35 (35.7) |
| Ethnicity, N (%)a | ||||
| Non-Hispanic white | 18 (35.3) | 6 (13.6) | — | 24 (24.5) |
| Black | 4 (7.8) | 7 (15.9) | — | 11 (11.2) |
| Hispanic | 29 (56.9) | 29 (65.9) | 3 (100.0) | 61 (62.2) |
| Other | — | 2 (4.5) | — | 2 (2.0) |
| Family history of diabetes | ||||
| No, N (%) | 13 (25.5) | 6 (13.6) | 0 (0) | 19 (19.4) |
| Yes, N (%) | 37 (72.5) | 38 (86.4) | 3 (100.0) | 78 (79.6) |
| Weight, kga | 80.8 (59.3–171.4) | 91.9 (41.2–167.8) | 111.4 (93.2–141.4) | 87.7 (41.2–171.4) |
| Height, cm | 159.0 (143.6–181.6) | 163.6 (140.0–189.0) | 161.3 (156.0–173.0) | 161.2 (140.0–189.0) |
| BMI, kg/m2 | 31.2 (23.7–55.5) | 34.7 (21.0–52.9) | 42.8 (38.3–47.3) | 32.5 (21.0–55.5) |
| BMI z scorea | 2.2 (1.1–2.9) | 2.3 (1.1–3.0) | 2.8 (2.5–2.9) | 2.3 (1.1–3.0) |
| Waist circumference, cma | 97.6 (80.0–155.0) | 106.0 (39.5–158.9) | 124.0 (108.0–138.0) | 101.0 (39.5–158.9) |
| Hip circumference, cm | 105.5 (85.7–167.5) | 108.7 (77.0–144.0) | 122.0 (121.0–129.0) | 108.2 (77.0–167.5) |
| Waist-to-hip ratio | 0.9 (0.8–1.1) | 1.0 (0.4–1.7) | 1.0 (0.9–1.1) | 0.9 (0.4–1.7) |
| SBP, mm Hg | 120 (95–147) | 122 (107–161) | 129 (115–135) | 120.5 (95–161) |
| SBP percentile | 83.7 (17.4–100.0) | 90.1 (34.3–100.0) | 92.5 (79.1–97.2) | 87.0 (17.4–100.0) |
| DBP, mm Hga | 68 (48–87) | 72 (59–100) | 75 (59–86) | 69.5 (48–100) |
| DBP percentilea | 62.4 (10.2–97.7) | 70.7 (34.4–99.7) | 80.9 (35.1–84.3) | 65.2 (10.2–99.7) |
| Tanner stage, N, % | ||||
| I | 3 (5.9) | 3 (6.8) | 0 (0) | 6 (6.1) |
| II | 8 (15.7) | 3 (6.8) | 0 (0) | 11 (11.2) |
| III | 7 (13.7) | 5 (11.4) | 1 (33.3) | 13 (13.3) |
| IV | 6 (11.8) | 8 (18.2) | 0 (0) | 14 (14.3) |
| V | 27 (52.9) | 25 (56.8) | 2 (66.7) | 54 (55.1) |
| ALT, U/Lb | 25.0 (6.0–69.0) | 40.0 (18.0–182.0) | 51.0 (41.0–76.0) | 30.0 (6.0–182.0) |
| AST, U/L | 35.0 (16.0–113.0) | 39.5 (18.0–85.0) | 89.0 (48.0–116.0) | 38.0 (16.0–116.0) |
| Fasting plasma glucose, mg/dLc | 83 (65–97) | 90.5 (76–110) | 103 (80–130) | 86 (65–130) |
| 2-h OGTT, mg/dLb | 122 (84–176) | 136.5 (93–289) | 249 (223–276) | 131 (84–289) |
| Total cholesterol, mg/dL | 170 (81–276) | 163 (117–292) | 165 (148–175) | 166 (81–292) |
| TG, mg/dL | 122 (31–544) | 148 (48–596) | 223 (195–332) | 137 (31–596) |
| LDL, mg/dL | 96 (25–218) | 100 (57–198) | 99 (83–112) | 99 (25–218) |
| HDL, mg/dL | 37 (25–65) | 37.5 (24–68) | 28 (26–39) | 37 (24–68) |
| Non-HDL, mg/dL | 128 (42–242) | 128 (71–232) | 126 (120–149) | 128 (42–242) |
| TG/HDL | 3.4 (0.7–18.1) | 3.9 (0.8–20.1) | 7.0 (5.7–12.8) | 3.6 (0.7–20.1) |
Abbreviations: ALT, alanine aminotransferase; AST, aspartate aminotransferase; BMI, body mass index; DBP, diastolic blood pressure; HDL, high-density lipoprotein; LDL, low-density lipoprotein; SBP, systolic blood pressure; TG, triglyceride.
Due to the small number of diabetes range A1c subjects, P-values are for A1c <5.7% and 5.7–6.4% categories only. P-values for continuous variables are from the Kruskal-Wallis test. P-values for categorical variables are from the χ2 or Fisher's exact test.
.01 ≤ P ≤ .05.
.0001 ≤ P ≤ .01.
P ≤ .0001.
Median FPGs in normal and prediabetes HbA1c categories were normal (83 mg/dL and 91 mg/dL, respectively). Only nine individuals had elevated FPG of 100 mg/dL or greater, with only one greater than 125 mg/dL; thus, CGM comparisons were not made by FPG category. Thirty-six individuals had FPG of at least 90 mg/dL. Thirty-five youth had 2-hour glucose in the prediabetes range (140–199 mg/dL) and five had 2-hour glucose of 200 mg/dL or greater.
Descriptive statistics for CGM variables are shown by HbA1c and 2-hour glucose categories (Tables 2 and 3). An average of 7.3 ± 0.7 glucometer readings per participant were obtained over 48 hours of CGM wear. The subgroups of obese adolescents with normal HbA1c and with normal 2-hour glucose, spent 17% and 20% of the time greater than 120 mg/dL, respectively. Time spent greater than 140 mg/dL for those with normal HbA1c and those with normal 2-hour glucose, however, were only 1.2% and 1.3%, respectively; similar to that historically reported in normal-weight individuals without diabetes (15). However, whether categorized by HbA1c or 2-hour glucose, there were significant differences between normal glycemic youth and youth with prediabetes for CGM outcomes. When categorized by HbA1c, differences were highly significant (P < .0001) for night average, night peak glucose, and night AUC, but not for CGM SD or excursions above 200 mg/dL. When categorized by 2-hour glucose, differences were highly significant (P < .0001) for percentage of time at 140 mg/dL or greater, but not for night-average glucose, minimum-sensor glucose, and night AUC.
Table 2.
CGM Variables by HbA1c Category and Overall
| CGM Variables and P-Values for HbA1c | HbA1c Category |
Total, Median (Min–Max) | ||
|---|---|---|---|---|
| <5.7%, Median (Min–Max) | 5.7–6.4%, Median (Min–Max) | >6.4%, Median (Min–Max) | ||
| n | 51 | 44 | 3 | 98 |
| Average sensor glucose, mg/dLa | 108 (92–146) | 119 (101–156) | 156 (125–161) | 113 (92–161) |
| Day average sensor glucose, mg/dLa | 108 (92–151) | 118 (100–154) | 177 (128–181) | 115 (92–181) |
| Night average sensor glucose, mg/dLb | 104 (79–149) | 117 (83–172) | 117 (95–123) | 110 (79–172) |
| Peak sensor glucose, mg/dLa | 148 (116–239) | 166 (123–235) | 263 (177–315) | 160 (116–315) |
| Day peak sensor glucose, mg/dLa | 147 (110–236) | 166 (123–235) | 263 (177–315) | 158 (110–315) |
| Night peak sensor glucose, mg/dLb | 127 (104–239) | 153 (112–230) | 220 (135–235) | 140 (104–239) |
| Minimum sensor glucose, mg/dLa | 75 (40–97) | 84 (56–127) | 77 (40–98) | 79 (40–127) |
| Total AUCa | 3.1 × 10⁵ (2.7 × 10⁵–4.2 × 10⁵) | 3.4 × 10⁵ (2.9 × 10⁵–4.5 × 10⁵) | 4.5 × 10⁵ (3.6 × 10⁵–4.6 × 10⁵) | 3.2 × 10⁵ (2.7 × 10⁵–4.6 × 10⁵) |
| Day AUCa | 2.2 × 10⁵ (1.9 × 10⁵–3.1 × 10⁵) | 2.4 × 10⁵ (2.0 × 10⁵–3.1 × 10⁵) | 3.6 × 10⁵ (2.6 × 10⁵–3.7 × 10⁵) | 2.4 × 10⁵ (1.9 × 10⁵–3.7 × 10⁵) |
| Night AUCb | 8.7 × 10⁴ (6.6 × 10⁴–1.3 × 10⁵) | 9.9 × 10⁴ (6.9 × 10⁴–1.4 × 10⁵) | 9.8 × 10⁴ (8.0 × 10⁴–1.0 × 10⁵) | 9.2 × 10⁴ (6.6 × 10⁴–1.4 × 10⁵) |
| SD | 14 (7–32) | 15 (6–35) | 41 (17–69) | 14.5 (6–69) |
| Excursions ≥ 140a | 2 (0–10) | 4 (0–15) | 6 (4–9) | 3 (0–15) |
| Excursions ≥ 200 | 0 (0–2) | 0 (0–4) | 4 (0–4) | 0 (0–4) |
| % time ≥ 120a | 16.8 (0.0–85.2) | 36.9 (0.9–100.0) | 58.7 (51.4–83.2) | 27.6 (0.0–100.0) |
| % time ≥ 140a | 1.2 (0.0–77.3) | 8.3 (0.0–77.1) | 46.2 (16.5–64.2) | 4.9 (0.0–77.3) |
| % time ≥ 200 | 0.0 (0.0–4.5) | 0.0 (0.0–8.0) | 18.9 (0.0–29.0) | 0.0 (0.0–29.0) |
P-values for HbA1c are for <5.7% and 5.7–6.4% categories only. P-values are from the Kruskal-Wallis test.
.0001≤ P ≤ .01.
P ≤ .0001.
Table 3.
CGM Variables by 2-Hour OGTT Category and Overall
| CGM Variables and P-Values for 2-Hour Glucose | 2-Hour Glucose Category |
Total, Median (Min–Max) | ||
|---|---|---|---|---|
| <140 mg/dL, Median (Min–Max) | 140–199 mg/dL, Median (Min–Max) | ≥200 mg/dL, Median (Min–Max) | ||
| n | 58 | 35 | 5 | 98 |
| Average sensor glucose, mg/dLa | 109 (92–143) | 117 (99–156) | 151 (125–161) | 112.5 (92–161) |
| Day average sensor glucose, mg/dLa | 112 (92–147) | 117 (99–154) | 153 (128–181) | 115 (92–181) |
| Night average sensor glucose, mg/dL | 108 (83–137) | 114 (79–172) | 123 (95–148) | 110 (79- 172) |
| Peak sensor glucose, mg/dLb | 148 (116–239) | 177 (126–236) | 235 (177–315) | 160 (116–315) |
| Day peak sensor glucose, mg/dLb | 147 (110–229) | 174 (126–236) | 235 (177–315) | 157.5 (110–315) |
| Night peak sensor glucose, mg/dLb | 132 (104–239) | 153 (112–230) | 192 (135–235) | 139.5 (104–239) |
| Minimum sensor glucose | 78 (40–108) | 79 (40–127) | 89 (40–98) | 79 (40–127) |
| Total AUCa | 3.1 × 10⁵ (2.7 × 10⁵–4.1 × 10⁵) | 3.4 × 10⁵ (2.9 × 10⁵–4.5 × 10⁵) | 4.4 × 10⁵ (3.6 × 10⁵–4.6 × 10⁵) | 3.2 × 10⁵ (2.7 × 10⁵–4.6 × 10⁵) |
| Day AUCa | 2.3 × 10⁵ (1.9 × 10⁵–3.0 × 10⁵) | 2.4 × 10⁵ (2.0 × 10⁵–3.1 × 10⁵) | 3.1 × 10⁵ (2.6 × 10⁵–3.7 × 10⁵) | 2.4 × 10⁵ (1.9 × 10⁵–3.7 × 10⁵) |
| Night AUC | 9.1 × 10⁴ (6.9 × 10⁴–1.2 × 10⁵) | 9.6 × 10⁴ (6.6 × 10⁴–1.4 × 10⁵) | 1.0 × 10⁵ (8.0 × 10⁴–1.2 × 10⁵) | 9.2 × 10⁴ (6.6 × 10⁴–1.4 × 10⁵) |
| SDb | 13 (6–35) | 18 (7–32) | 32 (17–69) | 14.5 (6–69) |
| Excursions ≥ 140b | 1.5 (0.0–12) | 5 (0.0–15) | 5 (4–9) | 3 (0.0–15) |
| Excursions ≥ 200a | 0.0 (0.0–3) | 0.0 (0.0–4) | 4 (0.0–4) | 0.0 (0.0–4) |
| % time ≥ 120a | 19.8 (0.0–78.0) | 35.8 (2.4–100.0) | 67.2 (51.4–83.2) | 27.6 (0.0–100.0) |
| % time ≥ 140c | 1.3 (0.0–44.8) | 11.1 (0.0–77.3) | 51.4 (16.5–64.2) | 4.9 (0.0–77.3) |
| % time ≥ 200a | 0.0 (0.0–4.0) | 0.0 (0.0–8.0) | 7.1 (0.0–29.0) | 0.0 (0.0–29.0) |
P-values for 2-hour OGTT are for <140 mg/dL and 140–199 mg/dL categories only. P-values are from the Kruskal-Wallis test.
.01≤ P ≤ .05.
.0001≤ P ≤ .01.
P ≤ .0001.
The strength of the correlations between HbA1c, 2-hour glucose, and FPG individually with CGM variables are shown in Table 4. Multiple outcomes correlated significantly with all three glycemic measures. The magnitudes of correlation for HbA1c with average-sensor glucose, night-average sensor glucose, minimum-sensor glucose, and AUC were greater than for 2-hour glucose. In contrast, the magnitudes of correlation between 2-hour glucose and peak-sensor glucose, SD, excursions greater than 140 mg/dL and greater than 200 mg/dL, and percentage of time spent greater than 140 mg/dL and greater than 200 mg/dL were greater than for HbA1c.
Table 4.
Spearman Correlation Coefficients for CGM Variables With HbA1c, FPG, and 2-Hour Glucose With P-Values for the Test of Whether r = 0
| HbA1c |
FPG |
2-Hour Glucose |
||||
|---|---|---|---|---|---|---|
| P | P | P | ||||
| Average sensor glucose | 0.50a | <.0001 | 0.30a | .003 | 0.43a | <.0001 |
| Day average sensor glucose | 0.46a | <.0001 | 0.26a | .009 | 0.44a | <.0001 |
| Night average sensor glucose | 0.44a | <.0001 | 0.26a | .009 | 0.32a | .001 |
| Peak sensor glucose | 0.33a | .0008 | 0.17 | .088 | 0.53a | <.0001 |
| Day peak sensor glucose | 0.33a | .0009 | 0.17 | .094 | 0.52a | <.0001 |
| Night peak sensor glucose | 0.48a | <.0001 | 0.32a | .001 | 0.45a | <.0001 |
| Minimum sensor glucose | 0.25a | .0118 | 0.26a | .01 | 0.14 | .176 |
| Total AUC | 0.49a | <.0001 | 0.30a | .003 | 0.43a | <.0001 |
| Day AUC | 0.46a | <.0001 | 0.26a | .01 | 0.43a | <.0001 |
| Night AUC | 0.43a | <.0001 | 0.26a | .009 | 0.32a | .002 |
| SD | 0.25a | .013 | 0.05 | .650 | 0.45a | <.0001 |
| Excursions ≥ 140 | 0.33a | .0008 | 0.13 | .213 | 0.45a | <.0001 |
| Excursions ≥ 200 | 0.19 | .06 | 0.11 | .285 | 0.37a | .0002 |
| % time ≥ 120 | 0.47a | <.0001 | 0.27a | .008 | 0.45a | <.0001 |
| % time ≥ 140 | 0.43a | <.0001 | 0.19 | .058 | 0.56a | <.0001 |
| % time ≥ 200 | 0.18 | .070 | 0.12 | .224 | 0.37a | .0002 |
Spearman Correlation Coefficients, n = 98.
Prob > r under H0: ρ = 0.
Indicates correlation coefficients significantly different from zero.
The Hotelling-Williams test was then used to compare the strength of the correlation between each of the CGM variables and 2-hour glucose, HbA1c, and FPG (Table 5). Two-hour glucose outperformed FPG in predicting peak sensor glucose, CGM SDs, excursions greater than 140 mg/dL and greater than 200 mg/dL, and percentage of time greater than 140 mg/dL. HbA1c outperformed FPG in predicting average day glucose, CGM SD, and excursions greater than 140 mg/dL. The strength of the correlation of HbA1c with average glucose, AUC (P = .05), percentage of time greater than 120 mg/dL (P = .06) and peak sensor glucose (P = .09) was greater than for FPG, but the differences did not reach statistical significance. None of the strength comparisons between 2-hour glucose and HbA1c were significant. In other words, 2-hour glucose did not do a better job than HbA1c in predicting CGM outcomes. The Wilcox method did not find significant differences in strength of correlation of any one test (HbA1c, 2-hour glucose, nor FPG) over another (data not shown).
Table 5.
Comparison of Pearson Correlations Between CGM Variables and 2-Hour Glucose, HbA1c, and FPG With the Hotelling-Williams Test
| 2-Hour Glucose Versus HbA1c |
2-Hour Glucose Versus FPG |
HbA1c Versus FPG |
||||
|---|---|---|---|---|---|---|
| ρ1–ρ2 | P-Value | ρ1–ρ2 | P-Value | ρ1–ρ2 | P-Value | |
| Average sensor glucose | 0.02 | .85 | 0.18 | .07 | 0.17 | .05 |
| Day average sensor glucose | 0.01 | .94 | 0.18 | .07 | 0.17a | .04 |
| Night average sensor glucose | 0.03 | .76 | 0.13 | .24 | 0.10 | .28 |
| Peak sensor glucose | 0.13 | .10 | 0.29 | .0036 | 0.16 | .09 |
| Day peak sensor glucose | 0.14 | .08 | 0.31 | .002 | 0.17 | .07 |
| Night peak sensor glucose | −0.01 | .94 | 0.11 | .26 | 0.12 | .17 |
| Minimum sensor glucose | 0.03 | .77 | −0.06 | .59 | −0.09 | .36 |
| Total AUC | 0.01 | .87 | 0.18 | .07 | 0.17 | .05 |
| Day AUC | 0.004 | .96 | 0.18 | .07 | 0.17a | .04 |
| Night AUC | 0.03 | .75 | 0.13 | .24 | 0.10 | .29 |
| SD | 0.05 | .51 | 0.28a | .0063 | 0.23a | .01 |
| Excursions ≥ 140 | 0.03 | .72 | 0.24a | .03 | 0.21a | .03 |
| Excursions ≥ 200 | 0.08 | .37 | 0.21a | .049 | 0.13 | .17 |
| % time ≥ 120 | 0.01 | .91 | 0.18 | .09 | 0.17 | .06 |
| % time ≥ 140 | 0.13 | .12 | 0.28a | .0055 | 0.15 | .10 |
| % time ≥ 200 | −0.05 | .54 | 0.08 | .42 | 0.13 | .12 |
ρ1–ρ2 is an estimate of the difference between the correlations, with a positive value indicating that the first variable is more strongly correlated with the CGM variable than the second.
Correlation differences significantly different from zero.
Thirty-five subjects had normal HbA1c, FPG, and 2-hour glucose by ADA criteria and were used to define a normal CGM AUC. Demographic and anthropometric characteristics were compared between this group and the remaining participants (age, sex, race, BMI percentile, waist and hip circumference, family history of diabetes, and Tanner staging) and, with the exception of waist circumference (94.5 cm vs 106 cm, P = .04), the two groups were similar. Logistic regression models were used to assess the ability of HbA1c, FPG, and 2-hour glucose to predict an abnormal CGM AUC by comparing ROC curves in the remaining (dysglycemic) patients. Figure 1 compares ROC curves for individuals with abnormal CGM AUC as the outcome and HbA1c, FPG, and 2-hour glucose as predictors. Two-hour glucose had the highest area under the ROC curve at 0.78, although there was no statistically significant difference between 2-hour glucose and the other variables for predicting abnormal CGM AUC. A cutoff of 153 mg/dL maximized sensitivity (69%) and specificity (79%) for 2-hour glucose in predicting abnormal CGM AUC. A cutoff of 5.9% for HbA1c maximized sensitivity (80%) and specificity (64%) for predicting abnormal CGM AUC. A FPG cutoff of 92 mg/dL maximized sensitivity (80%) and specificity (50%) for predicting abnormal CGM AUC.
Figure 1.
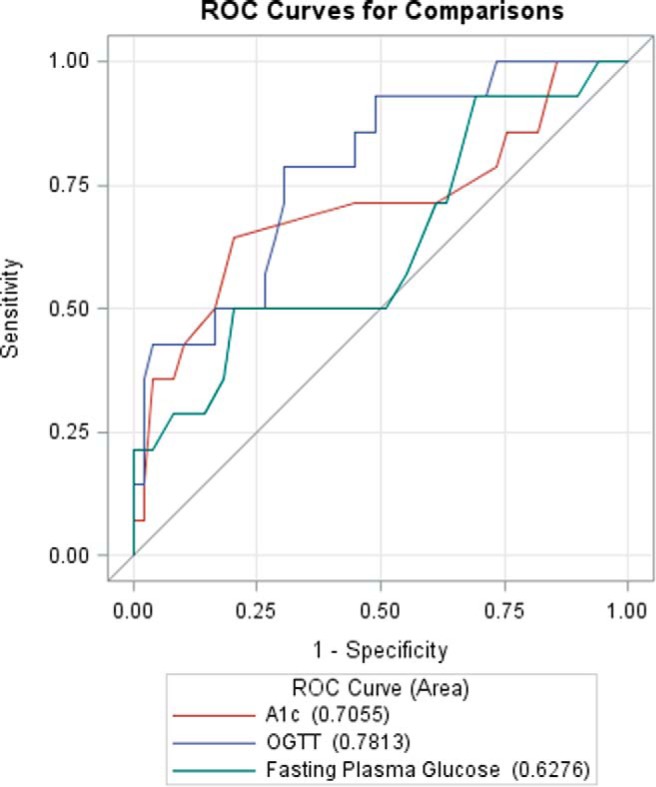
Comparison of ROC curves, with HbA1c, 2-hour glucose, and FPG as predictors, and abnormal CGM AUC (see methods for definition) as the outcome.
Conclusions
This is the first study of continuous glucose patterns in free-living overweight and obese adolescents across a spectrum of glycemic states, from normal, to prediabetes, to diabetes. These results confirm that obese youth in their free-living environments frequently have elevated glucoses, as measured by CGM. Furthermore, these data demonstrate that obese youth, despite normal HbA1c, FPG, and 2-hour glucose, have higher glucose distributions than historically reported in normal-weight, healthy individuals. A report from the Juvenile Diabetes Research Foundation (JDRF) on variations in CGM glucose measurements provides norms for expected glucose distributions in healthy individuals without diabetes ages 8–75 years (15). In this JDRF study, those with the greatest amount of time spent greater than 120 mg/dL (8.2%) and greater than 140 mg/dL (1.3%) were the 8–15-year-old participants, whereas the average time spent greater than 120 mg/dL and greater than 140 mg/dL for all individuals in the study was 5.6% and 0.4%, respectively. In our cohort of obese youth, those with normal glycemia by traditional screening measures spent twice as much time in the high normal range, 15.6% (>120 mg/dL but <140 mg/dL), compared with historical normal-weight counterparts. There were also significant differences between obese youth with and without prediabetes whether classified by HbA1c or 2-hour glucose, in almost all CGM variables. As expected, the few individuals with HbA1c and 2-hour glucose in the diabetes range had the highest sensor glucose peaks and averages, AUC, and time spent greater than 140 mg/dL and greater than 200 mg/dL.
Contrary to our initial hypothesis, HbA1c did not outperform 2-hour glucose in predicting peak glucoses nor time spent above normal range. However, neither did 2-hour glucose universally outperform HbA1c at predicting abnormal glucose outcomes. Rather, important patterns in the correlation of 2-hour glucose and HbA1c to CGM outcomes emerged, with HbA1c correlating more highly to measures of average and overnight glucose, whereas 2-hour glucose correlated more highly to peak glucose and variability. These findings align with our understanding of what these tests reflect: HbA1c is a measure of average glycemia whereas 2-hour glucose reflects response to a glucose challenge.
Although there were no significant differences between 2-hour glucose and HbA1c in predicting CGM outcomes, both measures outperformed FPG in predicting several CGM outcomes. This implies that FPG has little added value to HbA1c or 2-hour glucose in determining abnormal glycemia under free-living circumstances. Of note, the optimal FPG cutoff generated from ROC analysis for predicting abnormal glycemia was 92 mg/dL. These data suggest that the 100 mg/dL upper limit for normal FPG recommended for adults may be too high for youth. In our population, the optimal HbA1c cutpoint was 5.9% for predicting abnormal glycemia as defined by CGM AUC. In adults, different HbA1c cutpoints, along a continuum from 5.4–6%, have been proposed for defining the lower limit of prediabetes based on retinopathy prevalence in studies of Pima Indians, Egyptians, and National Health and Nutrition Examination Survey III populations (1). Large studies of Korean, Chinese, and Arab adult populations have compared HbA1c to OGTT outcomes generating a range of optimal HbA1c cutpoints for predicting prediabetes and diabetes by OGTT (16–18). Because natural history studies of diabetes complications in untreated pediatric populations are unavailable, CGM provides an alternative method of assessing direct glucose measurements in youth, and these data support the adequacy of current available screening methods.
Several pediatric studies have assessed ADA HbA1c cutpoints for predicting diabetes or prediabetes against the gold-standard OGTT (5, 7) and concluded that HbA1c is a poor predictor of prediabetes and type 2 diabetes in youth. However, all these studies make the assumption that 2-hour glucose and HbA1c should be considered interchangeable, rather than tests potentially reflecting different measures of glycemia. Instead, our data demonstrate that, despite the failure to identify one or the other test to be a stronger predictor of abnormal free-living glycemia, there are important and potentially clinically relevant differences in the pattern of relationships between HbA1c and 2-hour glucose with CGM outcomes. Larger studies will be needed to confirm these findings. It is also important to remember that attempts to compare the performance of any one test to another are inherently flawed. Arbitrarily defining one test as a gold standard renders all comparators by definition inferior (19). Rather than debate the sensitivity of one test for predicting another, a strength of our study is that we used CGM technology to uncover the underlying meaning of each test in predicting free-living glucose patterns in obese youth.
Limitations of this study include the small sample size of individuals with diabetes by ADA criteria. A larger sample of individuals with higher HbA1c would have allowed further observations of CGM trends between individuals with prediabetes vs diabetes. The population studied is largely Hispanic and female and the relevance of these findings to the population in general must be confirmed in additional studies. Ethnic differences were also present between HbA1c categories, and whether these differences led to the observed CGM outcomes deserves further study. A limited number of CGM variables were included in this report; although multiple additional computed measures have been proposed in the dynamically evolving analytical field of CGM analysis, they do not seem to offer a particular advantage (20, 21) and therefore we limited the number of comparisons performed to minimize the chance of type 1 error. In addition, although we emphasized the importance of maintaining a routine diet while wearing CGM, we could not account for bias from study participation that may have resulted in intake of fewer carbohydrates or calories during the period of CGM wear. Some participants may also have received nutritional counseling from a primary provider after an abnormal HbA1c result that led to the referral to our clinic. However, glucose measures were still considerably higher than those reported in a normal weight adolescent population, as described above. In addition, we were not able to assess detailed macronutrient or caloric intake nor follow participants longitudinally to determine the best predictors of long-term diabetes complications.
These findings have implications for population screening. The debate over which test—HbA1c, fasting glucose or 2-hour glucose—is the better test for predicting prediabetes and diabetes in youth ultimately requires decades of longitudinal followup to determine which test is more predictive of micro- and macrovascular complications. Until these long-term outcomes become available, prediabetes and diabetes can be defined alternately as states of progressive dysglycemia, as reported in this study, or by pathophysiologic abnormalities associated with hyperglycemia such as declining β cell function and insulin sensitivity (22–24). To our knowledge, this is the first study to characterize glycemia in obese youth across the spectrum from the nondiabetic through diabetic range with broader measures of free-living glucose. Despite high rates of childhood obesity (25), the overall prevalence of type 2 diabetes in the adolescent population is low (26) and, therefore, it is not reasonable for primary care providers to screen every overweight child with HbA1c, fasting, and stimulated measures. However, type 2 diabetes and natural history studies in youth have demonstrated that progression of disease in this younger population can occur at a more accelerated pace than that seen in adults (27, 28), so clinical judgment must be employed in deciding which tests, and at what frequencies, should be performed in individuals with multiple risk factors. For convenience of screening and to limit costs, our data suggest an initial HbA1c may be appropriate. Fasting glucose seems to have little added value for detecting abnormal glycemia. By eliminating the need for fasting tests, as already suggested for lipid screening in children (29), first-line screening with HbA1c reduces the burden of diabetes screening on primary care providers. We then recommend close followup of abnormal results with more frequent HbA1c sampling and consideration of OGTT in those with prediabetes HbA1c and progressive weight gain despite lifestyle intervention. Given the poor concordance rates among the three tests, this strategy takes advantage of the strengths of each test and, therefore, casts the widest net for diagnosing type 2 diabetes in higher-risk youth.
In conclusion, in this cohort of obese adolescents, HbA1c and 2-hour glucose out-performed FPG but were equally valid at predicting CGM outcomes. The differences in magnitude of correlation between 2-hour glucose and HbA1c with various CGM outcomes reveal that each test identifies different types of dysglycemic patterns and, thus, potentially different underlying pathologic mechanisms for progression to type 2 diabetes. However, a larger sample size and longer periods of CGM wear may be needed to detect significant differences between the two tests. Future studies are also needed to determine whether type of dysglycemia (HbA1c, fasting glucose, 2-hour glucose, or a combination) may guide patient-specific treatments. Given the known discordance between the tests in categorizing prediabetes or diabetes, these results imply that judiciously combining HbA1c and plasma glucose measures may be optimal for diabetes screening in youth.
Acknowledgments
This research was supported by National Institutes of Health (NIH) Grants DK094712, TR000154 (CCTSI), UL1 TR001082 (REDCap), and Genentech Fellowship Training Grant No. 1210-F05. Research reported in this publication was supported by the National Institute of Diabetes And Digestive And Kidney Diseases of the NIH. Continuous glucose monitors and sensors were provided via a device grant from Medtronic MiniMed (Northridge, CA).
The content is solely the responsibility of the authors and does not necessarily represent the official views of the National Institutes of Health. Medtronic MiniMed and Genentech had no involvement in the design, conduct, or analysis of the trial nor the manuscript preparation.
Disclosure Summary: The authors have nothing to disclose.
Footnotes
- ADA
- American Diabetes Association
- ALT
- alanine aminotransferase
- AST
- aspartate aminotransferase
- AUC
- area under the curve
- BMI
- body mass index
- CGM
- continuous glucose monitoring
- CTRC
- Clinical and Translational Research Center
- FPG
- fasting plasma glucose
- HbA1c
- glycosylated hemoglobin
- JDRF
- Juvenile Diabetes Research Foundation
- OGTT
- oral glucose tolerance test
- ROC
- receiver operating characteristic.
References
- 1. International Expert C. International Expert Committee report on the role of the A1C assay in the diagnosis of diabetes. Diabetes Care. 2009;32(7):1327–1334. [DOI] [PMC free article] [PubMed] [Google Scholar]
- 2. Share JB. Standards of medical care in diabetes—2011. Diabetes Care. 2011;34 Suppl 1:S11–S61. [DOI] [PMC free article] [PubMed] [Google Scholar]
- 3. Lippi G, Targher G. A laboratory standpoint on the role of hemoglobin A1c for the diagnosis of diabetes in childhood: More doubts than certainties? Pediatr Diabetes. 2011;12(3 Pt 1):183–186. [DOI] [PubMed] [Google Scholar]
- 4. Lee JM, Eason A, Nelson C, Kazzi NG, Cowan AE, Tarini BA. Screening Practices for Identifying Type 2 Diabetes in Adolescents. J Adolesc Health. 2014;54(2):139–143. [DOI] [PMC free article] [PubMed] [Google Scholar]
- 5. Lee JM, Wu EL, Tarini B, Herman WH, Yoon E. Diagnosis of diabetes using hemoglobin A1c: Should recommendations in adults be extrapolated to adolescents? J Pediatr. 2011;158(6):947–952.e941–943. [DOI] [PMC free article] [PubMed] [Google Scholar]
- 6. Kapadia CR. Are the ADA hemoglobin A(1c) criteria relevant for the diagnosis of type 2 diabetes in youth? Curr Diab Rep. 2013;13(1):51–55. [DOI] [PubMed] [Google Scholar]
- 7. Nowicka P, Santoro N, Liu H, et al. Utility of hemoglobin A(1c) for diagnosing prediabetes and diabetes in obese children and adolescents. Diabetes Care. 2011;34(6):1306–1311. [DOI] [PMC free article] [PubMed] [Google Scholar]
- 8. Chan CL, McFann K, Newnes L, Nadeau KJ, Zeitler PS, Kelsey M. Hemoglobin A1c assay variations and implications for diabetes screening in obese youth. Pediatr Diabetes. 2014;15(8):557–563. [DOI] [PMC free article] [PubMed] [Google Scholar]
- 9. Cowie CC, Rust KF, Byrd-Holt DD, et al. Prevalence of diabetes and high risk for diabetes using A1C criteria in the U.S. population in 1988–2006. Diabetes Care. 2010;33(3):562–568. [DOI] [PMC free article] [PubMed] [Google Scholar]
- 10. Olson DE, Rhee MK, Herrick K, Ziemer DC, Twombly JG, Phillips LS. Screening for diabetes and pre-diabetes with proposed A1C-based diagnostic criteria. Diabetes Care. 2010;33(10):2184–2189. [DOI] [PMC free article] [PubMed] [Google Scholar]
- 11. Love-Osborne KA, Sheeder J, Svircev A, Chan C, Zeitler P, Nadeau KJ. Use of glycosylated hemoglobin increases diabetes screening for at-risk adolescents in primary care settings. Pediatr Diabetes. 2013;14(7):512–518. [DOI] [PubMed] [Google Scholar]
- 12. Moran A, Jacobs DR, Jr, Steinberger J, et al. Insulin resistance during puberty: Results from clamp studies in 357 children. Diabetes. 1999;48(10):2039–2044. [DOI] [PubMed] [Google Scholar]
- 13. Travers SH, Jeffers BW, Bloch CA, Hill JO, Eckel RH. Gender and Tanner stage differences in body composition and insulin sensitivity in early pubertal children. J Clin Endocrinol Metab. 1995;80(1):172–178. [DOI] [PubMed] [Google Scholar]
- 14. Wilcox RR. Comparing Pearson correlations: Dealing with heteroscedasticity and nonormality. Commun Stat Simul Comput. 2009;38:10, 2220–2234. [Google Scholar]
- 15. Fox LA, Beck RW, Xing D. Variation of interstitial glucose measurements assessed by continuous glucose monitors in healthy, nondiabetic individuals. Diabetes Care. 2010;33(6):1297–1299. [DOI] [PMC free article] [PubMed] [Google Scholar]
- 16. Lee H, Oh JY, Sung YA, et al. Optimal hemoglobin A1C Cutoff Value for Diagnosing type 2 diabetes mellitus in Korean adults. Diabetes research and clinical practice. 2013;99(2):231–236. [DOI] [PubMed] [Google Scholar]
- 17. Pinelli NR, Jantz AS, Martin ET, Jaber LA. Sensitivity and specificity of glycated hemoglobin as a diagnostic test for diabetes and prediabetes in Arabs. J Clin Endocrinol Metab. 2011;96(10):E1680–E1683. [DOI] [PubMed] [Google Scholar]
- 18. Wu S, Yi F, Zhou C, Zhang M, Zhu Y, Tuniyazi Y, Huang L, Huang X, Wang F, Bi Y, Ning G. HbA1c and the diagnosis of diabetes and prediabetes in a middle-aged and elderly Han population from northwest China (HbA1c). J Diabetes. 2013;5(3):282–290. [DOI] [PubMed] [Google Scholar]
- 19. Buse JB. Screening for diabetes and prediabetes with proposed A1C-based diagnostic criteria: Comment on Olson et al. Diabetes Care. 2010;33(12):e174; author reply e175. [DOI] [PubMed] [Google Scholar]
- 20. Siegelaar SE, Holleman F, Hoekstra JB, DeVries JH. Glucose variability; does it matter? Endocr Rev. 2010;31(2):171–182. [DOI] [PubMed] [Google Scholar]
- 21. Rodbard D. Interpretation of continuous glucose monitoring data: Glycemic variability and quality of glycemic control. Diabetes Technol Ther. 2009;11(Suppl 1):S55–S67. [DOI] [PubMed] [Google Scholar]
- 22. Burns SF, Bacha F, Lee SJ, Tfayli H, Gungor N, Arslanian SA. Declining β-cell function relative to insulin sensitivity with escalating OGTT 2-h glucose concentrations in the nondiabetic through the diabetic range in overweight youth. Diabetes Care. 2011;34(9):2033–2040. [DOI] [PMC free article] [PubMed] [Google Scholar]
- 23. Sjaarda LA, Michaliszyn SF, Lee S, et al. HbA(1c) diagnostic categories and β-cell function relative to insulin sensitivity in overweight/obese adolescents. Diabetes Care. 2012;35(12):2559–2563. [DOI] [PMC free article] [PubMed] [Google Scholar]
- 24. O'Malley G, Santoro N, Northrup V, et al. High normal fasting glucose level in obese youth: a marker for insulin resistance and beta cell dysregulation. Diabetologia. 2010;53(6):1199–1209. [DOI] [PubMed] [Google Scholar]
- 25. Ogden CL, Carroll MD, Kit BK, Flegal KM. Prevalence of childhood and adult obesity in the United States, 2011–2012. JAMA. 2014;311(8):806–814. [DOI] [PMC free article] [PubMed] [Google Scholar]
- 26. Dabelea D, Mayer-Davis EJ, Saydah S, et al. Prevalence of type 1 and type 2 diabetes among children and adolescents from 2001 to 2009. JAMA. 2014;311(17):1778–1786. [DOI] [PMC free article] [PubMed] [Google Scholar]
- 27. Zeitler P, Hirst K, Pyle L, et al. A clinical trial to maintain glycemic control in youth with type 2 diabetes. N Engl J Med. 2012;366(24):2247–2256. [DOI] [PMC free article] [PubMed] [Google Scholar]
- 28. D'Adamo E, Caprio S. Type 2 diabetes in youth: Epidemiology and pathophysiology. Diabetes Care. 2011;34(Suppl 2):S161–S165. [DOI] [PMC free article] [PubMed] [Google Scholar]
- 29. Steiner MJ, Skinner AC, Perrin EM. Fasting might not be necessary before lipid screening: a nationally representative cross-sectional study. Pediatrics. 2011;128(3):463–470. [DOI] [PMC free article] [PubMed] [Google Scholar]