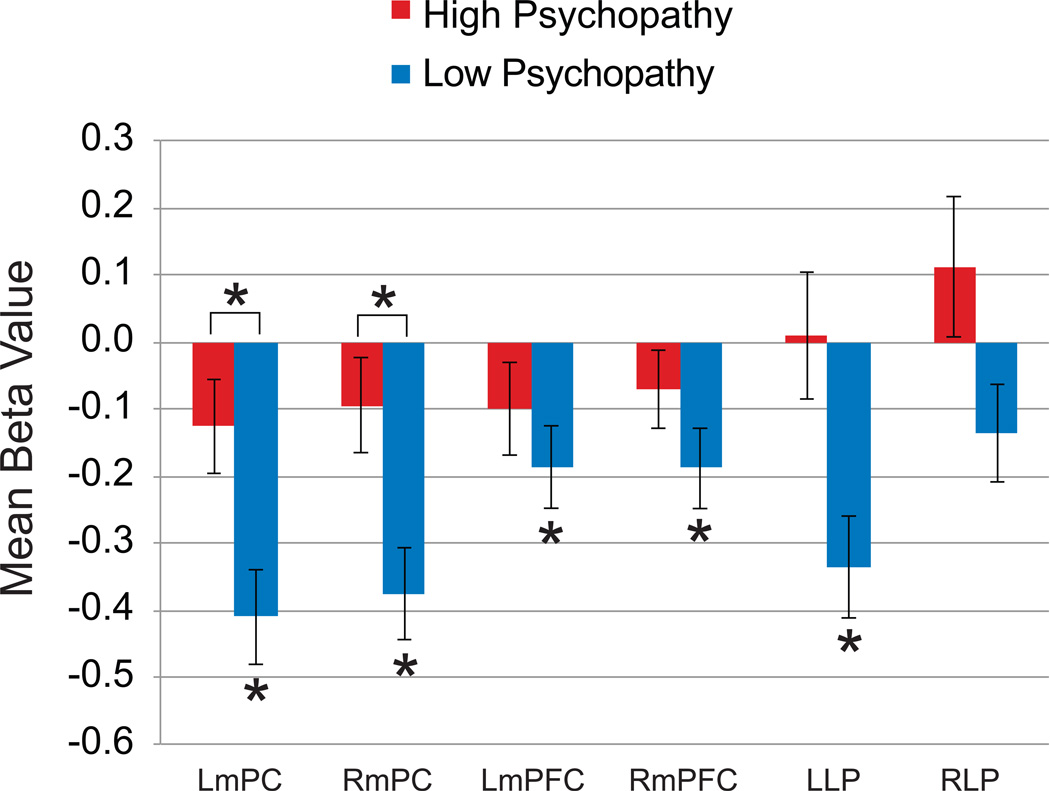
Figure 2. Default Mode Network (DMN) Region-of-Interest Analysis.
The bar graph depicts mean beta values for the High Psychopathy and Low Psychopathy groups for each region of interest in the Task vs. Baseline contrast. The Low Psychopathy group showed typical deactivations beneath baseline, while the High Psychopathy group did not deactivate in any of the six DMN sub-regions. When directly comparing mean activity differences between the High Psychopathy and Low Psychopathy groups, the attenuated deactivation pattern was most pronounced in the left and right posteromedial regions of the DMN. Error bars represent standard errors of the means. *p < .05, Bonferroni corrected. RmPC = right posteromedial cortex; LmPC = left posteromedial cortex; RmPFC = right medial prefrontal cortex; LmPFC = left medial prefrontal cortex; RLP = right lateral parietal; LLP = left lateral parietal.

