Abstract
High-grade serous ovarian cancer (HGS-OvCA) is an aggressive form of epithelial ovarian cancer (EOC), and accounts for the majority of deaths due to EOC. The critical cellular processes and underlying molecular mechanisms that define this malignancy remain poorly understood. Using a syngeneic murine model, we investigated the changes that accompanied the progression to increased aggressiveness induced by in vivo passage of mouse EOC cells. We found that enhanced anoikis resistance was a key cellular process associated with greater aggressiveness and tumorigenicity in vivo. Biochemical studies revealed that the enhanced anoikis resistance was associated with the activation of the Src/Akt/Erk signaling pathway. A higher rate of metabolism and autophagy were also associated with increased anoikis resistance. Blocking these pathways with specific inhibitors and/or genetic modifications significantly increased anoikis in vitro and inhibited tumor development in vivo. In addition, we demonstrated that similar signaling pathways were also involved in a human EOC cell line model. Collectively, our data suggest that anoikis resistance represents a critical and a distinguishing feature underlying the aggressiveness of ovarian cancer cells.
Keywords: Ovarian cancer, anoikis resistance, Src/Akt/Erk, autophagy, metabolism
Introduction
Epithelial ovarian cancer (EOC) is the most deadly gynecologic disease. Over 70% of patients with EOC are diagnosed at advanced stages, characterized by massive ascites containing large numbers of tumor cells. These suspended tumor cells are shed from primary ovarian tumors and then attach and invade the mesothelium of the peritoneal wall and other organs, forming secondary lesions throughout the peritoneal cavity. At this stage the disease is very difficult to treat, and only temporary remission can be achieved with chemotherapy. Patients commonly die of abdominal metastases; extra-abdominal metastasis is rare, a fact which reflects the unique behavior of EOC cells.
The gene signatures and main signaling pathways involved in EOC have been extensively investigated via high-throughput and integrated studies (1). However, identification of the oncogenic driver genes of EOC requires function-directed approaches. To search for relevant driver genes, we sought to examine the change in aggressiveness that results from in vivo passage of mouse EOC cells in a syngeneic mouse model. Compared to using human EOC cell lines in a xenograft model, this approach offered an immune-competent microenvironment-to yield more pathologically relevant findings.
The ID8 cell line was obtained through spontaneous transformation of normal ovarian surface epithelial cells from C57BL6 mice by repetitive passage in vitro. In vivo, intraperitoneally (i.p.)-injected ID8 cells produce tumors very similar to human HGS-OvCA, with similar oncogenic signaling pathways. Importantly, ID8 cells produce tumors in immune-intact mice, which allows the study of the tumor microenvironment and tumor-host interactions. The i.p.-injected ID8 cells preferentially metastasize to diaphragm, peritoneal wall, mesentery, and omentum (2–4).
We observed that daughter cells lines established from these tumors display increased aggressiveness upon re-injection into naïve mice, as defined by the time to onset of tumor/ascites formation and morbidity in the mouse model. To identify the cellular processes that are critically involved in the increased aggressiveness observed in our model, we conducted function-directed cellular and biological analyses in vivo and in vitro. We compared the behavior and characteristics of the parent and daughter cell lines and then focused on the signaling pathways controlling the differences in cell functions to understand the molecular mechanisms underlying the increased aggressiveness of the daughter cells.
Results
In vivo passage of ID-8 cells resulted in greatly increased aggressiveness
Following i.p. injection of ID8-luc (ID8 cells expressing luciferase, termed ID8-P0) cells into C57BL6 mice, tumors and ascites developed in ~90 days. Tumor cells isolated from tumor nodules on the diaphragm (DP), peritoneal wall (PW), mesentery (MS), omentum (OM), liver (LV), kidney (KD), and floating cells in ascites were cultured in vitro. Their tumorigenic capacities were tested. All of these P1 cell lines displayed dramatically enhanced tumorigenic/metastatic potency. Time to tumor/ascites formation was reduced from 90 days to 22–45 days. In addition, the P1 cells obtained from different organs did not show significant differences in organ specificity. Regardless of where P1 cells were collected, they had similar preference to omentum when they were re-injected. Thus, we used PW-P1 (ID8-P1) cells as representative P1 cells for the most of the functional studies conducted in this work.
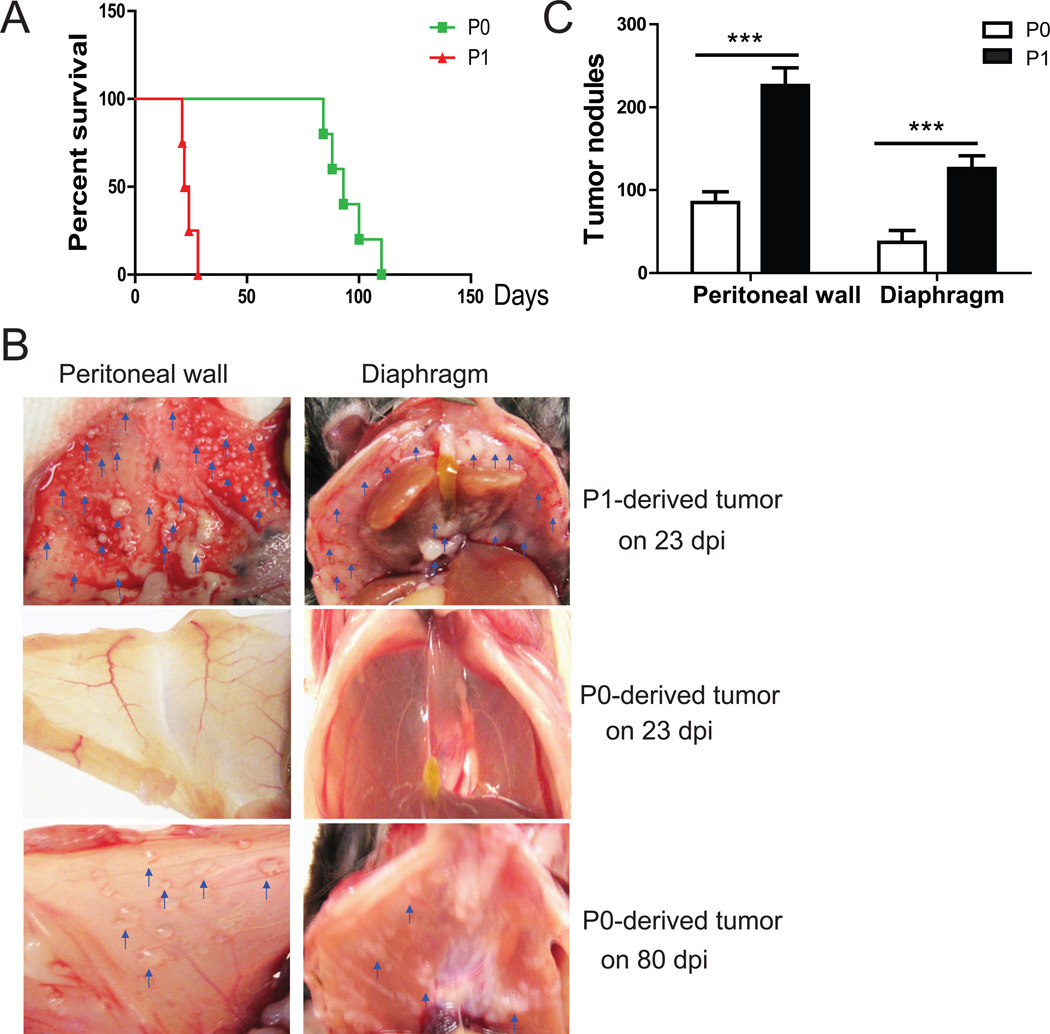
The mouse morbidity times were also changed: seven of 10 mice injected with ID8-P1 cells died at 21–24 days post injection, and all died by 28 days, while mice injected with ID8-P0 cells died between 80–110 days post injection (Fig. 1A). The number of tumor metastases on peritoneal organs increased dramatically in mice injected with ID8-P1 as compared with ID8-P0 cells (Fig. 1B, 1C). Thus, the ID8-P1 cell line represents a model of greatly increased aggressiveness, as compared with ID8-P0.
Figure 1. ID8-P1 cells were more aggressive than ID8-P0 cells in vivo.
A. Kaplan-Meier survival curves of mice i.p. injected with ID8-P0 or ID8-P1 cells (n=10 per group). B. Representative images of tumors on the peritoneal wall and diaphragm of the mice injected with ID8-P0 or ID8-P1 cells on the indicated days post-injection (dpi). C. The average numbers of tumor nodules on the peritoneal wall and diaphragm in mice injected with ID8-P0 or ID8-P1 cells. *** P<0.001.
ID8-P1 cells exhibited enhanced anoikis resistance in vivo
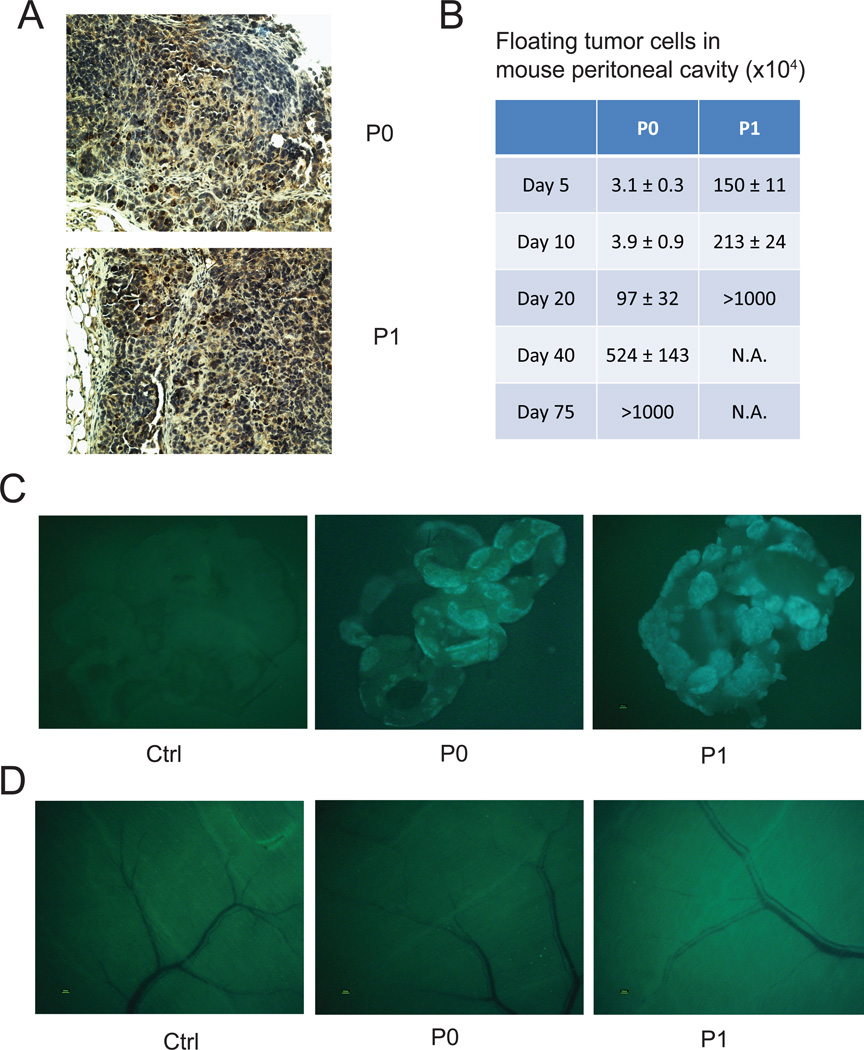
To determine the differences between ID8-P0 and ID8-P1 tumors, we first did immunohistochemical (IHC) analyses on tumor sections. There were no significant differences in the expression of Ki67 (a cell proliferation marker, Fig. 2A), CD31 (vessel formation), or F4/80 (macrophage infiltration) staining between ID8-P0 andID8-P1 tumors (data not shown), suggesting that ID8-P1 cells did not gain increased proliferative or angiogenic abilities once the solid tumors were formed.
Figure 2. ID8-P1 cells survived longer than ID8-P0 cells in the mouse peritoneal cavity.
5×10⁶ ID8-P0 or ID8-P1 cells were i.p. injected into C57BL6 mice. At designated time points after injection, mice were sacrificed. A. Representative images of Ki67 staining of ID8-P0 and ID8-P1 tumors. B. Fluorescent tumor cells in peritoneal washes were counted (n=3 per time point per group). C. Fluorescent tumor cells that attached to peritoneal organs were detected (n=3 per time point per group). Representative images of tumor metastases on omentum of the mice 5 days after injection. D. Representative images of tumor metastasis on the peritoneal wall of the mice 5 days after injection.
We postulated that the potently increased aggressiveness of ID8-P1 cells was related to early stage tumor cells survival and/or the ability of migration and invasion in the peritoneal cavity. To test these hypotheses, we first counted and compared living tumor cells (expressing GFP) by collecting peritoneal washings on selected days post-i.p. injection (n≥3 mice per time point). As shown in Fig. 2B, there were approximately 50-fold more surviving ID8-P1 cells than ID8-P0 cells on days 5 and 10. The recovered living cells on day 5 were 30% of the number of ID8-P1 cells injected (GFP-positive cells; ~1.5×10⁶), compared to only about 0.6% (~3×10⁴) of the injected ID8-P0 cell number at the same time point. The mice injected with ID8-P1 cells succumbed around 24 days post injection. In the mice injected with ID8-P0 cells, the number of peritoneal tumor cells increased from day 5 to day 75, when solid tumors and/or ascites become evident. These data suggest that the ID8-P1 cells have acquired an enhanced ability to resist anoikis after in vivo passage and that floating cell survival in peritoneal cavity after i.p. injection, which mimics early stage tumor cell dissemination of EOC, is critical for aggressiveness of tumor progression.
To compare the ability to attach and invade peritoneal organ sites, we examined tumor metastases on omentum, diaphragm, peritoneal wall, liver, kidney, intestine, and adipose tissue for GFP fluorescence under a dissecting microscope. We found that the omentum was the favored tissue for metastasis for both ID8-P0 and ID8-P1 cells. The omentum showed GFP fluorescence (derived from tumor cells) above background at 1 day post injection, when there was no detectable fluorescence in other organs (Fig.2C and 2D and data not shown). However, the attachment and/or invasion of tumor cells to omentum were not significantly different between ID8-P0 and ID8-P1 cells in the first 10 days post injection, suggesting that ID8-P1 cells did not acquire stronger cell adhesion and/or invasion ability at an early stage, and that the higher number of surviving floating tumor cells are likely to account for the early onset of solid tumor development.
ID8-P1 cells were more resistant to anoikis in vitro
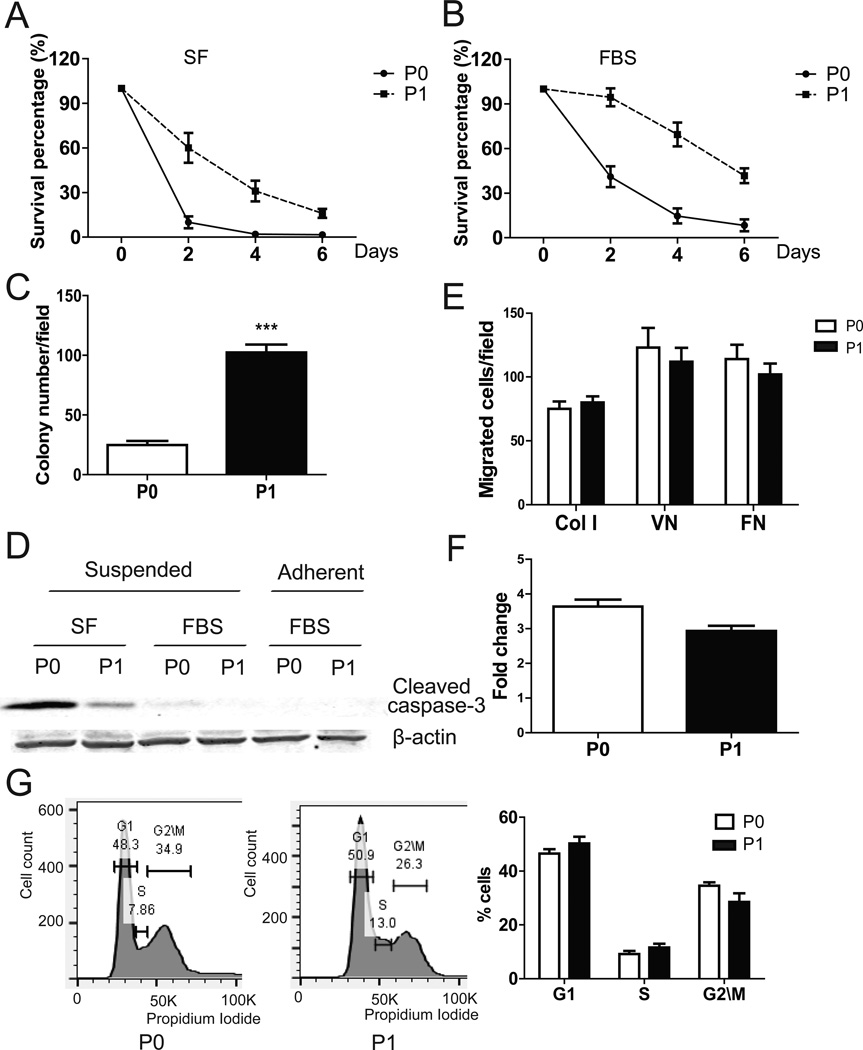
Anoikis assays in low attachment poly-HEMA coated plates were used to test cell survival in a suspended condition (5). After 3 days in serum free (SF) medium, ~40% of ID8-P1 cells, but ≤5% of ID8-P0 cells survived (Fig. 3A). After 3 days in 5% FBS, about 75% of ID8-P1 and 25% of ID8-P0 cells survived, respectively (Fig. 3B). Anoikis resistance is necessary for anchorage independent growth (6). Colony formation was 4-fold greater for ID8-P1 cells than for ID8-P0 cells (101 ± 5 vs. 23 ± 3, Fig. 3C). Reduced apoptosis in ID8-P1 cells as compared to ID8-P0 cells was supported by reduced activation of caspase-3, as detected in a Western blot for cleaved caspase-3 (Fig. 3D). This difference could be detected only in suspended cells. No caspase-3 activation (cleavage) was detected in either ID8-P0 or ID8-P1 when cells were attached (Fig. 3D). Interestingly, when cells were cultured in standard 2D cell culture dishes, no significant difference in cell proliferation was observed between ID8-P0 and ID8–P1 cells using MTT assays, but ID8-P1 cells had a tendency to have lower cell numbers (Fig. 3E). Flow cytometric analyses of cell cycles were also used to investigate whether there was a difference between ID8-P0 and ID8-P1 in cell cycle progression cultured in 2D cell culture dishes. The percentages of ID8-P0 cells in G1, S, and G2\M stages were 46.5±1.5%, 9.2±1.1%, and 34.5±1.1%, respectively. The percentages of ID8-P1 cells in G1, S, and G2\M stages were 50.3±2.3%, 11.6±1.4%, and 28.5±3.2%, respectively (Fig. 3G). These differences are not statistically significant. These results are consistent to our in vivo Ki67 staining data, supporting that ID8-P1 cells did not have increased proliferative capacity when cells were associated with matrix. We also compared cell migration using Boyden chamber transwell assays and found no significant difference between P0 and P1 cells (Fig. 3E). These results were consistent with our observations in mice that increased attachment of ID8-P1 cells to peritoneal organs at an early stage was not observed. Together, these results suggest that increased anoikis resistance was likely to be the most relevant and important feature acquired by ID8-P1 cells after in vivo passaging.
Figure 3. ID8-P1 displayed enhanced anoikis resistance in vitro.
A–B. Survival of ID8-P0 and ID8-P1 cells under suspended conditions with or without FBS (SF: serum free; FBS 5%). C. Colony numbers of ID8-P0 and ID8-P1 cells in soft agar. D. Western blot analysis showing cleaved caspase-3 levels in ID8-P0 and ID8-P1 cells under different culture conditions. E. Migration of ID8-P0 and ID8-P1 cells through Transwell membranes coated with collagen I (Col I), vitronectin (VN), or fibronectin (FN). F. Proliferation of ID8-P0 and ID8-P1 cells on plastic plates over 3 days with FBS (5%). G. Flow cytometric analyses of ID8-P0 and ID8-P1 cell cycles. Representative results are shown in the left panels and the summary of 3 repeated experiments is shown in the right panel. *** P<0.001.
Src/Akt/Erk signaling was necessary and sufficient for increased anoikis resistance
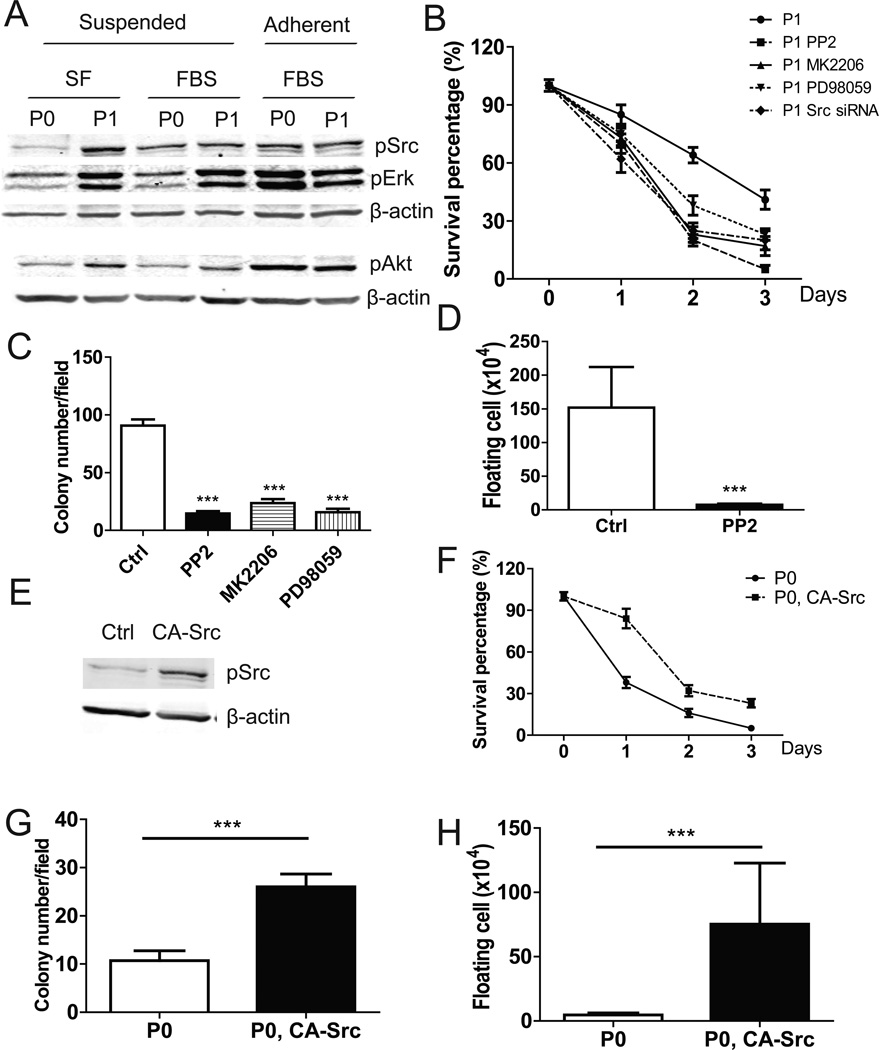
To elucidate the molecular mechanisms by which ID8-P1 cells gained anoikis resistance, we examined survival signaling pathways. Src/Akt/Erk signaling is a key mediator of cell survival (7). Western blot analyses showed that when cells were grown under adherent conditions, there were no obvious differences in activated (phosphorylated) Src, Akt, or Erk between ID8-P0 and ID8-P1 cells (Fig. 4A). However, when cells were grown under suspended conditions, Src, Akt, and Erk were highly activated in ID8-P1 cells, as compared to ID8-P0 cells, in the absence or presence of FBS (Fig. 4A).
Figure 4. Src/Akt/Erk signaling was constitutively activated and functionally involved in anoikis resistance in ID8-P1 cells.
A. pSrc, pAkt, pErk levels in ID8-P0 and ID8-P1 cells under different culture conditions by Western blot analyses. B. Survival of ID8-P1 cells under suspended conditions treated with Src siRNA (100 µM) and selective inhibitors: PP2 (10 µM), MK2206 (1 µM), PD98059 (30 µM). C. Quantification of soft agar colony numbers of ID8-P1 cells treated with inhibitors. D. Number of floating ID8-P1 cells in mouse peritoneal cavities treated with the Src selective inhibitor PP2 (daily i.p. injection at a dose of 2 mg/kg, n=3). E–G. Ectopic expression of CA-Src in ID8-P0 increased anoikis resistance. E. pSrc levels in ID8-P0 and ID8-P0-CA-Src cells by Western blot analyses. F. Anoikis assays of ID8-P0 and ID8-P0-CA-Src cells in SF medium. G. Colony formation of ID8-P0 and ID8-P0-CA-Src cells in soft agar. H. Numbers of floating ID8-P0 and ID8-P0-CA-Src cells in mouse peritoneal cavities. * P<0.05; **, P< 0.01; *** P<0.001.
To show that these molecules were functionally involved in anoikis, we used siRNA (for Src) and/or selective inhibitors (PP2 for Src; MK2206 for Akt; and PD98059 for Erk). All reduced the cell survival rate when ID8-P1 cells were cultured in suspension (Fig. 4B). These inhibitors also significantly reduced the colony forming ability of ID8-P1 cells (Fig. 4C). In vivo, PP2 reduced the number of surviving ID8-P1 cells in the mouse peritoneal cavity at day 5 post injection from ~ 1.5 million to ~ 0.08 million, a level similar to that seen for ID8-P0 cells. These data strongly suggest that enhanced Src activation is a crucial factor in the aggressiveness of ID8-P1 cells (Fig. 4D).
We further tested the involvement of Src in anoikis resistance by the overexpression of constitutively active Src (CA-Src) in ID8-P0 cells. The increased pSrc level in ID8-P0 cells was verified by Western blot analysis (Fig. 4E). Colony formation and anoikis assays showed that overexpression of CA-Src in ID8-P0 increased anchorage independent growth and cell survival in suspension (Fig. 4F, G). In addition, increased Src signaling led to more surviving floating ID8-P0 cells in the mouse peritoneal cavity at day 5 post injection (Fig. 4H). Therefore, Src signaling appeared to be necessary and sufficient for increased anoikis resistance in ID8 cells both in vitro and in vivo.
Metabolism and autophagy were important for anoikis resistance in ID8-P1 cells
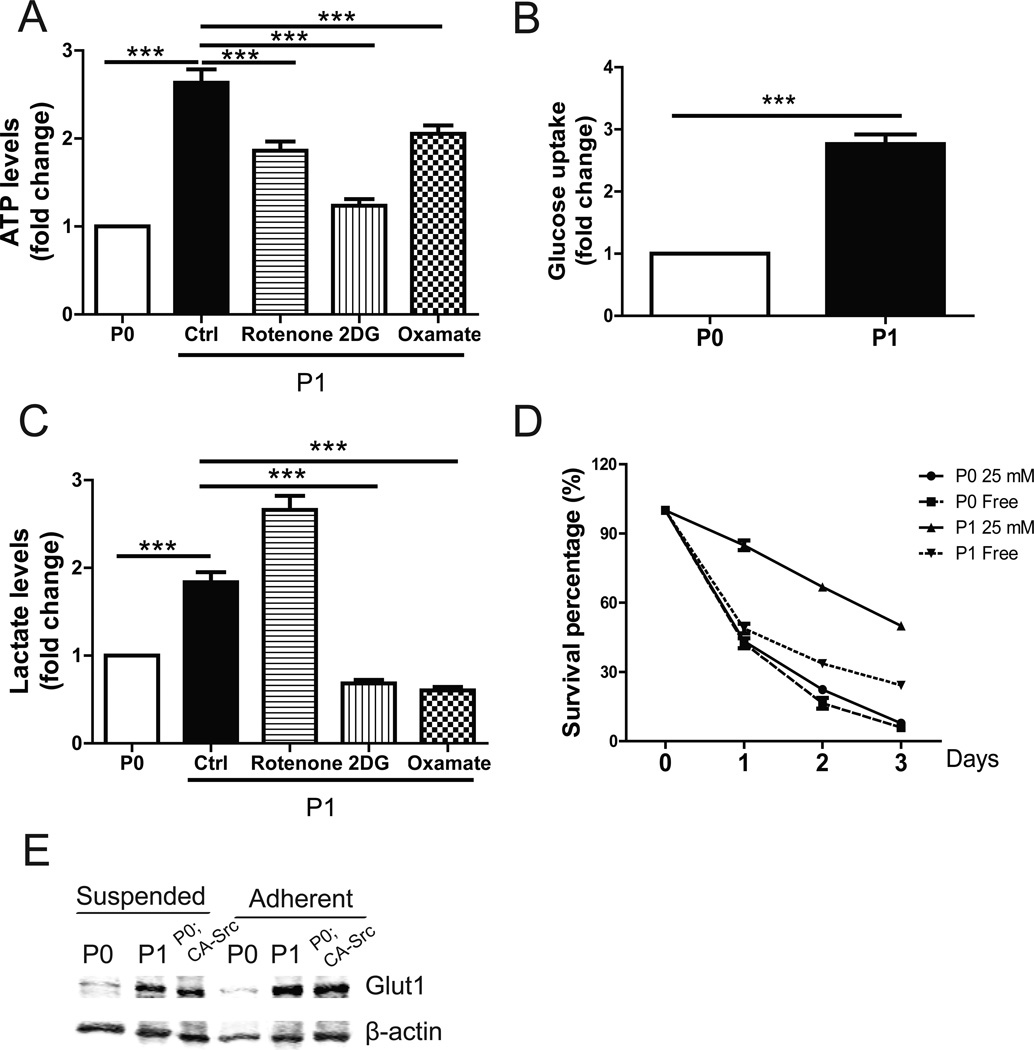
Cells can be rescued from anoikis by enhanced metabolism, which is regulated by Akt signaling (8). We tested whether increased anoikis resistance in ID8-P1 cells was related to changes in cellular metabolism. The ATP level was substantially higher in ID8-P1 cells, as compared to that of ID8-P0 cells (Fig. 5A). Consistently, ID8-P1 cells consumed 2-fold more glucose than ID8-P0 cells (3.9±0.3 mmol vs. 1.5±0.2 mmol; Fig. 5B). In addition, ID8-P1 cells produced more lactate than ID8-P0 cells in culture medium (Fig. 5C). Besides mitochondrial oxidative phosphorylation pathway, cancer cells have adapted to derive a significant amount of their ATP from converting glucose to lactate, a process termed the Warburg effect (9). We checked whether the increased metabolic rate in ID8-P1 cells was dependent on the mitochondrial pathway or glycolysis by using mitochondrial complex 1 inhibitor rotenone, glycolysis inhibitor 2-deoxyglucose (2DG) and lactate dehydrogenase A (LDHA) inhibitor oxamate (8, 10). As shown in Fig.5A and 5C, blocking of mitochondrial pathway and glycolysis both significantly decreased the ATP level and lactate secretion in ID8-P1 cells, indicating ID8-P1 cells used both pathways to maintain a high metabolic rate.
Figure 5. Enhanced metabolism was important for anoikis resistance in ID8-P1 cells.
A–C, ID8-P0 and ID8-P1 cells were cultured in 1 mL DMEM with 25 mM glucose with or without an inhibitor [(rotenone (5 µM), 2-deoxyglucose (2DG) (10 mM), or oxamate (20 mM)] for 24 hours. Cells and culture medium were separated by centrifugation and cell number was counted. Results are normalized by cell number. A. Comparison of ATP levels of suspended ID8-P0 and ID8-P1 cells. B. Glucose consumption of suspended ID8-P0 and ID8-P1 cells over 24 hours. C. Comparison of lactate secretion of ID8-P0 and ID8-P1 cells. D. Survival of ID8-P0 and ID8-P1 cells in glucose-free medium and 25 mM glucose medium. E. Glut1 level in ID8-P0, ID8-P1 and ID8-P0; CA-Src cells by Western blot. *** P<0.001.
To explore the functional importance of enhanced metabolism in ID8-P1 cells, we cultured both ID8-P0 and ID8-P1 in glucose-free medium in low attachment plates. As shown in Fig. 5D, the survival rate of ID8-P1 cells decreased dramatically in glucose-free medium, while the survival rate of ID8-P0 cells was only slightly affected, indicating that the anoikis resistance of ID8-P1 cells was glucose-dependent. Glucose is transported from extracellular spaces into cells by glucose transporters, and mainly via Glut-1 in cancer cells. Western blot analyses showed that the Glut-1 level was elevated in ID8-P1 as compared to ID8-P0 cells (Fig. 5E). Ectopic expression of CA-Src in ID8-P0 cells increased Glut-1 expression in these cells, suggesting Src is an important regulator of Glut-1 (Fig 5E).
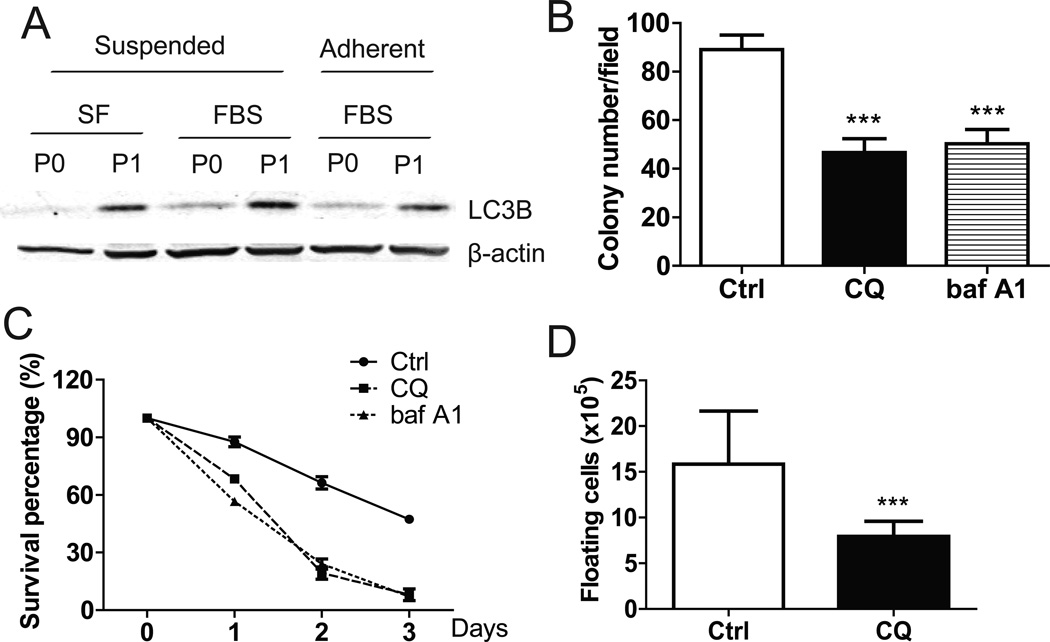
Given the important role of autophagy in tumor cell metabolism and enhanced energy production, we examined the levels of LC3B (a marker of autophagy) in ID8-P1 cells. Indeed, LC3B was greatly elevated in ID8-P1 cells (Fig. 6A). To test the functional importance of the autophagic pathway, the effects of selective inhibitors chloroquine (CQ) and baf A1 on the survival rate of suspended cells were tested. ID8-P1 cell survival was reduced from 43% to 5% and colony formation in soft agar dropped from 90±7 to 50±5 (Fig. 6B, C). Injection of CQ (i.p.) also efficiently inhibited ID8-P1 tumor cell survival in the mouse peritoneal cavity on day 5 post injection (Fig. 6D).
Figure 6. Increase of autophagy protected ID8-P1 cells from anoikis.
A. Expression of LC3B in ID8-P0 and ID8-P1 cells by Western blot analyses. B. Quantification of soft agar colony numbers of ID8-P1 cells treated with CQ (30 µM) and baf A1 (5 µM). C. Survival of ID8-P1 cells under suspended conditions treated with selective autophagy inhibitors: CQ (30 µM) and baf A1 (5 µM). D. Numbers of floating ID8-P1 cells when treated with selective autophagy inhibitor CQ (daily i.p. injection at a dose of 50 mg/kg, n=3) in mouse peritoneal cavities. * P<0.05; **, P< 0.01; *** P<0.001.
ID8-P1 cells from other organs showed similar characteristics as ID8-P1 from the peritoneal wall (PW)
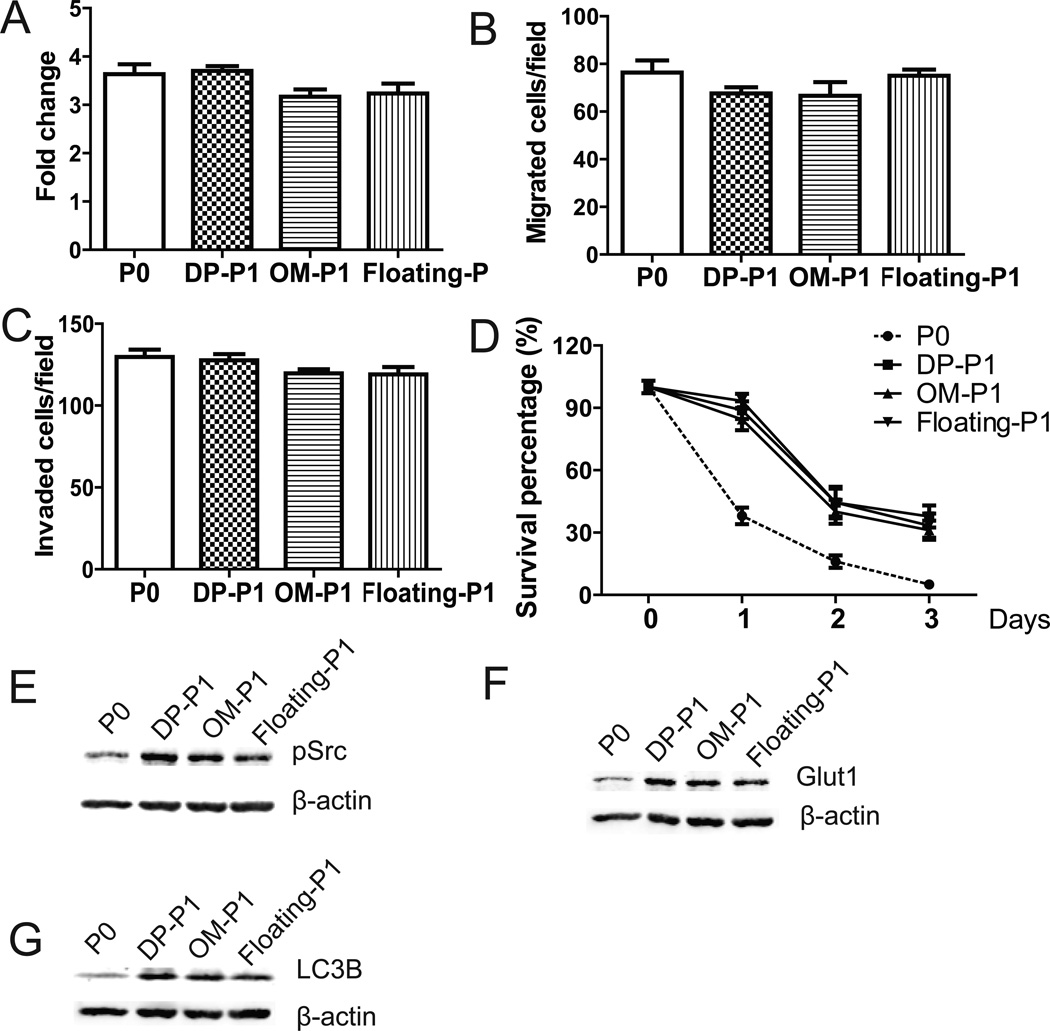
Similar to ID8-P1 cells form PW, the additional P1 cell lines (ID8-DP-P1, ID8-OM-P1, and ID8-floating-P1) had no significant changes in cell proliferation (analyzed in attached 2D tissue culture plates using MTT assays, Fig. 7A), migration (Fig. 7B), and invasion (Fig. 7C), when compared to those of P0 cells. In contrast, all of these P1 cell lines displayed enhanced survival when cells were cultured in suspension (Fig. 7D), suggesting that anoikis resistance is a common feature of P1 cells, regardless their organ sites. In addition, up-regulations of Src, Glut-1, and LC3B expression in all three P1 cell lines, compared to P0 cells, are shown in Figs. 7E to 7G.
Figure 7. Characterization of ID8-P1 cells from other organ sites.
A. Cell proliferation of ID8-P0, ID8-DP-P1, ID8-OM-P1, and ID8-floating-P1 cells on 2D cell culture plates over 3 days in the presence of FBS (5%) analyzed by MTT assays. B. Cell migration of ID8-P0, ID8-DP-P1, ID8-OM-P1, and ID8-floating-P1 cells through Transwell membranes coated with collagen I (Col I). C. Cell invasion of ID8-P0, ID8-DP-P1, ID8-OM-P1, and ID8-floating-P1 cells through Transwell membranes coated Matrigel. D. Cell survival of ID8-P0, ID8-DP-P1, ID8-OM-P1, and ID8-floating-P1 cells under suspended conditions in serum-free medium. E–G. Expression levels of pSrc, Glut1, and LC3B in ID8-P0, ID8-DP-P1, ID8-OM-P1 and ID8-floating -P1 cells by Western blot analyses.
Src-mediated anoikis resistance in in vivo passaged human EOC cells
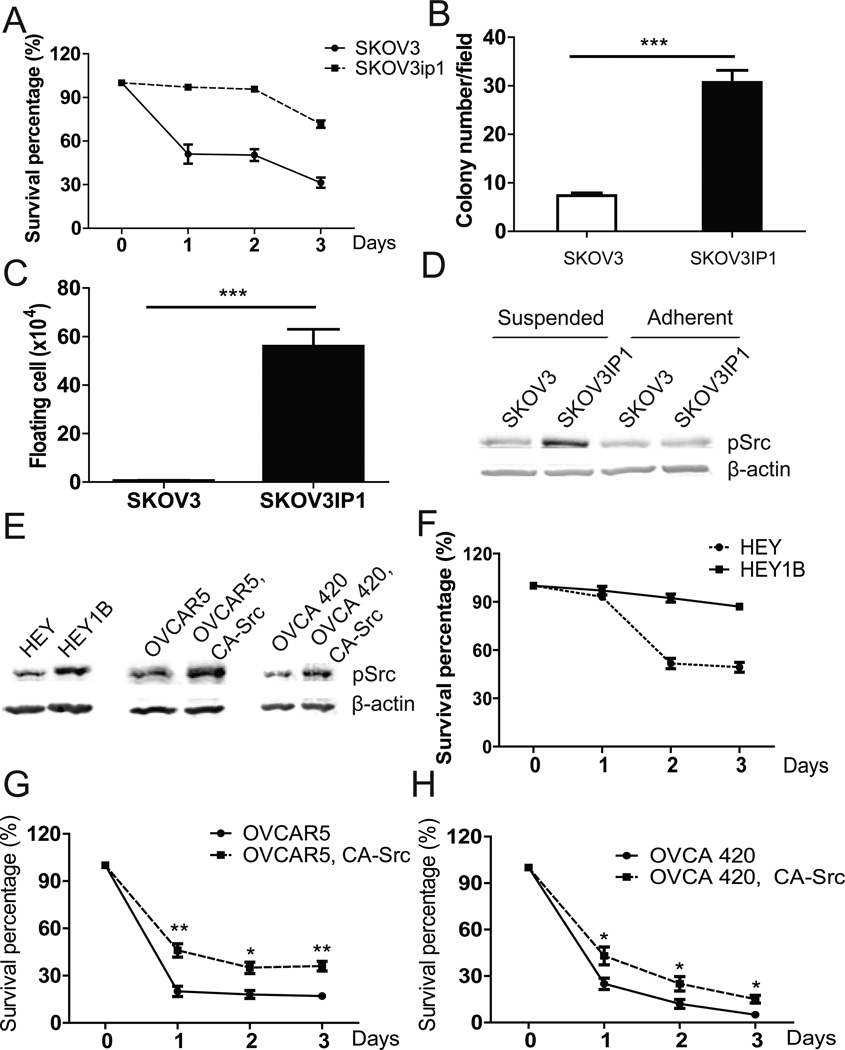
To test whether anoikis resistance is also an important feature of aggressiveness in a similar model using human EOC cells, we compared the cell lines SKOV3 and SKOV3ip1. SKOV3ip1 cells were developed by Dr. Mien-chie Hung’s lab through in vivo passage of SKOV3 cells in nu/nu mice. As reported by others, SKOV3ip1 cells showed increased aggressiveness upon re-injection into naïve nu/nu mice, as compared with the parent SKOV3 cells (11). Similar to mouse ID8-P1 cells, SKOV3ip1 cells were much more anoikis resistant than SKOV3 cells (survival rate: 64% vs. 30%, Fig. 8A). In the anchorage-independent growth assay, SKOV3ip1 formed two-fold more colonies than SKOV3 (31±4 vs. 13±3, Fig. 8B). More importantly, when these cells were i.p. injected into NOD/SCID mice (5 × 10⁶ cells per mouse, n=3), only 2±1 ×10⁴ SKOV3 cells, as compared with 5.6±0.5 × 10⁵ SKOV3ip1 cells (a 28-fold difference), survived 5 days post injection in the mouse peritoneal cavities (Fig. 8C). Finally, Src signaling was activated in suspended SKOV3ip1 cells, but not in suspended SKOV3 cells (Fig. 8D).
Figure 8. Increased anoikis and Src activation in SKOV3ip1 cells.
A. Survival of SKOV3 and SKOV3ip1 in the anoikis assay. B. Colony numbers of SKOV3 and SKOV3IP1 grown in soft agar. C. Numbers of floating living tumor cells recovered in washes of NOD/SCID mouse peritoneal cavities (n=3). D. pSrc levels in SKOV3 and SKOV3ip1 cells analyzed by Western blot. E. pSrc levels in HEY, HEY1B, OVCAR5, OVCA420, and their CA-Src overexpression cells by Western blot analyses. F. Anoikis assays of HEY and HEY1B cells in SF medium. G. Anoikis assays of OVCAR5 and OVCAR5, CA-Src cells in SF medium. H. Anoikis assays of OVCA 420 and OVCA 420, CA-Src cells in SF medium. * P<0.05; **, P< 0.01; *** P<0.001.
We also tested pSrc expression in another pair of human in vivo passaged cell lines: HEY and HEY1B. HEY1B was developed through in vivo passage of HEY cells (12). Western blot analyses showed that Src was highly activated in HEY1B cells (Fig. 8E) and HEY1B cells were much more resistant to anoikis than HEY cells in serum-free medium (Fig. 8F). To further verify Src-mediated anoikis resistance in human ovarian cancer cell lines, we overexpressed constitutive Src (CA-Src) in OVCAR5 and OVCA 420 cells (Fig. 8E). As shown in Fig. 8G, H, overexpression of CA-Src in these cells significantly improved their survival percentages in suspension condition.
Discussion
More than one third of ovarian cancer patients present with ascites at diagnosis, and almost all have ascites at recurrence. The presence of ascites correlates with the peritoneal spread of ovarian cancer and is associated with poor disease prognosis (13). It is well-known that ascites contains large number of tumor cells and in fact, most of the established human EOC cells lines were isolated from ascites, with only a few from solid tumors. However, to our knowledge, the potential correlation and functional relationship between the numbers of floating peritoneal tumor cells and their cellular properties to disease prognosis have not been studied. Using mouse EOC syngeneic cell pairs generated via in vivo passaging, we found that enhanced anoikis resistance is a critical cellular process that correlates to tumor aggressiveness judged by time to tumor/ascites onset and morbidity. This notion is strongly supported by both in vivo and in vitro studies.
We have examined the peritoneal tumor cells survival at early stage post injection, which recapitulates early stage dissemination of EOC cells. It is highly significant and interesting to find that the numbers of survival floating cells are best correlated with tumor aggressiveness. This suggests that removing ascites from EOC patients is not only for reduction of patients’ discomfort and burden, but also more importantly for reduction of the important source for solid tumor/metastases development. It also suggests that in addition to optimal debunking solid tumors, more complete washings to remove loosely attached or floating tumor cells in the peritoneal cavity may have clinical benefit for patients. Technically, the early stage floating cell counting may represent an alternative and more convenient method for analyze tumorigenesis in i.p. EOC models in vivo, when compared to the longer-time solid tumor end point method, which needs to be tested in more human and/or mouse EOC cells.
Src activation is one of the most extensively characterized oncogenic signaling pathways. It controls many cellular processes including survival. During the course of the current study, when we had already generated our ID8-P1 cell lines and independently found that Src is constitutively activated in ID8-P1 cells, Ward et al., using a similar approaches, reported that elevated FAK and c-Src tyrosine kinase activation are associated with ID8-IP cells when compared to parental ID8 cells (14). However, their ID8-IP cells were derived from ascites by expansion of ascites cells after culturing under anchorage-independent conditions on low binding poly-HEMA coated plates for 3–4 weeks (14). In contrast, we isolated P1 cells from solid metastases on different organs. In addition, our isolated tumor cells were selected for transfected GFP using antibiotics, and were free of host cell contamination. The original ID8 cells were obtained through spontaneous transformation of normal ovarian surface epithelial cells from C57BL6 mice by repetitive passage in vitro. Additional passages of ID8 cells in vitro in our lab did not change their tumorigenic potential, with tumor/ascites formation requiring 80–110 days in the over 100 mice tested. In contrast, only one round of in vivo passaging dramatically altered the aggressiveness of these cells, indicating that the tumor microenvironment and host cells play important roles in modulating tumor cell properties. Which host cells and/or other tumor microenvironmental factors play pivotal roles in these interactions and modifications remains to be further investigated. It is also possible that in vivo passaging effectively select highly anoikis resistant cells.
While the previous work by Ward et al. focused on FAK (14), we show here that Src is not only necessary, but also sufficient to induce anoikis resistance in EOC cells. We found that in vitro anoikis and colony formation assays, but not proliferation in 2D growth assays, are highly consistent with in vivo early stage peritoneal cell survival assays in all of our functional studies, suggesting these in vitro assays recapitulate the anoikis resistance properties of tumor cells in vivo. We further show that ID8-P1 cells have increased glucose metabolism and ATP production, related to their increased Glut-1 expression, which is likely to be regulated in part by Src activation. Increased metabolism is functionally involved in anoikis resistance. Moreover, ID8-P1 cells display up-regulation of several autophagic factors, which also functionally contribute to anoikis resistance.
The mouse EOC cell model has the advantage of being an immune-competent model, better representing the natural state. The potential utility of the ID8 cell/C57BL6 mouse model in human disease was demonstrated by our experiments with the human SKOV3/SKOV3ip1, and HEY/HEY1B pairs, which displayed similar oncogenic alternations in signaling pathways for anoikis resistance and Src activation.
Taken together, our studies have provided strong evidence that the level of anoikis resistance of EOC cells may be a good indicator of tumor aggressiveness in vivo, which may be conveniently analyzed at early stage of tumor i.p. injection, or even using one of the in vitro anchorage-independence assays. This notion needs to be tested further in more EOC cells and models. More importantly, this is the first study showing that the anoikis resistance in EOC cells is likely to be a key driving process that controls disease progression and prognosis. Removing or eradicating floating tumor cells more completely, in addition to solid tumors, may have clinical benefits to EOC patients.
Materials and Methods
Materials
The following reagents were used: PP2 (Tocris bioscience, Minneapolis, MN), MK2206 (Biovision, Milpitas, CA), PD98059 (Enzo Life Sciences, Farmingdale, NY), Chloroquine (CQ) (Sigma, St. Louis, MO), Bafilomycin A1 (baf A1) (Sigma, St. Louis, MO), Src siRNA (Dharmacon, Pittsburgh PA), Rotenone (Sigma, St. Louis, MO), 2-deoxyglucose (Sigma, St. Louis, MO), sodium oxamate (Sigma, St. Louis, MO). Antibodies against pSrc, pAkt, pErk, LC3B, and cleaved caspase3 were from Cell Signaling (Boston, MA). Antibodies against Glut-1, CD31, Ki-67, and F4/80 were from Millipore (Billerica, MA), Abcam (Cambridge, MA), Ebioscience (San Diego, CA), and BIO-RAD (Hercules, CA), respectively.
Cell lines, culture, and mouse model
ID8 cells were obtained from Dr. Paul F. Terranova (University of Kansas Medical Center). Cells were cultured in DMEM supplemented with 4% fetal bovine serum, 100 units/mL penicillin, 100 µg/mL streptomycin, 5 µg/mL insulin, 5 µg/mL transferrin, and 5 ng/mL sodium selenite. The ID8-luc cell line (expressing both GFP and luciferase) was established as described (15). SKOV3 and SKOV3ip1 (courtesy of Dr. Mien-Chie Hung, University of Texas M. D. Anderson Cancer Center) were cultured in DMEM/F12 supplemented with 4% fetal bovine serum. ID8-luccells (5 × 10⁶) were injected into the peritoneal cavity ofC57BL6 mice. Between 80 and85 days post injection, tumor nodules on the peritoneal wall were isolated and cultured with Zeocin (100 µg/mL) selection to exclude non-tumor cells. The new cell lines weretermedID8-P1. All animal experiments were done under the protocols approved by Indiana University Animal Care and Use Committee.
Cell cycle analysis by flow cytometry
ID8-P0 and P1 cells cultured in complete medium were collected, washed 2 times in PBS and fixed in 75% ice-cold ethanol for 2 hours. Cells were stained in 500 µl Propidium Iodide (PI) staining solution: 0.1% (v/v) Triton X-100 in PBS with 100 µg DNAse-free RNAse A and 20 µl 500 µg/ml PI at 37°C for 15 minutes. Data acquisition was performed using a BD LSRII flow cytometer and analyzed by the FlowJo software (Tree Star, Inc. Ashland, OR, USA).
Anoikis assays
Cells (5 × 10⁵) were plated onto poly-HEMA coated 6-well plates (Corning) in growth medium to prohibit attachment. After 24, 48, and 72 hours in suspension, cells were transferred onto regular cell culture plates in growth medium supplemented with FBS (1%) to aid attachment. After 4 hours, attached cells were trypsinized and counted using a hemocytometer. Experiments were repeated three times.
Cell survival in mouse peritoneal cavity
ID8-P0 or ID8-P1 cells (5 × 10⁶) were i.p. injected into C57BL6 mice (n=3 per group). At several time points post injection, mice were sacrificed and the peritoneal cavities were washed with 3 mL DMEM medium. The free floating tumor cells inthe wash medium were counted with a hemocytometer under a fluorescent microscope (SMZ1000, Nikon, Melville, NY). Dead cells were excluded by trypan blue staining.
Soft agar colony assays
Cells were suspended in 0.35% agar and seeded onto a 0.5% agar layer in 24-well plates (5 × 10³ cells per well) in triplicate. Two weeks later, cells were stained with crystal violet. Three fields per well were imaged and colonies were counted.
Measurement of ATP level, glucose uptake and lactate secretion
ID8-P0 and ID8-P1 cells were seeded into poly-HEMA-coated 24-well plates and cultured in 1 mL DMEM with 25 mM glucose for 24 hours. Then cells and the culture medium were separated by centrifugation. Cell number was counted and cells were used to check ATP level by CellTiter-Glo® Luminescent Cell Viability Assay (Promega, Madison, WI). The culture medium was used to check glucose level by Amplex® Red Glucose assay kit (Life technologies, NY) and lactate level by Lactate assay kit (Abcam, MA). All of these results were normalized by cell number. The fold changes were calculated by dividing the normalized values of ID8-P1 cells by the normalized values of ID8-P0 cells. Experiments were repeated three times.
Western blot
Western blot analyses were conducted using standard procedures and proteins were detected using primary antibodies and fluorescent secondary antibodies (Li-Cor Biosciences, Lincoln, NE). The fluorescent signals were captured on an Odyssey Infrared Imaging System (Li-Cor Biosciences, Lincoln, NE).
Statistical Analyses
Data are presented as mean ± SD. For differences between two groups the Students t-test was employed. The statistical program GraphPad Prism 5, Ver. 5.04 (GraphPad Software, Inc., La Jolla, CA) was used for all analyses. The significance level was set at P< 0.05.
Acknowledgement
We thank Dr. Caryl Antalis and Ms. Christy A. Tidwell for their critical reading and editing of this manuscript.
Grant support:
This work is supported in part by the National Institutes of Health (RO1 155145 to YX); and the Mary Fendrich-Hulman Charitable Trust Fund to YX.
Footnotes
Conflict of interest:
The authors declare no conflict of interest.
REFERENCES
- 1.Integrated genomic analyses of ovarian carcinoma. Nature. 2011;474(7353):609–615. doi: 10.1038/nature10166. Epub 2011/07/02. [DOI] [PMC free article] [PubMed] [Google Scholar]
- 2.Janat-Amsbury MM, Yockman JW, Anderson ML, Kieback DG, Kim SW. Combination of local, non-viral IL12 gene therapy and systemic paclitaxel chemotherapy in a syngeneic ID8 mouse model for human ovarian cancer. Anticancer Res. 2006;26(5A):3223–3228. Epub 2006/11/11. [PubMed] [Google Scholar]
- 3.Said NA, Najwer I, Socha MJ, Fulton DJ, Mok SC, Motamed K. SPARC inhibits LPA-mediated mesothelial-ovarian cancer cell crosstalk. Neoplasia. 2007;9(1):23–35. doi: 10.1593/neo.06658. Epub 2007/02/28. [DOI] [PMC free article] [PubMed] [Google Scholar]
- 4.Roby KF, Taylor CC, Sweetwood JP, Cheng Y, Pace JL, Tawfik O, et al. Development of a syngeneic mouse model for events related to ovarian cancer. Carcinogenesis. 2000;21(4):585–591. doi: 10.1093/carcin/21.4.585. Epub 2000/04/07. [DOI] [PubMed] [Google Scholar]
- 5.Sher I, Adham SA, Petrik J, Coomber BL. Autocrine VEGF-A/KDR loop protects epithelial ovarian carcinoma cells from anoikis. Int J Cancer. 2009;124(3):553–561. doi: 10.1002/ijc.23963. Epub 2008/11/13. [DOI] [PubMed] [Google Scholar]
- 6.Chiarugi P, Giannoni E. Anoikis: a necessary death program for anchorage-dependent cells. Biochem Pharmacol. 2008;76(11):1352–1364. doi: 10.1016/j.bcp.2008.07.023. Epub 2008/08/19. [DOI] [PubMed] [Google Scholar]
- 7.Guadamillas MC, Cerezo A, Del Pozo MA. Overcoming anoikis--pathways to anchorage-independent growth in cancer. J Cell Sci. 2011;124(Pt 19):3189–3197. doi: 10.1242/jcs.072165. Epub 2011/09/24. [DOI] [PubMed] [Google Scholar]
- 8.Schafer ZT, Grassian AR, Song L, Jiang Z, Gerhart-Hines Z, Irie HY, et al. Antioxidant and oncogene rescue of metabolic defects caused by loss of matrix attachment. Nature. 2009;461(7260):109–113. doi: 10.1038/nature08268. Epub 2009/08/21. [DOI] [PMC free article] [PubMed] [Google Scholar]
- 9.Ward PS, Thompson CB. Metabolic reprogramming: a cancer hallmark even warburg did not anticipate. Cancer cell. 2012;21(3):297–308. doi: 10.1016/j.ccr.2012.02.014. Epub 2012/03/24. [DOI] [PMC free article] [PubMed] [Google Scholar]
- 10.Miskimins WK, Ahn HJ, Kim JY, Ryu S, Jung YS, Choi JY. Synergistic anti-cancer effect of phenformin and oxamate. PloS one. 2014;9(1):e85576. doi: 10.1371/journal.pone.0085576. Epub 2014/01/28. [DOI] [PMC free article] [PubMed] [Google Scholar]
- 11.Yu D, Wolf JK, Scanlon M, Price JE, Hung MC. Enhanced c-erbB-2/neu expression in human ovarian cancer cells correlates with more severe malignancy that can be suppressed by E1A. Cancer Res. 1993;53(4):891–898. Epub 1993/02/15. [PubMed] [Google Scholar]
- 12.Baumal R, Law J, Buick RN, Kahn H, Yeger H, Sheldon K, et al. Monoclonal antibodies to an epithelial ovarian adenocarcinoma: distinctive reactivity with xenografts of the original tumor and a cultured cell line. Cancer Res. 1986;46(8):3994–4000. Epub 1986/08/01. [PubMed] [Google Scholar]
- 13.Ahmed N, Stenvers KL. Getting to Know Ovarian Cancer Ascites: Opportunities for Targeted Therapy-Based Translational Research. Front Oncol. 2013;3:256. doi: 10.3389/fonc.2013.00256. Epub 2013/10/05. [DOI] [PMC free article] [PubMed] [Google Scholar]
- 14.Ward KK, Tancioni I, Lawson C, Miller NL, Jean C, Chen XL, et al. Inhibition of focal adhesion kinase (FAK) activity prevents anchorage-independent ovarian carcinoma cell growth and tumor progression. Clin Exp Metastasis. 2013;30(5):579–594. doi: 10.1007/s10585-012-9562-5. Epub 2013/01/01. [DOI] [PMC free article] [PubMed] [Google Scholar]
- 15.Li H, Wang D, Zhang H, Kirmani K, Zhao Z, Steinmetz R, et al. Lysophosphatidic acid stimulates cell migration, invasion, and colony formation as well as tumorigenesis/metastasis of mouse ovarian cancer in immunocompetent mice. Mol Cancer Ther. 2009;8(6):1692–1701. doi: 10.1158/1535-7163.MCT-08-1106. Epub 2009/06/11s. [DOI] [PubMed] [Google Scholar]


