

Introduction
In the past decade, we have witnessed great advances in high-throughput genomic and proteomic profiling technologies, such as DNA microarrays, next-generation sequencing (NGS) and mass spectrometry based proteomics and metabolomics. These advances, capable of generating massive amounts of genomic, transcriptomic, proteomic and metabolomic data, provide new opportunities to understand human diseases, identify potential biomarkers, and develop new treatments1. This data intensive paradigm has fundamentally transformed biomedical science and holds great promise for the betterment of human health2.
These high-throughput biotechnologies have also heightened the challenges of how to distill biological knowledge and novel insights from the sea of data. New computational approaches and statistical models are needed to effectively model and better interpret these high-dimensional, multi-platform data1. Reductionism has led to tremendous success in molecular biology: we can now zoom in to study each individual genes or proteins, being able to study their composition and aberrations at the resolution of single nucleotide or amino acid and inquire their structural and chemical properties. However, genes and proteins in cells do not work in isolation: they communicate and coordinate with each other to carry out various biological functions. Systems approaches have become an important and promising alternative to unravel the mechanisms that orchestrate the activities of genes and proteins in cells. Systems approaches are particularly valuable to study complex diseases like cancers and cardiovascular diseases. Unlike many Mendelian diseases, where we can often pinpoint genetic culprits in single or a few genes, causes of complex diseases are multifaceted, involving various molecular aberrations and environmental factors3. This complexity is further amplified by the interconnected nature of the biomolecules in the cells, which propagates these aberrations or erroneous signals throughout the system, thus posing a great challenge to elucidate the true causes and underlying mechanisms.
Biological networks provide a conceptual and intuitive framework to investigate, model, characterize and understand complex interactions of different components in a biological system. By employing a holistic approach, network biology studies the “interactome”, a set of direct or indirect molecular interactions, of the biological system. A biological network hence represents the molecular “wiring” diagram of a cell's information processing system. Biological networks are useful representations to visualize and understand the functions and interactions of biomolecules. It is challenging to discern patterns and distill knowledge from massive amount of data in a high-dimensional space. An informative network model and a graphical representation reveal the relationships among different cellular components and help to detect subtle patterns by “connecting the dots”. Biological networks reveal high-level relationships, enrichment patterns and system-wide properties, which are lacking in univariate analyses. Network theory (and graph theory), as a subfield of computer science and mathematics, has established rich theory and found many applications in the world-wide web, social networks, particle physics, etc., some of which are readily applicable to biological networks and disease networks4. In addition, network motifs, recurrent and statistically significant sub-graphs in the networks, have shown to be conserved in evolution and associated with certain biological functions5.
Some biological network models are capable of simulating a biological system's dynamical behaviors and properties. The complexity of a biological system is reflected in part by a large number of interacting variables, the dynamics of which are governed by numerous linear or nonlinear relationships, chemical kinetics, feedback loops and stochasticity. Like many physical and engineering systems, biological scientists now have mathematical or computer models at their disposal to perform numerical simulations to understand their temporal behaviors and properties.
Biological networks are a natural and versatile framework to incorporate different sources of data and prior knowledge. The advances in molecular profiling technologies enable data collection at different levels of the biological system and empower scientists with new tools to probe the system. However, due to differences in these technology platforms, data sets are often heterogeneous in nature. Further, significant efforts have also been made to manually curate and document molecular interactions in cells, such as protein-protein interactions and biological pathways, providing rich domain knowledge. The computational challenge we are facing is how to “optimally” fuse these heterogeneous data and prior knowledge to answer meaningful biological questions, and biological networks present a flexible framework for multi-level data representation and integration.
Due to the complexity of cardiovascular systems, network-based approaches are particularly promising and applicable in cardiovascular research. Successful applications of network biology in cardiovascular literature have been recently reviewed6–9. In this review, we focus our discussion on computational approaches for biological network modeling and analysis. We first summarize some publicly available biological databases representing a variety of biological networks. Then we introduce statistical and dynamical network models widely used for biological network modeling and inference from experimental data. We also discuss how integrative analysis may bridge the gap between prior knowledge on physical interactions in biological databases and mathematical models inferred from experimental data. Finally, we demonstrate the applicability and effectiveness of network biology approaches with examples of network visualization and analysis algorithms and software tools.
Physical interactions and biological network databases
Tremendous efforts have been made to curate biological interactions identified in wet-lab experiments and reported in literature, and organize them in biological databases. These databases represent current knowledge on molecular interactions and are indispensable resources for biological data analysis. Biological networks are a very broad and inclusive concept. They can refer to gene regulatory networks, protein-protein interaction networks, signaling networks, metabolic networks, etc., each of which has its own specialized biological network database resources.
Gene regulatory networks
A gene regulatory network (GRN) is a collection of interactions of genes, usually through their products mRNAs and proteins, governing the expression levels of the mRNAs and proteins of these genes (Figure 1(a)). Transcription factors (proteins that bind to specific DNA sequences) are typical examples of “regulators” in a gene regulatory network. For humans, only a small fraction of genes are DNA binding (2,000 to 3,000 sequence-specific DNA binding transcription factors) and 200 to 300 of them define the basic transcriptional machinery11. By binding enhancer or promoter or silencer regions of DNA alone or with other proteins, transcription factors either activate or suppress the expression of the nearby genes. There are also other regulation mechanisms that modulate gene expression, e.g. DNA methylation12, histone acetylation13 and microRNAs14.
Figure 1.
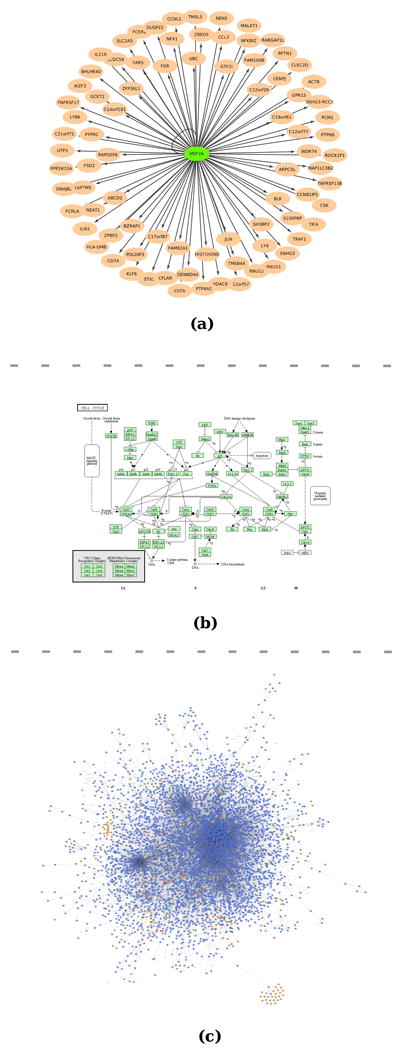
(a) An example of MEF2A transcriptional network derived from ENCODE data10. (b) KEGG cell cycle pathway. (c) A global view of PPI network retrieved from Database of Interacting Proteins.
ENCODE project
The Encyclopedia of DNA Elements (ENCODE) was an international research effort to find functional elements in the human genome, and understanding the DNA's regulatory elements and their regulatory relationships is one of the aims of the ENCODE project15. The ENCODE project has generated chromatin immunoprecipitation and high-throughput sequencing (ChIP-seq) data sets for 119 distinct transcription factors over five main cell lines, revealing complex regulation mechanisms in the human genome and providing a wiring diagram of the regulatory network in a cell10. These connections are curated and downloadable at http://encodenets.gersteinlab.org. Also, information on the ChIP-seq peaks, discovered motifs and associated histone modification patterns is deposited and publicly accessible at a web portal Factorbook (http://www.factorbook.org)16.
Databases for transcription factors and their binding sites
TRANSFAC®, JASPAR, and UniProbe are all manually curated databases of eukaryotic transcription factors and their binding sites. TRANSFAC® database focuses on single factor-site interactions with information on experimentally-proven binding sites, consensus binding sequences (positional weight matrices) and regulated genes17. TRANSFACompel® database characterizes composite elements, where two (or more) transcription factors bind to two (or more) neighboring binding sites and jointly regulate gene expression in either a synergistic or an antagonistic manner. TRANSFAC® and TRANSFACompel® databases have a public version (http://www.gene-regulation.com/pub/databases.html), which is an older version and free of charge, and also provide a Professional version, which contains the most up-to-date data and requires a license. Similar to TRANSFAC, the JASPAR database features annotated, high-quality, matrix-based transcription factor binding site profiles, derived from published collections of experimentally defined transcription factor binding sites for eukaryotes18. JASPAR core database is freely accessible at http://jaspar.genereg.net/.
The UniPROBE (Universal PBM Resource for Oligonucleotide Binding Evaluation) database hosts data generated with universal protein binding microarray (PBM) technology. PBM technology is an efficient way to interrogate DNA-binding preferences, complementary to technologies such as ChIP-chip and ChIP-seq. The UniPROBE database is available at http://thebrain.bwh.harvard.edu/uniprobe/, allowing both online viewing and data downloading.
Signaling pathways and metabolic networks
A signaling network (or signaling pathway) models the information flow and communication that governs and coordinates basic cellular activities in a cell (Figure 1(b)). A metabolic network, consisting of metabolites and their interactions, depicts the chemical reactions of metabolism, the metabolic pathways, as well as the regulatory interactions that guide these reactions.
Databases for signaling and metabolic pathways
Kyoto Encyclopedia of Genes and Genomes (KEGG) PATHWAY provides a reference knowledge base of the wiring diagrams of interaction networks and reaction networks for metabolism, genetic information processing, environmental information processing, cellular processes, organismal systems, human diseases, and drug development19. KEGG PATHWAY database can be accessed via web (http://www.genome.jp/kegg/pathway.html). Reactome is an open-source, open access, manually curated and peer-reviewed pathway database, which ranges from metabolic processes to hormonal signaling and includes 2975 human proteins, 2907 reactions and 4455 literature citations20 (http://www.reactome.org). BioCarta is a similar pathway database, which uses an open source, community-supported approach to catalog and summarize important resources providing information for both classical pathways as well as current suggestions for new pathways (http://www.biocarta.com/genes/index.asp). NCI-Nature Pathway Interaction Database provides biomolecular interactions and cellular processes assembled into authoritative human signaling pathways (http://pid.nci.nih.gov/). Currently, this database has 137 human pathways with 9248 interactions curated by NCI-Nature and 322 human pathways with 7575 interactions imported from BioCarta/Reactome.
There are also ongoing efforts to make these signaling and metabolic pathway databases more integrated with easy interactive and programmable access. Pathway Commons is a collection of publicly available pathways, aggregated from sources such as Reactome and NCI-Nature Pathway Interaction Database21 (http://www.pathwaycommons.org). WikiPathways is a community-based, collaboratively edited website for contributing and maintaining content dedicated to biological pathways22 (http://wikipathways.org). Each pathway is represented by an online editable diagram, and also includes a description, bibliography, pathway version history and list of component genes and proteins with link-outs to public resources.
Ingenuity IPA (Ingenuity® Systems, http://www.ingenuity.com) is a commercial software tool to model, analyze, and understand complex omics data in the contexts of biological networks and pathways, which are built upon the Ingenuity Knowledge Base, a repository of curated biological pathways and functional annotations. Typical analysis tasks include network enrichment analysis, data visualization, pathway comparison study, upstream regulator analysis, causal network analysis23.
Protein-protein interactions
A protein-protein interaction (PPI) network consists of proteins and their interactions (Figure 1(c)). Protein-protein interaction occurs when two or more proteins bind together, either transiently to modify one another or to trigger signal transduction, or for a long time to form a protein complex to carry out certain biological functions.
PPI databases
Protein-protein interactions play essential roles in almost all cellular functions, and hence significant efforts have been made to assemble protein interaction maps in the cells. HPRD (Human Protein Reference Database, http://www.hprd.org/)24, DIP (Database of Interacting Proteins, http://dip.doe-mbi.ucla.edu/)25, MINT (Molecular INTeraction database,http://mint.bio.uniroma2.it)26, IntAct (http://www.ebi.ac.uk/intact/)27 and BioGRID (Biological General Repository for Interaction Datasets, http://thebiogrid.org)28 are examples of publicly accessible resources that catalog experimentally determined and scientific literature reported interactions between proteins.
Besides experimental means to interrogate protein-protein interactions, computational approaches have also proven to be powerful tools to predict PPIs. For example, STRING (http://string-db.org/) is a database including both experimentally determined and predicted protein-protein interactions, which include direct (physical) and indirect (functional) associations, derived from genomic context, high-throughput experiments, conserved co-expression and previous knowledege29. Recently, a new algorithm, PrePPI, was proposed to use three-dimensional structural information to predict PPIs with good accuracy and coverage30. The predicted PPIs by PrePPI are available at http://bhapp.c2b2.columbia.edu/PrePPI/.
Biological network models
Generally speaking, there are two ways to obtain biological network structures: one is to retrieve network interactions from databases as aforementioned; the other is to infer the network topology and model their interactions directly from experimental data.
Network representation and notations
Mathematically, a network (also called a graph) is a representation of a set of objects connected by links, denoted by G. The objects in a graph are called vertices or nodes, and the links are termed edges. We define the vertex set V and edge set E, and the graph is then represented by an ordered pair G = (V,E).
One of the mathematical ways to represent a graph structure is using an adjacency matrix A. In a graph of p vertices, the adjacency matrix is a p × p matrix, where an entry aij = 1 indicates an edge from node i to node j and aij = 0 otherwise. In most biological networks, adjacency matrices are very sparse, which means most entries are zeros and each node is only connected to a small number of nodes in the network. If the edges in E have directions associated with them, the graphG is called a directed graph. On the contrary, if an edge from node i to node j is equivalent to an edge from node j to node i, the graph G is an undirected graph and in this case, the adjacency matrix A is a symmetric matrix.
Statistical and dynamical network models
In this subsection, we describe several statistical and mathematical network models widely used in biological network inference. By and large, network models fall into two major categories: statistical models and dynamical models. Statistical models characterize the interdependence of nodes in the graph using some statistical dependence measures or their joint probability distributions. These models reflect statistical associations independent of time. Some examples of statistical models include correlation networks, mutual-information networks and probabilistic graphical models. On the other hand, dynamical models characterize mathematical rules that describe the time-dependent transition of one cellular state to the next. Ordinary differential equations, stochastic differential equations, state space models and probabilistic Boolean networks belong to this category.
Correlation networks and mutual information-based networks
Correlation networks and mutual information-based networks are inferred from biological data by evaluating the expression patterns between every pairs or every triples of nodes using similarity criteria like correlation coefficients, partial correlation and mutual information (Figure 2(a)). Both correlation coefficients and mutual information are symmetric, and therefore, the resulting networks are undirected. The connections inferred in these types of networks only indicate statistical associations, and do not imply causal relationships among these nodes.
Figure 2.
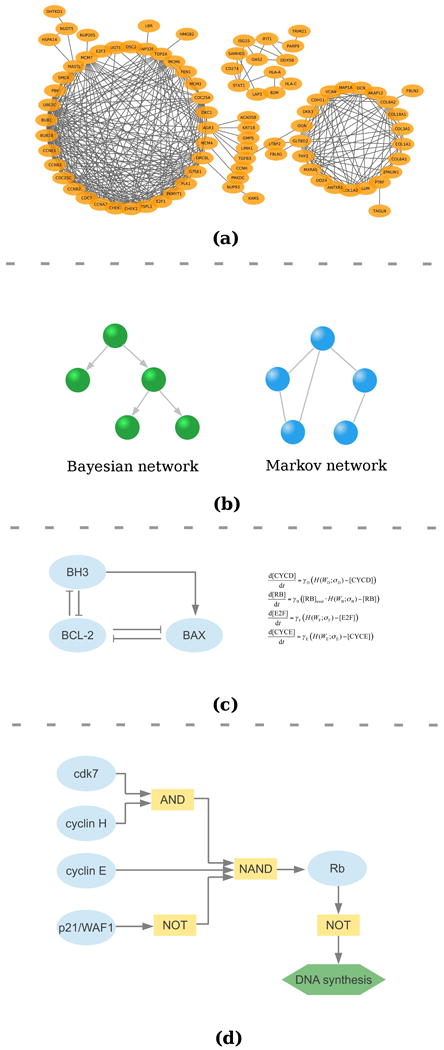
(a) An example of a co-expression network. (b) A Bayesian network and a Markov network. (c) An example of ODE network31. (d) A Boolean network32.
A correlation network, also called a gene co-expression network, is a weighted network where each edge is associated with a value – the correlation coefficient between the two random variables. Pearson's correlation is the most widely used similarity measure in correlation networks, while robust alternatives like Spearman's correlation are used as well.
A simple and straightforward way to construct a correlation network is to first compute the correlation coefficients of all pairs of nodes and then set up an appropriate threshold to determine the presence or absence of an edge. Weighted correlation network analysis (WGCNA) generalizes such an approach33. Instead of using a hard threshold, WGCNA employs an adjacency function that assigns a weight to each edge to “soft-threshold” the correlation coefficients. Dewey et al. constructed a co-expression network using myocardial transcript data, analyzed the network topological features, and identified gene co-expression modules related to cardiac development, hypertrophy and failure34.
de la Fuenta, et al proposed to use partial correlation to construct gene regulatory networks. Partial correlation measures the degree of association between two random variables, independent of the third variable35. Therefore, this approach is able to remove indirect connections with relatively strong correlation due to a third intermediate variable. Qiu,et al used dependence models and their eigenvalue patterns to explore the dependence relationships of every three proteins (or genes), from which a dependence network is constructed36.
Since Pearson's correlation only captures linear relationships between genes, some researchers proposed to use information-theoretic approaches, such as mutual information, to detect similarity between nodes. Mutual information is flexible to model nonlinear relationships. ARACNE (Algorithm for the Reconstruction of Accurate Cellular Networks) exemplifies such an information theoretic approach37. Given a set of observations, {xi, yi}, of random variables X, Y, their joint probability and marginal distributions are approximated by a Gaussian kernel estimator, and the mutual information of X, Y is then estimated. The threshold is determined by randomly shuffling the samples to create a “null” distribution of the mutual information and select the threshold value at the given α. A final step is to use data processing inequality to trim edges.
Further, Reverter, et al proposed PCIT algorithm to combine the partial correlation and information theory (data processing inequality) approaches to infer co-expression networks38. Instead of using a stringent global threshold as in ARACNE, PCIT algorithm uses local thresholds for every trio of genes, making it able to capture some significant associations even when their correlation or mutual information is not very strong.
Several recent developments in statistics are promising new association measures to infer linear and nonlinear relationships in biological networks from noisy data sets. Zero Pearson's correlation between two random variables does not imply independence, because it only captures linear relationship. Distance correlation was introduced to address this deficiency of Pearson's correlation, where it is zero if and only if the random variables are independent39. In addition, Reshef, et al recently proposed a new measure of dependence for pairwise relationships – the maximal information coefficient (MIC)40. MIC is rooted in maximal information-based nonparametric exploration statistics, and is able to capture linear, nonlinear and even non-functional associations in the data. Another nice property of MIC and distance correlation is that their values fall in the range [0, 1], similar to coefficient of determination (R2) in the regression case, whereas mutual information itself does not have a standard range.
Probabilistic graphical models
Probabilistic graphical models are diagrammatic representations of probability distributions for a set of random variables (Figure 2(b)). In a probabilistic graphical model, each node represents a random variable (or a group of random variables), and edges (either directed or undirected) express dependent relationships between these variables.
Two features of probabilistic graphical models made them very suitable for modeling biological networks. First, because biological data are very noisy, the probabilistic nature of graphical models automatically takes into account the noise in the data and intrinsic uncertainties in the models. Second, diagrammatic representations of graphical models naturally visualize the relationships of genes, which can facilitate new insights and motivate new biological hypotheses.
Typical examples of probabilistic graphical models are Bayesian networks (directed graphs) and Markov networks (undirected graphs). Probabilistic graphical models are widely used in many fields, such as computer vision, natural language processing and artificial intelligence. The structure of a graphical model encodes how the joint probability distribution is decomposed using their conditional independence relationships. In a Bayesian network, the joint distribution is decomposed into
| (1) |
where pai is the set of parent nodes of Xi.
In a Markov network, also referred to as a Markov random field, the joint distribution is expressed as
| (2) |
where XC is a clique in the graph (a subset of vertices in which every two vertices are connected), fC(XC) is a potential function over the clique XC, and Z is a normalizing factor. A special case of a Markov network is a Gaussian graphical model, where the distribution of the variables in the graph is assumed to be multivariate Gaussian41.
Learning graphical models from data includes two major (and sometimes iterative) steps: structural learning and parameter estimation. Structural learning is to infer the most likely interdependent and independent relationships of these variables, while parameter learning is to estimate the parameters that specify the distribution, P(X1, X2,…Xp), of the random variables encoded by the graphical model. In biological networks, learning network structures is of particular interest, and yet is a challenging task.
Unfortunately, learning the exact structure of a Bayesian network is a NP-complete problem42. Therefore, it is computationally infeasible to infer an exact Bayesian network on a large number of variables. One approach proposed by Segal et al was the module network43. In a module network, to alleviate the computational problems, highly correlated variables are clustered and partitioned into modules, and the variables in each module share the same parents and the same conditional probability distribution. There are also heuristic algorithms for approximate Bayesian network structure learning, for example, using dynamic programming and Markov Chain Monte Carlo (MCMC) method44,45.
Since each node in a biological network only connects to a small fraction of nodes in the network, sparse constraints are often applied to network structure learning. Recently, l1-regularization has attracted great interest in statistics and machine learning communities. The sparsity of l1-regularization refers to the fact that the l1-norm constraint tends to make some coefficients exactly zeros, leading to a parsimonious solution and naturally performing variable selection. Representative examples of this class of algorithms include lasso46, elastic net47 and Dantzig selector48. For example, Lee, et al converted the Markov network learning problem into a convex optimization problem, which can be solved using efficient gradient methods49. Schmidt et al extended l1-regularization-based algorithm to Bayesian network learning50. On the algorithmic side, several efficient algorithms have been proposed to solve optimization problems with l1 constraint51. On the theoretical side, it has been shown that lasso-type algorithm asymptotically recovers the true sparse pattern52, and in Gaussian graphical models, l1-regularization-based algorithm selects correct neighboring nodes asymptotically53.
Ordinary differential equations and stochastic differential equations
In physics, chemistry and engineering systems, ordinary differential equations (ODEs) and state-space models are fundamental modeling tools (Figure 2(c)). These models are very different in nature from statistical models like correlation networks and Bayesian networks we discussed previously. They characterize the dynamics of the levels of biomolecules in biological systems as functions of time: how their concentrations change along the time course. Mathematically, in a network of p nodes, the expression levels (or concentrations) of these p nodes at time t are represented by X1(t), X2(t),…, Xp(t). As t increases, the dynamics of X1(t), X2(t),…, Xp(t) in the system is modeled by
| (3) |
where i = 1, 2,…, p and u(t) is an optional external input to the network. The argument variables of fi(·) determine the parent nodes of Xi in the network and the form and parameters of fi(·) dictate the temporal evolution of the system.
In simple organisms like yeast, ODEs have proven to be a very useful tool to model and predict the dynamical properties and interactions of various biomolecules54. Recently, ODEs have been applied to characterizing estrogen signaling in breast cancer with very promising results31. There are alternative representations of ODEs for dynamical systems. For example, a state space model, widely used in control systems, characterizes a dynamical system by a set of first-order differential equations on state, input, output variables55. Additionally, in biochemical systems theory, the S-system, an alternative mathematical model for dynamical biochemical systems, represents the biological network as a set of differential equations56.
Biological systems are inherently stochastic with randomness originated from diverse sources including biological noise in transcription, translation and network signaling, measurement inaccuracies and heterogeneity of cell populations 57. Stochastic differential equations (SDEs) have been interrogated and applied extensively as an important mathematical tool for modeling biological systems. For example, Chen et al. used SDEs to characterize the mRNA dynamic transcription and degradation process, where the noise in the biological system and other sources of uncertainties were jointly formulated as the standard Brownian motion58. When applying this SDE model to Saccharomyces cerevisiae cell cycle data, the predictions of the model agree well with the observed expression pattern, illustrating the great potential of this approach.
Probabilistic Boolean networks
Probabilistic Boolean networks are another class of dynamical models for characterizing biological networks (Figure 2(d)). The first Boolean network for genetic networks was proposed by S. A. Kauffman in 196959. At that time, the Boolean networks were used as a theoretical model to inquire the complex dynamical behavior of a biological system. Recent developments in high-throughput molecular profiling technologies reignite the interest in this model.
The values of each node, X1(t), X2(t),…, Xp(t), in a Boolean network is discrete, usually binary {0, 1} (in some cases tertiary {−1, 0, 1}). Therefore, it is often necessary to discretize the acquired biological data, which are continuous in their original measurement space. For node i, the Boolean network defines the state transition and the state at time t + 1 based on the states of X1(t), X2(t),…, Xp(t) at time t
| (4) |
where fi(·) is a Boolean function and u(t) is an optional input to the network, defined by a combination of simple Boolean operations like AND, OR and NOT or a truth table (a rule-based table used in Boolean logic).
Shmulevich et al. extended Boolean networks to probabilistic Boolean networks (PBNs), which share the rule-based properties of Boolean networks and incorporate probabilistic characteristics into their transition functions32. The major difference of PBNs from conventional Boolean networks is that it allows for more than one transition function for each node and the selection of each transition function is associated with a probability. Therefore, the dynamics of a PBN is equivalent to a discrete-time, discrete-state Markov chain.
Similar to ODEs and SDEs, PBNs model the temporal dynamics of biological systems and require time course data for model inference. For population-based data, correlation networks, mutual information-based networks, and probabilistic graphical models are often better choice for characterizing the statistical associations of biological variables. Due to the complexity of learning many parameters in dynamical models from limited time-series samples, current application of ODEs, SDEs, and PBNs mostly deals with focused sub-networks instead of constructing a global, genome-wide network.
Integrated network inference – bridging the gap between prior knowledge and experimental data
Above we briefly reviewed two general approaches to obtain and construct biological networks for data analysis by (1) retrieving prior knowledge of physical interactions in biological databases and (2) inferring network models directly from high-throughput experimental data. These two approaches are complementary in nature. Biological interactions identified experimentally are often designed to detect true physical interactions and causal relationships. However, biological databases are neither disease-specific nor condition-specific, they are accumulated evidence from diverse experimental settings. Mathematical network models and interactions inferred from data are specific to the experiment in which the data are generated, but are often limited by small sample size and do not guarantee physical interactions.
Werhli and Husmeier used a Bayesian approach to reconstruct gene regulatory network by integrating expression data with multiple sources of prior knowledge60. Each source of the prior knowledge is encoded via a separate energy function, from which a prior distribution over network structures is constructed. Similarly, Mukherjee and Speed proposed Bayesian network inference using informative priors61. The prior distributions on graphs are able to capture different types of information on the network structures including edges, classes of edges, degree distributions and sparsity.
CNORfeeder is a computational approach to integrate literature-constrained and data-driven methods to infer signaling networks62. This method extends a data-driven network model as discussed in Section 3, and uses information on physical interactions of proteins to guide and validate the integration of links.
Recently, Tian et al proposed an effective approach to incorporate biological prior knowledge into the network learning algorithm through re-weighting the penalties for the potential connections in the network63. To minimize the adverse effects of false positive edges induced by directly incorporating imperfect and non-specific prior knowledge in specific problems, the prior knowledge incorporation scheme carefully evaluates and controls the impact of false positives in the prior knowledge on the network inference results, and automatically selects the “optimal” degree of information fusion between the evidence in the prior knowledge and the evidence in the data. On the other hand, the algorithm can still identify novel connections between genes without prior knowledge if there is strong evidence in the data supportive of these connections, making it capable of gaining new biological knowledge and insights from experimental data.
Network visualization and network analysis
Biological networks, either built with interactions from biological databases, or inferred from data, or constructed by integrating different sources, give rise to novel and informative network-based analysis and provide new insights into biological systems. In this section, we review a few examples of these computational approaches to demonstrate the effectiveness and usefulness of network-based methods. Network-based analysis is still a very active research area in bioinformatics, and the methods we discuss here are only a tip of the vast literature in this area.
Network visualization
Biological networks are useful representations to visualize and understand the functions and interactions of biomolecules. Many software tools have been developed to make network visualization easy, intuitive and interactive. Cytoscape is an excellent example of versatile network visualization platforms and has gained tremendous popularity in network biology research community64 (http://www.cytoscape.org/). Cytoscape is a cross-platform, open source Java application and supports major network file formats. It is very flexible and powerful to integrate and visualize different layers of genomic and proteomic information on the networks by customizing node and edge properties and network layouts. Cytoscape also provides application programming interface (API) for bioinformaticians and software developers to implement their network analysis algorithms and integrate them with Cytoscape. Cytoscape App Store is a central repository for all publicly available plugins known to the Cytoscape development team65.
VisANT is online visualization tool based on Java Applet, which integrates, mines and displays hierarchical information in biological networks and pathways66 (http://visant.bu.edu/). Two prominent features of VisANT are: (1) it is web-based application with user-friendly interface; (2) it provides data integration services driven by the Predictome database. NetGestalt (http://www.netgestalt.org) is another network visualization web application by exploiting the hierarchical architecture of a biological network and provides an easy online tool to integrate large-scale, multi-platform data on a one-dimensional layout of the genes67. NetGestalt aligns the nodes of a network along the horizontal dimension based on the network hierarchical structure, and makes it possible to visualize additional data sources and prior knowledge as custom data / annotation tracks.
Hive plots provide an alternative approach to visualize large networks, which often appear like “hairballs” using traditional network layouts. In a hive plot, nodes are placed on radially oriented linear axes, and the axis (or axis segment) assignment and the coordinates of nodes can be determined by various network structural parameters (e.g. connectivity, clustering coefficient, etc.) and user-defined rules. After the axis assignment and the coordinates of the nodes are computed, the edges are drawn as curves connecting corresponding nodes. There are several software packages for creating Hive plots, such as a Perl script (http://www.hiveplot.net/), an R package HiveR (http://academic.depauw.edu/∼hanson/HiveR/HiveR.html), and a Java application JHIVE (http://www.bcgsc.ca/wiki/display/jhive/home).
Analysis of topological features in biological networks
Network theory studies non-trivial topological features in networks, and local and global structural features of biological networks reveal properties of the biological systems beyond single genes and single interactions.
Network motifs refer to recurring circuits of interactions in biological networks, exhibiting patterns such as negative autoregulation, positive autoregulation, feedforward loops, single-input modules and dense overlapping regulons5. Recent network analysis of ENCODE data also found similar network motifs in human transcriptional networks10.
In network theory, the importance of a node is often characterized by measures of the centrality of the node. For example, the degree of a node is the number of links connected to and from this node; betweenness centrality is the number of times a node acts as a bridge along the shortest path between two other nodes. Dysfunction of a gene with high degree or high betweenness implies more drastic impacts on neighboring nodes and the network as a whole.
Global analysis of a biological network deals with network properties such as the distributions of the connections in networks. For example, the degree of nodes in a scale-free network follows a power law distribution. A feature of a scale-free biological network is that some “hub” genes connect some dense sub-graphs, implying their functional importance.
The structural features of biological networks provide another dimension and a biologically meaningful context to interrogate these otherwise isolated genes. For example, Jin et al. used protein-protein interactions from HPRD, signaling pathways from KEGG and protein annotations to build a cardiovascular-related network, and identified network biomarkers for major adverse cardiac events68. Zhang et al. defined six network features, namely degree, neighbor count of disease genes, ratio of disease genes in neighbor, betweenness centrality, clustering coefficient, and mean shortest path length to disease gene, and trained a support vector machine classifier to predict candidate genes for coronary artery disease69.
Differential network analysis
Biological networks are context-specific and dynamic in nature. Under different conditions, different regulatory components and mechanisms are activated and the topology of the underlying biological network changes accordingly (Figure 3). For example, in response to diverse conditions in the yeast, transcription factors alter their interactions and rewire the signaling networks70.
Figure 3.
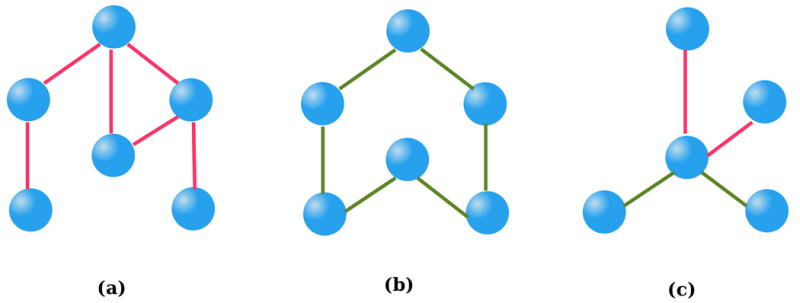
(a) Network structure under condition 1. (b) Network structure under condition 2. (c) The differential network.
It is important to focus on the topological changes in biological networks between disease and normal conditions, or across different stages of cell development. For example, a deviation from normal regulatory network topology may reveal the mechanism of pathogenesis, and the genes that undergo the most network topological changes may serve as biomarkers for the disease state or as targets for drug discovery or therapeutic intervention. Differential network analysis can also help identify key genetic players or disease markers. Differential network biology has become an active research area in recent years71.
Bandyopadhyay et al showed that widespread changes in genetic interaction among yeast kinases, phosphatases, and transcription factors as the cell responds to DNA damage using the technique of epistatic miniarray profiles (E-MAP) and differential epistasis mapping72. In a breast cancer study, time course data on signaling networks, gene expression, and cell phenotypic responses demonstrated that sequential application of anticancer drugs rewired apoptotic signaling networks and enhanced cell death73.
Some computational methods have been proposed to learn condition-specific biological networks. Zhang et al proposed a differential dependency network analysis to detect statistically significant network rewiring in biological networks and pinpoint the key genes involved in network topological changes74,75. Further, an efficient learning algorithm was proposed to jointly infer condition-specific network topology between two conditions using l1-regularization based convex optimization and the block coordinate descent algorithm76.
Network enrichment and pathway impact analysis
Next-generation sequencing technologies and high-throughput genotyping arrays are capable of detecting many novel germline and somatic mutations. An important and yet challenging task is to understand the functional implications of these genomic alterations. Network enrichment analysis and pathway impact analysis provide network and functional contexts to these aberrations and help discern random passenger mutations from (sometimes low-prevalence) driver mutations.
HotNet is an effective computational approach to identify statistically significant subnetworks (connected subnetworks whose genes have more mutations than expected by chance) in disease studies77. Network structures in the analysis can be PPI networks or signaling pathways retrieved from databases. Then the method defines a local neighborhood of “influence” for each mutated gene in the network, and uses a two-stage multiple hypothesis test to estimate the false discovery rate (FDR) associated with the identified subnetworks.
PARADIGM (PAthway Recognition Algorithm using Data Integration on Genomic Models) is a method for inferring patient-specific genetic activities incorporating curated pathway interactions78. Each pathway is converted into a distinct probabilistic model, which is a factor graph with variable nodes describing the states of entities in a cell (DNA, mRNA or proteins, etc). The method predicts the degree to which a pathway's activities are altered using genomic data. An extension of this approach is PARADIGM-SHIFT, which predicts whether a mutational event is neutral, gain- or loss-of-function in a tumor sample79.
Network simulations and attractors in the biological networks
Dynamical models such as ODEs, state-space models and probabilistic Boolean networks are very amicable for numerical simulation of temporal patterns of a biological system. Biological networks that drive biological decision processes are highly dynamic. By perturbing the biological systems or in silico knocking down certain nodes, these biological networks may attract cells to new signaling and phenotypic states, which are termed network attractors80.
Barik et al used a dynamical model consisting of 60 differential equations and 71 kinetic parameters to characterize yeast cell-cycle regulation81. In the study, to understand the molecular fluctuations on cell-cycle progression in budding yeast cells, this ODE model was simulated both deterministically and stochastically and the simulation results indicated the bistable switching behavior on which proper cell-cycle progression depends. This line of research was further extended to more complex systems. Tyson et al proposed to use ODE network models to study the decision circuits in breast cancer cells, and network simulations can help reveal estrogen signaling mechanisms and shed light on breast cancer susceptibility and resistance to endocrine therapy31.
Probabilistic Boolean networks are also very useful in identifying attractors in disease networks. Simulations of PBNs are equivalent to simulating discrete Markov chains, which will settle into one of a collection of state cycles when running for a long time. The steady-state probabilities of the attractors reveal how perturbations or intervention alter the long-term network states82.
Conclusions and future perspectives
In this review, we briefly discussed biological databases, statistical and dynamical network models and computational approaches for biological network modeling and analysis. Network biology is a new paradigm to understand the complex interactions of the molecules in the cells using an integrative and systems approach. The rapid developments in data acquisition, network models and computational tools make network biology a very promising approach in biology and medicine.
Despite rapid advances in genomic and proteomic technologies and the increasing availability of large biological data sets, network inference from experimental data remains very challenging. Effective network inference algorithms need to address the so-called “large ‘p’, small ‘n’” problems, in which the number of variables and parameters in a biological system is orders of magnitude larger than the number of samples collected. To constrain the solution space and avoid overfitting, biological prior knowledge, parsimonious models (Occam's razor) and statistical methods like cross validation and regularization may be applicable.
Biological networks are very dynamic. The dynamics of biological networks are two-folds: (1) the dynamic structures of the networks, and (2) the dynamics of the temporal patterns produced by the networks. The dynamic nature of the biological networks ensures the adaptability, robustness and flexibility of the biological systems. But this dynamic nature often makes the network model unidentifiable. We are often exposed to only a single snapshot of the biological network, and due to limited experimental conditions, the biological systems are not “perturbed” enough to exhibit all possible dynamic behaviors. How to derive a “personalized” biological network and infer the temporal activation patterns of the network remains an open problem.
Finally, mathematical modeling and biological experiments in network biology is an iterative process. The mathematical models learned from data are used to make predictions and generate new hypotheses. And these models and their predictions need to be rigorously tested and evaluated by carefully designed biological experiments.
Acknowledgments
Funding Sources: This work was supported by grant U24CA160036, from the National Cancer Institute Clinical Proteomic Tumor Analysis Consortium (CPTAC), and grants NIH/NINDS R01NS29525, NIH/NCI U54CA149147, NIH/NHLBI R01HL111362.
Footnotes
Conflict of Interest Disclosures: None.
References
- 1.Clarke R, Ressom HW, Wang A, Xuan J, Liu MC, Gehan EA, et al. The properties of high-dimensional data spaces: implications for exploring gene and protein expression data. Nat Rev Cancer. 2008;8:37–49. doi: 10.1038/nrc2294. [DOI] [PMC free article] [PubMed] [Google Scholar]
- 2.Bell G, Hey T, Szalay A. Beyond the data deluge. Science. 2009;323:1297–1298. doi: 10.1126/science.1170411. [DOI] [PubMed] [Google Scholar]
- 3.Furlong L. Human diseases through the lens of network biology. Trends Genet. 2012;29:150–159. doi: 10.1016/j.tig.2012.11.004. [DOI] [PubMed] [Google Scholar]
- 4.Barabási AL, Gulbahce N, Loscalzo J. Network medicine: a network-based approach to human disease. Nat Rev Genet. 2011;12:56–68. doi: 10.1038/nrg2918. [DOI] [PMC free article] [PubMed] [Google Scholar]
- 5.Alon U. Network motifs: theory and experimental approaches. Nat Rev Genet. 2007;8:450–461. doi: 10.1038/nrg2102. [DOI] [PubMed] [Google Scholar]
- 6.Lusis AJ, Weiss JN. Cardiovascular networks: systems-based approaches to cardiovascular disease. Circulation. 2010;121:157–170. doi: 10.1161/CIRCULATIONAHA.108.847699. [DOI] [PMC free article] [PubMed] [Google Scholar]
- 7.Arrell DK, Terzic A. Systems proteomics for translational network medicine. Circ Cardiovasc Genet. 2012;5:o9–o16. doi: 10.1161/CIRCGENETICS.110.958991. [DOI] [PMC free article] [PubMed] [Google Scholar]
- 8.Diez D, Wheelock AM, Goto S, Haeggström JZ, Paulsson-Berne G, Hansson GK, et al. The use of network analyses for elucidating mechanisms in cardiovascular disease. Mol Biosyst. 2010;6:289–304. doi: 10.1039/b912078e. [DOI] [PubMed] [Google Scholar]
- 9.Mayr M. From data gathering to systems medicine. Cardiovasc Res. 2013;97:599–600. doi: 10.1093/cvr/cvt017. [DOI] [PMC free article] [PubMed] [Google Scholar]
- 10.Gerstein MB, Kundaje A, Hariharan M, Landt SG, Yan KK, Cheng C, et al. Architecture of the human regulatory network derived from ENCODE data. Nature. 2012;489:91–100. doi: 10.1038/nature11245. [DOI] [PMC free article] [PubMed] [Google Scholar]
- 11.Vaquerizas JM, Kummerfeld SK, Teichmann Sa, Luscombe NM. A census of human transcription factors: function, expression and evolution. Nat Rev Genet. 2009;10:252–263. doi: 10.1038/nrg2538. [DOI] [PubMed] [Google Scholar]
- 12.Robertson KD. DNA methylation and human disease. Nat Rev Genet. 2005;6:597–610. doi: 10.1038/nrg1655. [DOI] [PubMed] [Google Scholar]
- 13.Bannister AJ, Kouzarides T. Regulation of chromatin by histone modifications. Cell Res. 2011;21:381–395. doi: 10.1038/cr.2011.22. [DOI] [PMC free article] [PubMed] [Google Scholar]
- 14.Filipowicz W, Bhattacharyya SN, Sonenberg N. Mechanisms of post-transcriptional regulation by microRNAs: are the answers in sight? Nat Rev Genet. 2008;9:102–114. doi: 10.1038/nrg2290. [DOI] [PubMed] [Google Scholar]
- 15.Dunham I, Kundaje A, Aldred SF, Collins PJ, Davis Ca, Doyle F, et al. An integrated encyclopedia of DNA elements in the human genome. Nature. 2012;489:57–74. doi: 10.1038/nature11247. [DOI] [PMC free article] [PubMed] [Google Scholar]
- 16.Whitfield TW, Wang J, Collins PJ, Partridge EC, Aldred SF, Trinklein ND, et al. Functional analysis of transcription factor binding sites in human promoters. Genome Biol. 2012;13:R50. doi: 10.1186/gb-2012-13-9-r50. [DOI] [PMC free article] [PubMed] [Google Scholar]
- 17.Matys V, Kel-Margoulis OV, Fricke E, Liebich I, Land S, Barre-Dirrie A, et al. TRANSFAC and its module TRANSCompel: transcriptional gene regulation in eukaryotes. Nucleic Acids Res. 2006;34:D108–D110. doi: 10.1093/nar/gkj143. [DOI] [PMC free article] [PubMed] [Google Scholar]
- 18.Sandelin A, Alkema W, Engström P, Wasserman WW, Lenhard B. JASPAR: an open-access database for eukaryotic transcription factor binding profiles. Nucleic Acids Res. 2004;32:D91–D94. doi: 10.1093/nar/gkh012. [DOI] [PMC free article] [PubMed] [Google Scholar]
- 19.Kanehisa M, Goto S, Hattori M, Aoki-Kinoshita KF, Itoh M, Kawashima S, et al. From genomics to chemical genomics: new developments in KEGG. Nucleic Acids Res. 2006;34:D354–D357. doi: 10.1093/nar/gkj102. [DOI] [PMC free article] [PubMed] [Google Scholar]
- 20.Matthews L, Gopinath G, Gillespie M, Caudy M, Croft D, de Bono B, et al. Reactome knowledgebase of human biological pathways and processes. Nucleic Acids Res. 2009;37:D619–D622. doi: 10.1093/nar/gkn863. [DOI] [PMC free article] [PubMed] [Google Scholar]
- 21.Cerami EG, Gross BE, Demir E, Rodchenkov I, Babur O, Anwar N, et al. Pathway Commons, a web resource for biological pathway data. Nucleic Acids Res. 2011;39:D685–D690. doi: 10.1093/nar/gkq1039. [DOI] [PMC free article] [PubMed] [Google Scholar]
- 22.Kelder T, van Iersel MP, Hanspers K, Kutmon M, Conklin BR, Evelo CT, et al. WikiPathways: building research communities on biological pathways. Nucleic Acids Res. 2012;40:D1301–D1307. doi: 10.1093/nar/gkr1074. [DOI] [PMC free article] [PubMed] [Google Scholar]
- 23.Krämer A, Green J, Pollard J, Tugendreich S. Causal analysis approaches in Ingenuity Pathway Analysis. Bioinformatics. 2014;30:523–530. doi: 10.1093/bioinformatics/btt703. [DOI] [PMC free article] [PubMed] [Google Scholar]
- 24.Keshava Prasad TS, Goel R, Kandasamy K, Keerthikumar S, Kumar S, Mathivanan S, et al. Human Protein Reference Database–2009 update. Nucleic Acids Res. 2009;37:D767–D772. doi: 10.1093/nar/gkn892. [DOI] [PMC free article] [PubMed] [Google Scholar]
- 25.Salwinski L, Miller CS, Smith AJ, Pettit FK, Bowie JU, Eisenberg D. The Database of Interacting Proteins: 2004 update. Nucleic Acids Res. 2004;32:D449–D451. doi: 10.1093/nar/gkh086. [DOI] [PMC free article] [PubMed] [Google Scholar]
- 26.Ceol A, Chatr Aryamontri A, Licata L, Peluso D, Briganti L, Perfetto L, et al. MINT, the molecular interaction database: 2009 update. Nucleic Acids Res. 2010;38:D532–D539. doi: 10.1093/nar/gkp983. [DOI] [PMC free article] [PubMed] [Google Scholar]
- 27.Kerrien S, Aranda B, Breuza L, Bridge A, Broackes-Carter F, Chen C, et al. The IntAct molecular interaction database in 2012. Nucleic Acids Res. 2012;40:D841–D846. doi: 10.1093/nar/gkr1088. [DOI] [PMC free article] [PubMed] [Google Scholar]
- 28.Chatr-Aryamontri A, Breitkreutz BJ, Heinicke S, Boucher L, Winter A, Stark C, et al. The BioGRID interaction database: 2013 update. Nucleic Acids Res. 2013;41:D816–D823. doi: 10.1093/nar/gks1158. [DOI] [PMC free article] [PubMed] [Google Scholar]
- 29.Franceschini A, Szklarczyk D, Frankild S, Kuhn M, Simonovic M, Roth A, et al. STRING v9.1: protein-protein interaction networks, with increased coverage and integration. Nucleic Acids Res. 2013;41:D808–D815. doi: 10.1093/nar/gks1094. [DOI] [PMC free article] [PubMed] [Google Scholar]
- 30.Zhang Q, Petrey D, Deng L, Qiang L, Shi Y. Structure-based prediction of protein-protein interactions on a genome-wide scale. Nature. 2012;490:556–560. doi: 10.1038/nature11503. [DOI] [PMC free article] [PubMed] [Google Scholar]
- 31.Tyson J, Baumann W, Chen C. Dynamic modelling of oestrogen signalling and cell fate in breast cancer cells. Nat Rev Cancer. 2011;11:523–532. doi: 10.1038/nrc3081. [DOI] [PMC free article] [PubMed] [Google Scholar]
- 32.Shmulevich I, Dougherty ER, Kim S, Zhang W. Probabilistic Boolean Networks: a rule-based uncertainty model for gene regulatory networks. Bioinformatics. 2002;18:261–274. doi: 10.1093/bioinformatics/18.2.261. [DOI] [PubMed] [Google Scholar]
- 33.Langfelder P, Horvath S. WGCNA: an R package for weighted correlation network analysis. BMC Bioinformatics. 2008;9:559. doi: 10.1186/1471-2105-9-559. [DOI] [PMC free article] [PubMed] [Google Scholar]
- 34.Dewey FE, Perez MV, Wheeler MT, Watt C, Spin J, Langfelder P, et al. Gene coexpression network topology of cardiac development, hypertrophy, and failure. Circ Cardiovasc Genet. 2011;4:26–35. doi: 10.1161/CIRCGENETICS.110.941757. [DOI] [PMC free article] [PubMed] [Google Scholar]
- 35.De la Fuente A, Bing N, Hoeschele I, Mendes P. Discovery of meaningful associations in genomic data using partial correlation coefficients. Bioinformatics. 2004;20:3565–3574. doi: 10.1093/bioinformatics/bth445. [DOI] [PubMed] [Google Scholar]
- 36.Qiu P, Wang ZJ, Liu KJR, Hu ZZ, Wu CH. Dependence network modeling for biomarker identification. Bioinformatics. 2007;23:198–206. doi: 10.1093/bioinformatics/btl553. [DOI] [PubMed] [Google Scholar]
- 37.Margolin A, Nemenman I. ARACNE: an algorithm for the reconstruction of gene regulatory networks in a mammalian cellular context. BMC Bioinformatics. 2006;7:S7. doi: 10.1186/1471-2105-7-S1-S7. [DOI] [PMC free article] [PubMed] [Google Scholar]
- 38.Reverter A, Chan EKF. Combining partial correlation and an information theory approach to the reversed engineering of gene co-expression networks. Bioinformatics. 2008;24:2491–2497. doi: 10.1093/bioinformatics/btn482. [DOI] [PubMed] [Google Scholar]
- 39.Kosorok MR. On Brownian Distance Covariance and High Dimensional Data. Ann Appl Stat. 2009;3:1266–1269. doi: 10.1214/09-AOAS312. [DOI] [PMC free article] [PubMed] [Google Scholar]
- 40.Reshef D, Reshef Y, Finucane H. Detecting novel associations in large data sets. Science. 2011;334:1518–1524. doi: 10.1126/science.1205438. [DOI] [PMC free article] [PubMed] [Google Scholar]
- 41.Wainwright MJ, Jordan MI. Graphical Models, Exponential Families, and Variational Inference. Found Trends® Mach Learn. 2007;1:1–305. [Google Scholar]
- 42.Chickering DM. Learn from Data Artif Intell Stat V. Springer-Verlag; 1996. Learning Bayesian Networks is NP-Complete; pp. 121–130. [Google Scholar]
- 43.Segal E, Shapira M, Regev A, Pe'er D, Botstein D, Koller D, et al. Module networks: identifying regulatory modules and their condition-specific regulators from gene expression data. Nat Genet. 2003;34:166–176. doi: 10.1038/ng1165. [DOI] [PubMed] [Google Scholar]
- 44.Eaton D, Murphy K. Bayesian structure learning using dynamic programming and MCMC. Proc Conf Uncertain Artif Intell. 2007:101–108. [Google Scholar]
- 45.Grzegorczyk M, Husmeier D, Edwards KD, Ghazal P, Millar AJ. Modelling non-stationary gene regulatory processes with a non-homogeneous Bayesian network and the allocation sampler. Bioinformatics. 2008;24:2071–2078. doi: 10.1093/bioinformatics/btn367. [DOI] [PubMed] [Google Scholar]
- 46.Tibshirani R. Regression shrinkage and selection via the lasso. J R Stat Soc Ser B. 1996;58:267–288. [Google Scholar]
- 47.Zou H, Hastie T. Regularization and variable selection via the elastic net. J R Stat Soc Ser B. 2005;67:301–320. [Google Scholar]
- 48.Candes E, Tao T. The Dantzig selector: Statistical estimation when p is much larger than n. Ann Stat. 2007;35:2313–2351. [Google Scholar]
- 49.Lee S, Ganapathi V, Koller D. Efficient Structure Learning of Markov Networks using L1-Regularization. Adv Neural Inf Process Syst. 2006:817–824. [Google Scholar]
- 50.Schmidt M, Niculescu-Mizil A, Murphy K. Learning graphical model structure using L1-regularization paths. Proc 22nd Natl Conf Artif Intell; pp. 1278–1283. [Google Scholar]
- 51.Efron B, Hastie T. Least angle regression. Ann Stat. 2004;32:407–499. [Google Scholar]
- 52.Zhao P, Yu B. On model selection consistency of Lasso. J Mach Learn Res. 2006;7:2541–2563. [Google Scholar]
- 53.Meinshausen N, Bühlmann P. High-dimensional graphs and variable selection with the Lasso. Ann Stat. 2006;34:1436–1462. [Google Scholar]
- 54.Kar S, Baumann W, Paul MR, Tyson JJ. Exploring the roles of noise in the eukaryotic cell cycle. Proc Natl Acad Sci U S A. 2009;106:6471–6476. doi: 10.1073/pnas.0810034106. [DOI] [PMC free article] [PubMed] [Google Scholar]
- 55.Rangel C, Angus J, Ghahramani Z. Modeling T-cell activation using gene expression profiling and state-space models. Bioinformatics. 2004;20:1361–1372. doi: 10.1093/bioinformatics/bth093. [DOI] [PubMed] [Google Scholar]
- 56.Voit E. Biochemical Systems Theory: A Review. ISRN Biomath. 2013;2013:1–53. [Google Scholar]
- 57.Kaern M, Elston TC, Blake WJ, Collins JJ. Stochasticity in gene expression: from theories to phenotypes. Nat Rev Genet. 2005;6:451–464. doi: 10.1038/nrg1615. [DOI] [PubMed] [Google Scholar]
- 58.Chen KC, Wang TY, Tseng HH, Huang CYF, Kao CY. A stochastic differential equation model for quantifying transcriptional regulatory network in Saccharomyces cerevisiae. Bioinformatics. 2005;21:2883–2890. doi: 10.1093/bioinformatics/bti415. [DOI] [PubMed] [Google Scholar]
- 59.Kauffman S. Metabolic stability and epigenesis in randomly constructed genetic nets. J Theor Biol. 1969;22:437–467. doi: 10.1016/0022-5193(69)90015-0. [DOI] [PubMed] [Google Scholar]
- 60.Werhli AV, Husmeier D. Reconstructing gene regulatory networks with bayesian networks by combining expression data with multiple sources of prior knowledge. Stat Appl Genet Mol Biol. 2007;6 doi: 10.2202/1544-6115.1282. Article15. [DOI] [PubMed] [Google Scholar]
- 61.Mukherjee S, Speed TP. Network inference using informative priors. Proc Natl Acad Sci U S A. 2008;105:14313–14318. doi: 10.1073/pnas.0802272105. [DOI] [PMC free article] [PubMed] [Google Scholar]
- 62.Eduati F, De Las Rivas J, Di Camillo B, Toffolo G, Saez-Rodriguez J. Integrating literature-constrained and data-driven inference of signalling networks. Bioinformatics. 2012;28:2311–2317. doi: 10.1093/bioinformatics/bts363. [DOI] [PMC free article] [PubMed] [Google Scholar]
- 63.Tian Y, Zhang B, Shih IM, Wang Y. Proc 2nd ACM Conf Bioinformatics, Comput Biol Biomed. New York, New York, USA; ACM Press: 2011. Knowledge-guided differential dependency network learning for detecting structural changes in biological networks; pp. 254–263. [Google Scholar]
- 64.Cline MS, Smoot M, Cerami E, Kuchinsky A, Landys N, Workman C, et al. Integration of biological networks and gene expression data using Cytoscape. Nat Protoc. 2007;2:2366–2382. doi: 10.1038/nprot.2007.324. [DOI] [PMC free article] [PubMed] [Google Scholar]
- 65.Saito R, Smoot ME, Ono K, Ruscheinski J, Wang PL, Lotia S, et al. A travel guide to Cytoscape plugins. Nat Methods. 2012;9:1069–1076. doi: 10.1038/nmeth.2212. [DOI] [PMC free article] [PubMed] [Google Scholar]
- 66.Hu Z, Snitkin ES, DeLisi C. VisANT: an integrative framework for networks in systems biology. Brief Bioinform. 2008;9:317–325. doi: 10.1093/bib/bbn020. [DOI] [PMC free article] [PubMed] [Google Scholar]
- 67.Shi Z, Wang J, Zhang B. NetGestalt: integrating multidimensional omics data over biological networks. Nat Methods. 2013;10:597–598. doi: 10.1038/nmeth.2517. [DOI] [PMC free article] [PubMed] [Google Scholar]
- 68.Jin G, Zhou X, Wang H, Zhao H, Cui K, Zhang X, et al. The Knowledge-Integrated Network Biomarkers Discovery for Major Adverse Cardiac Events research articles. J Proteome Res. 2008;7:4013–4021. doi: 10.1021/pr8002886. [DOI] [PMC free article] [PubMed] [Google Scholar]
- 69.Zhang L, Li X, Tai J, Li W, Chen L. Predicting candidate genes based on combined network topological features: a case study in coronary artery disease. PLoS One. 2012;7:e39542. doi: 10.1371/journal.pone.0039542. [DOI] [PMC free article] [PubMed] [Google Scholar]
- 70.Luscombe N, Babu M, Yu H, Snyder M, Teichmann SA, Gerstein M. Genomic analysis of regulatory network dynamics reveals large topological changes. Nature. 2004;431:308–312. doi: 10.1038/nature02782. [DOI] [PubMed] [Google Scholar]
- 71.Ideker T, Krogan N. Differential network biology. Mol Syst Biol. 2012;8:565. doi: 10.1038/msb.2011.99. [DOI] [PMC free article] [PubMed] [Google Scholar]
- 72.Bandyopadhyay S, Mehta M, Kuo D, Sung MK, Chuang R, Jaehnig EJ, et al. Rewiring of genetic networks in response to DNA damage. Science. 2010;330:1385–1389. doi: 10.1126/science.1195618. [DOI] [PMC free article] [PubMed] [Google Scholar]
- 73.Lee MJ, Ye AS, Gardino AK, Heijink AM, Sorger PK, MacBeath G, et al. Sequential application of anticancer drugs enhances cell death by rewiring apoptotic signaling networks. Cell. 2012;149:780–794. doi: 10.1016/j.cell.2012.03.031. [DOI] [PMC free article] [PubMed] [Google Scholar]
- 74.Zhang B, Li H, Riggins RB, Zhan M, Xuan J, Zhang Z, et al. Differential dependency network analysis to identify condition-specific topological changes in biological networks. Bioinformatics. 2009;25:526–532. doi: 10.1093/bioinformatics/btn660. [DOI] [PMC free article] [PubMed] [Google Scholar]
- 75.Zhang B, Tian Y, Jin L, Li H, Shih IM, Madhavan S, et al. DDN: a caBIG® analytical tool for differential network analysis. Bioinformatics. 2011;27:1036–1038. doi: 10.1093/bioinformatics/btr052. [DOI] [PMC free article] [PubMed] [Google Scholar]
- 76.Zhang B, Wang Y. Learning structural changes of Gaussian graphical models in controlled experiments. Proc 26th Conf Uncertain Artif Intell. 2010:701–708. [Google Scholar]
- 77.Vandin F, Upfal E, Raphael BJ. Algorithms for detecting significantly mutated pathways in cancer. J Comput Biol. 2011;18:507–522. doi: 10.1089/cmb.2010.0265. [DOI] [PubMed] [Google Scholar]
- 78.Vaske C, Benz S, Sanborn J, Earl D. Inference of patient-specific pathway activities from multi-dimensional cancer genomics data using PARADIGM. Bioinformatics. 2010;26:i237–i245. doi: 10.1093/bioinformatics/btq182. [DOI] [PMC free article] [PubMed] [Google Scholar]
- 79.Ng S, Collisson E, Sokolov A. PARADIGM-SHIFT predicts the function of mutations in multiple cancers using pathway impact analysis. Bioinformatics. 2012;28:i640–i646. doi: 10.1093/bioinformatics/bts402. [DOI] [PMC free article] [PubMed] [Google Scholar]
- 80.Creixell P, Schoof E, Erler J, Linding R. Navigating cancer network attractors for tumor-specific therapy. Nat Biotechnol. 2012;30:842–848. doi: 10.1038/nbt.2345. [DOI] [PubMed] [Google Scholar]
- 81.Barik D, Baumann WT, Paul MR, Novak B, Tyson JJ. A model of yeast cell-cycle regulation based on multisite phosphorylation. Mol Syst Biol. 2010;6:405. doi: 10.1038/msb.2010.55. [DOI] [PMC free article] [PubMed] [Google Scholar]
- 82.Brun M, Dougherty ER, Shmulevich I. Steady-state probabilities for attractors in probabilistic Boolean networks. Signal Processing. 2005;85:1993–2013. [Google Scholar]