

Abstract
While RNA structures have been extensively characterized in vitro, very few techniques exist to probe RNA structures inside cells. Here, we have exploited mechanisms of post-transcriptional regulation to synthesize fluorescence-based probes that assay RNA structures in vivo. Our probing system involves the co-expression of two constructs: (i) a target RNA and (ii) a reporter containing a probe complementary to a region in the target RNA attached to an RBS-sequestering hairpin and fused to a sequence encoding the green fluorescent protein (GFP). When a region of the target RNA is accessible, the area can interact with its complementary probe, resulting in fluorescence. By using this system, we observed varied patterns of structural accessibility along the length of the Tetrahymena group I intron. We performed in vivo DMS footprinting which, along with previous footprinting studies, helped to explain our probing results. Additionally, this novel approach represents a valuable tool to differentiate between RNA variants and to detect structural changes caused by subtle mutations. Our results capture some differences from traditional footprinting assays that could suggest that probing in vivo via oligonucleotide hybridization facilitates the detection of folding intermediates. Importantly, our data indicate that intracellular oligonucleotide probing can be a powerful complement to existing RNA structural probing methods.
INTRODUCTION
Biotechnological applications of RNA have exploded in recent years, amplifying the need to develop tools to better understand RNA folding dynamics and structural changes. RNA structures have been extensively studied using a variety of in vitro techniques (1–3). Prominent among these techniques is the use of chemical or enzymatic modifications (e.g. dimethyl sulfate (DMS), hydroxyl radicals, metal ions, RNase, S1 nuclease mapping) to map RNA structures (4–6). While these methods have provided valuable structural data, most do not provide information on RNA folding dynamics or structural changes in vivo.
RNA folding is influenced by a complex cellular milieu that is difficult to replicate in vitro (7,8). Cellular factors such as the speed and directionality of transcription, metabolite levels, RNA localization and other bimolecular interactions can all have a significant impact on the acquisition of native RNA structures (7–10). With these considerations in mind, a few groups have developed protocols based on chemical modification for characterizing RNA structures in vivo (11–14). One of the most recent examples of in vivo RNA structural probing is selective 2′-hydroxyl acylation analyzed by primer extension in living cells (14). This technique adapts traditional chemical probing to an in vivo setting.
A common feature of chemical probing techniques is that they rely on non-targeted modification of RNA molecules. Since the chemical probe does not modify a unique sequence within the molecule, chemical footprinting methods are less likely to detect transient differences within specific regions that hallmark rare folding intermediates (15). These rare folding intermediates can have alternative functions when compared to the final structure and can be important to understand RNA folding pathways (16,17). In order to detect these intermediates in vivo, a more targeted approach would be required.
In this work, we demonstrate the novel in vivo RNA Structural Sensing System (iRS3) for probing RNA structures in vivo. Our design exploits the ability of a previously designed, well-studied riboregulator to control green fluorescent protein (GFP) expression post-transcriptionally (18,19). The fundamental premise of this approach is that highly structured areas are physically blocked from binding the designed structural reporter. In contrast, ‘open’ regions that do not participate in any intra- or inter-molecular contacts or that are simply not hindered by the topology of the molecule will be more readily available to bind to the reporter. Hereby, we present the iRS3 as a useful tool, not based on chemical modifications, capable of probing RNA structure in living cells.
To demonstrate the value of this system, we use the iRS3 to explore the structural organization of the Tetrahymena group I intron (gI intron). This gI intron is a well-studied (∼400 nt) catalytic RNA (5,20–21) that has been structurally characterized by a variety of different in vitro techniques (22–25). The gI intron has also been confirmed to be catalytically active when expressed heterologously in E. coli (9,26). We establish the ability of our system to distinguish between the wild type and two mutant introns and to identify some of the most accessible regions of each intron. When compared to all available DMS and hydroxyl radical footprinting data (including our own in vivo DMS data), results from our iRS3 probing revealed a higher potential to detect low abundance folding intermediates. As such, the iRS3 methodology complements other in vivo and in vitro probing methods based on small-molecule accessibility.
MATERIALS AND METHODS
Plasmid and strains
To build our new in vivo reporter system, we cloned the group I intron variants into the engineered riboregulator-harboring plasmid (18) and modified it to contain probes complementary to the group I intron. The pZER21αγ12aG plasmid incorporates two promoters to drive gene expression, the pBAD promoter which expressed the gI intron variants and the pLtetO promoter which expressed the hairpin-GFP reporter. We designed complementary probes to be inserted immediately upstream of the hairpin-GFP reporter, creating a probe-hairpin-GFP reporter. The cloning strategies for all plasmids in this study are described in Supplementary Table S3.
The primary sequence of all constructs was confirmed by using primers E and F (Supplementary Table S2) in sequencing reactions performed by the University of Texas core facility. We provide the sequence of the wild-type intron (WTI) Probe 1 reporter (WTI Probe 1 reporter) in Supplementary Text File 1 and the plasmid is available upon request. The probes (15–18 and 9–10 nucleotides long) were designed to be fully complementary to the gI intron (target RNA) and to give good coverage of regions within the intron (Supplementary Table S1). All probes were also purchased as oligonucleotide primers (25 nmol, standard desalting) from Integrated DNA Technologies (Coralville, IA, USA).
Computational analysis of probes
NUPACK (27) was used to estimate minimum free energies (MFEs) of the probe-reporter (EcoRI-Probe-CB-LP-RBS-+35 nucleotides) and to test for the strand-to-strand binding affinity between the probe-reporters and the gI intron. The following user input settings were used: RNA nucleic acid type at 25°C, one strand species and one strand maximum complex size for probe-reporters (structure for probe-reporter was predicted to test for base-pairing interactions of probes with downstream GFP coding sequence) and two strand species and two strand maximum complex size for probe-reporters and introns. The concentration of the hairpin-GFP reporters and introns was assumed to be equimolar (2 μM) in order to test for the relative level of binding of the intron-hairpin complex. NUPACK was also used to calculate the binding energy (ΔMFE) using the same parameters above described.
Flow cytometry
For all experiments, the fluorescence output of each probe was measured using at least quadruplicate samples. Cells were grown overnight in Luria–Bertani (LB) medium (Benton-Dickenson and Company, Sparks, MD, USA) and 10 mg/ml kanamycin (Amresco, Solon, OH, USA), seeded into 20 ml of LB plus 100 μl kanamycin (10 mg/ml stock) and cultured for 2 h. The remainder of the experiment was carried out under two conditions: (i) samples induced with 800 μl of 20% arabinose (final concentration 0.8%) and 20 μl of anhydrotetracycline (aTc) (final concentration 100 ng/μl), (ii) non-induced samples, where neither of the inducers were added. Five hours after induction, we sampled 100 μl to measure the optical density and an additional 100 μl was pelleted and re-suspended in 1× phosphate buffered saline (Amresco) for flow cytometry. The flow cytometry data were collected with a Benton Dickinson FACSCalibur flow cytometer with a 488 nm argon laser and 530 nm FL1 logarithmic amplifier. Sample data were collected using CellQuest Pro (Benton-Dickenson and Company) with a user defined gate. Fluorescent measurements were collected from ∼150 000 cells and analyzed using Microsoft Excel and JMP, a statistical software package. The medians of the populations for non-inducing and inducing conditions were normalized by the average fluorescence for all probes of a given intron variant.
To generate the graphs in Figure 5, we determined shifts by calculating differences in fluorescence between the average of median values for the induced and non-induced samples of the same probe 5 h after induction of appropriate samples. To quantify the error associated with these shifts, we calculated the standard error of the mean (SEM) as propagated from the original data points after normalization.
Figure 5.

iRS3 can capture difference in accessibility along the length of the wild-type group I intron. (A) Fluorescence shifts resulting from probing different regions along the length of the group I intron. The dashed line represents the median of the fluorescence shift means for all probes. The calculation of standard error is described in the Materials and Methods section. (B) Map of the wild-type Tetrahymena gI intron marked with the relative accessibility for regions as determined by comparison of their fluorescence shifts. The data are separated into two general categories with regions showing protection (blue) or higher accessibility (red). Regions whose fluorescence shift mean falls within one standard deviation of the overall median in Panel A (dashed line) were considered in between (gray). (C) Footprinting data for regions assayed by probes. In vivo DMS data, performed as part of this work (Supplementary Figure S5), were discretized by considering the normalized DMS reactivity (DMS reactivity = DMS – no DMS) values between 0.5 and 1.5 as mildly protected (gray), values below 0.5 as protected (blue) and values over 1.5 as exposed (red). The in vitro DMS and hydroxyl radical footprinting data were adapted from (40*) using an equivalent discretization scheme. All chemical reactivities were normalized by the global average reactivity. Nucleotides marked in white indicate that the footprinting method is not capable of detecting accessibility for this nucleotide. *Within (40), see Appendix A and Supplementary Figure S1.
In vitro binding assays
An in vitro binding assay was performed to demonstrate the ability for probes to bind to intron expressed in cellular extracts. Radiolabeled oligonucleotides were prepared as per the protocol described in (28). In vivo samples of the gI intron were harvested and purified using the techniques described in previously published methods (29). RNA from these sources was suspended in 7 μl of buffered solution (50 mM KCl (Avantor Performance Materials Inc.) and 80 mM 3-(N-morpholino)propanesulfonic acid buffer (MOPS) (pH 7.0 Amresco)) and denatured at 95°C for 2 min. After denaturing, 10 μl of the radioactive probes were immediately added to all samples and hybridization occurred at 37°C for 30 min. 2× RNA loading dye (NEB) was added to all samples and to the ladder to get a final concentration of 10% per volume and then nuclease free H2O (Ambion) was added to make the sample volume consistent. The samples were loaded onto a 6% native polyacrylamide gel that was run at two watts for 24 h. The gel was then carefully placed on blotting paper (VWR International), loosely covered with saran wrap and left to dry for 3–4 h at 70°C in a vacuum dryer (BioRad). Upon removal from the dryer, the gel was exposed to a phosphor screen (GE Healthcare) for 3–4 h at 4°C. Following exposure, the phosphor screen was imaged using a Typhoon Phosphorimager.
Northern blot analysis of iRS3 transcript
To determine the steady state levels of iRS3 transcript, RNA was extracted as per protocol described in (29) from cells expressing the iRS3 reporter at 2.5 and 5 h after induction. The RNA was run down an agarose/formaldehyde gel and blotted using previously described methods (30) (see Supplementary Table S1 for 16S rRNA and iRS3 transcript probes).
In vivo dimethyl sulfate footprinting
Primers fluorescent labeling
5′ Amine modified primers (DMS primers K, L and M in Supplementary Table S2) were fluorescently labeled according to previously published protocols (17). For the labeling reaction 1 μl of the purified amine primer (25 mg/ml), 1.2 μl of distilled water, 15 μl of Borax buffer (0.1 M) and 3 μl of NHS-Dye (IRDye® 650 Infrared Dye, Li-Cor) were mixed and incubated in the dark for 3–4 h. Finally, the primers were gel-purified and re-dissolved in 60 μl of nuclease-free water. Their concentrations were estimated using 260 nm absorbance and the extinction coefficients provided by Integrated DNA Technologies (IDT) for each primer.
In vivo dimethyl sulfate treatment
Cells containing WTI plasmid (Supplementary Table S3) were grown overnight at 37°C in 5 ml of LB medium. The main culture was induced with 4 ml of 20% arabinose (final concentration 0.8%) at an OD600 between 0.15 and 0.3, and the culture was left to grow for 5 h at 37°C. Samples were then treated with DMS and prepared as described in (31) and total RNA was extracted from cells using previously described methods (29). After extraction, 4 μg of total RNA were reverse-transcribed using Superscript III RT (Invitrogen) as per manufacturer's instructions.
Capillary electrophoresis
A capillary electrophoresis (CE) system (Beckman Coulter A26572 GenomeLab™ GeXP Genetic Analysis System) was used to separate the DMS treated fragments. Each cDNA sample obtained above was mixed with 1 μl of a DNA size standard 600 ladder (GenomeLab Beckman Coulter 608095) and nuclease-free water was added to a final volume of 30 μl in a conical 96-well plate. The samples were separated in the CE system using the following parameters: temperature pre-set to 60°C, denaturation at 90°C for 150 s, injection at 2.0 kV for 30 s and separation at 3.0 kV for 90 min. Lastly, the data obtained were analyzed using Capillary Automated Footprinting Analysis (CAFA) (32). The CE traces obtained were aligned to the ladder peaks using CAFA. Then, using CAFA, the fit data were filtered and normalized using the ‘no-DMS’ control. All samples were run by technical and biological duplicates.
RESULTS
Molecular design and optimization of iRS3
Our design is an alteration of a previously published, highly controllable riboregulator that inhibits the synthesis of GFP in the presence of a regulatory hairpin and promotes the synthesis of GFP in the absence of the same hairpin (18). As illustrated in Figure 1, this new structural reporter is comprised of five segments at the RNA level: (i) a specific 15–18 nucleotide sequence (probe) that is complementary to a specific region of the target RNA sequence, (ii) a cis-blocking (CB) region complementary to the ribosome binding site (RBS), (iii) a linker region (LR) in between the RBS and its complement, (iv) a region containing an RBS and (v) a region encoding GFP. The probe, which is the only variable feature of this system, acts as a sensor for a specific region within the target RNA. The RBS, LR and the CB form a stable hairpin. The stability of this hairpin is controlled by the expression of a separate molecule (e.g. the Tetrahymena gI intron) in trans that can base pair to the probe and destabilize the hairpin, most likely by steric hindrance and/or by subsequent structural reconfigurations upon probe binding. In addition, once the hairpin is opened, the iRS3 transcript could be further stabilized by interactions with the ribosome; similar protection effects have been reported (30). Thus, the hairpin acts as an adaptor converting the extent of the RNA–probe interaction into fluorescence readout.
Figure 1.

Fundamentals of the in vivo RNA Structural Sensing System (iRS3). (A) Accessible region on target RNA. Our system is expressed on a plasmid using two promoters, pBAD and PLtetO. The RNA reporter construct (Probe X iRS3 construct) incorporates a GFP transcript (green) whose translation is inhibited due to ribosome binding site (RBS, blue) sequestration by a cis-blocking region (CB, orange) that is connected to the RBS through a flexible linker region (LR, black). If the probe (purple) targets an accessible region on the target RNA, an interaction will occur causing the hairpin loop to open, exposing the RBS and lead to GFP expression. (B) Inaccessible region on target RNA. If the probe (red) targets an inaccessible region on the target RNA, there will be reduced interaction between the intron and the probe, the hairpin loop will not open and a negligible increase in fluorescence will be observed compared to non-induced levels.
We initially tested two designs for the riboregulator. The first design contained a NotI restriction site between the probe and the CB–RBS hairpin, which was intended to simplify cloning. However, we did not observe a significant shift in fluorescence upon induction of the intron (data not shown). As a result, we created a second design which contained the probe immediately adjacent to the CB–RBS hairpin. This probe design allowed us to detect a shift in fluorescence upon induction of the target and was therefore used for the remainder of our analyses.
To determine an appropriate length for the complementary probes, we carried out binding predictions (see Materials and Methods: Computational Analysis of Probes) and discovered that 15–18 mers gave a more stable bound complex than 8–12 mers (data not shown). Therefore, we chose to continue our studies with 15–18 mers given their higher specificity, stronger binding and their ability to provide more intron coverage for our initial studies. Although we proceeded with 15–18 mers, our computational predictions suggested that 8–12 mers could provide sufficient, albeit weaker, binding to be used in these studies to increase the structural resolution of the system. From these preliminary studies, we developed a general methodology for designing the iRS3 system to target different RNAs (Supplementary Figure S1).
iRS3 fluorescence is specific to the interaction between probe and target RNA
After determining an appropriate design for the iRS3 (Figure 1), we then built several controls to verify that the fluorescence observed was specific to the recognition and binding of the probe to the target gI intron. All controls were built in the context of Probe 1 (Supplementary Table S1). We hypothesized that a shift in fluorescence would result from the 5′ target region binding to its complementary probe-iRS3 reporter. The binding location of Probe 1 on the intron (and all other probes used) is shown in Figure 2.
Figure 2.

GI intron Tetrahymena Ribozyme Model System. This figure depicts the sequence and secondary structure of the Tetrahymena wild-type gI intron. Probe numbers are circled and indicated next to black dashed lines, which show the regions of the molecule being targeted by these complementary probes. Structural domains are indicated by the letter ‘P’ followed by a number. The dashes between the nucleotides on opposing sides of each stem loop indicate complementary base pairing, with the dots signifying G–U wobble base pairing. The quintuple mutant contains a total of five mutated regions (black boxes) and the letters outside of the boxes represent the new mutant sequences. These mutations abolish five key tertiary contacts within the group I intron molecule shown as thick gray arrows. The A-rich bulge mutant has the same A-rich bulge mutation as the quintuple mutant, but contains no other mutations.
Using Probe 1, we tested if a fluorescence shift was specific to the intracellular presence of both the target gI intron (expressed by the pBAD promoter) and the iRS3 transcript (expressed by the pLtetO promoter). For these experiments, we inoculated cells harboring the plasmid construct containing the target gI intron RNA and the iRS3 construct. We conducted flow cytometry assays under inducing (presence of intron) and non-inducing (absence of intron) conditions and ran each experiment in at least quadruplicates. For all experiments, we defined a fluorescence shift as the difference in fluorescence between means (averaged fluorescence medians) of induced and the non-induced replicates, 5 h after inducing the appropriate samples. As illustrated in Figure 3A, significantly more fluorescence is observed only when the reporter transcript is expressed in the presence of the target gI intron. When the Probe 1-iRS3 reporter and the WTI constructs were co-expressed in a ΔaraC knockout strain (where the pBAD promoter cannot be activated) no appreciable shift was detected (Figure 3B). This experiment demonstrated that induction of intron expression is required to achieve a significant fluorescence shift.
Figure 3.

Fluorescence shifts result from specific interactions between the reporter and the trans target RNA. (A) The wild-type sample shows the interaction between wild-type intron and the IRS3-Probe 1 construct. (B) The wild-type intron and the IRS3-Probe 1 transformed into a ΔaraC knockout strain to impair expression of the group I intron. (C) The IRS3-Probe 1 construct with an intron where 9/16 nucleotides in the target region are mutated, such that Probe 1 is no longer as specific to its target region. (D) The IRS3 -Probe 1 construct co-expressed with a shorter target RNA that contains a complementary sequence to Probe 1. The box plots represent the 75% quartile (upper red line), the median (middle red line) and the 25% quartile (lower red line) of the median fluorescence of at least quadruplicate samples. Whiskers above and below the box plot indicate the furthest data point that is within 1.5× the interquartile range from the box.
We then tested if fluorescence was specific to the binding of the Probe 1-iRS3 reporter to the targeted 5′ end region of the intron. For this experiment, we designed a mutant gI intron where the local binding region to Probe 1 was altered by mutating a 9 bp stretch in the center of the 16-mer target area (GGGAAAAGT25–33 → CCCTTTTCG25–33) coupled with compensatory mutations (GCTA54–57 → TGAT54–57) to preserve the native secondary structure. As shown in Figure 3C, mutating the target region on the intron resulted in a smaller shift in fluorescence upon induction relative to the wild-type gI intron–Probe 1 system. These results indicated that the interaction between the wild-type gI intron and the Probe 1 reporter occurs specifically within the targeted region and, that it was necessary for a significant shift in fluorescence. The residual shift shown by the mutant intron can be explained by the few remaining nucleotides of complementarity that are located at each end of the mutated sequence.
Lastly, we tested the dependency of observing a fluorescence shift on the structural context of the targeted area. For this experiment, we built a much smaller transcript (∼100 nt compared to ∼400 nt) that mimicked the gI intron by containing the complementary region to Probe 1. The strong interaction we observed suggests that even the smaller target RNA was sufficient to destabilize the hairpin (Figure 3D), as long as the binding sequence was specific and present. In this way, we demonstrated that the probe can still bind outside of the molecular context provided by the gI intron. Importantly, these results implied that the use of this system could be extended beyond large molecules such as the gI intron.
iRS3 can discriminate between accessible and protected regions along the group I intron
After identifying a sensitive molecular design that led to fluorescence in the presence of specific binding between the Probe 1 reporter and an accessible region of the gI intron, we tested if the iRS3 could capture contrast in structural accessibility along the target gI intron. For these experiments, we designed nine additional constructs with different probing regions along the gI intron (Figure 2, Supplementary Tables S1 and S3), resulting in 33% sequence coverage of the gI intron. The probes were numbered sequentially according to their position in the primary sequence of the intron.
We then tested the ability of the iRS3 system to report on different regions expected to have a wider range of accessibility based on in vitro results (1,33). We focused on the 3′ end (corresponding to Probe 10), a more structurally hindered region relevant to the folding of the gI intron catalytic core (34) (corresponding to Probe 9), and the P5a domain important to the activation of the ribozyme (35) (corresponding to Probe 6). Once we confirmed that each of the four complementary probes could bind the intron in vitro (Figure 4A), we incorporated each probe into the in vivo iRS3 reporter. As shown in Figure 4B, using the iRS3 system, we observed a differentiated pattern where Probes 1 and 6 showed similar fluorescence shift, Probe 10 showed the largest shift in fluorescence and Probe 9 the lowest shift in fluorescence upon intron induction. We also demonstrated using northern blotting analysis that the fluorescence observed from these probes does not correlate with detected levels of the probe-iRS3 mRNA transcript (Supplementary Figure S2). These results suggested that the iRS3 system could detect differences in accessibility between target regions by differential shifts in fluorescence.
Figure 4.

Pilot test reveals that fluorescence assay can detect relative levels of accessibility. (A) In vitro binding assays show that the probes can bind to the gI intron. Total cellular RNA containing the gI intron was extracted from cells, denatured and then hybridized to the corresponding P32 labeled probe. The resulting hybridized mixture was loaded onto a native polyacrylamide gel, dried and imaged. Black arrows point to the location of the gI intron band. (B) Representative flow cytometry curves from cells harboring the gI intron and the IRS3 construct non-induced (blue) induced (red) samples after 5 h.
It is important to note that prior to testing the different reporters, we performed a computational analysis using the NUPACK (27) software suite to test the probe sequences for self-dimerizations or unwanted hairpin formation (see Materials and Methods: Computational Analysis of Probes). We also used NUPACK to test for the strand-to-strand binding affinity between the iRS3 reporters and the target WTI. All probes designed and tested in this study were predicted to bind with the target region on the intron without many side interactions (data not shown), albeit with relatively different strength. As a result, we expected that each iRS3 reporter probe needed to be individually normalized. That is, as confirmed experimentally, each probe affected the intrinsic stability of the hairpin in the iRS3 construct differently and lead to varying baseline levels of fluorescence. Differential baseline levels of fluorescence observed between probes can also be explained by the presence of a low amount of gI intron (confirmed by northern blotting analysis, data not shown), even under non-inducing conditions.
Assaying a probe library along the group I intron
After confirming that the iRS3 could discriminate between different levels of accessibility along the target RNA by displaying differential levels of fluorescence, we tested if fluorescence shifts represented a good measure of accessibility across a wide range of probes. We confirmed the binding capabilities of all probes to the gI intron by conducting in vitro binding assays in which we hybridized 5′P32 labeled probes to denatured total RNA extracted from E. coli cells overexpressing the gI intron (Supplementary Figure S3). After we saw that the probes could bind to the denatured intron, we incorporated the remainder of our designed probes into the structure sensing system and co-expressed each construct with the gI intron in cells. According to previous in vitro studies: (i) Probes 3, 4, 5 and 6 target important regions for the catalytic activity of the intron (36,37), (ii) Probes 2, 5 and 6 target key tertiary contacts (38), (iii) Probe 7 targets the P6a and P6b domains of the gI intron (5) and (iv) Probe 3 (domains P3 and P4) targets a heavily base-paired region likely in the interior of the molecule and thus relatively hindered (33). By selecting these key areas, we anticipated a wide representation of accessible and inaccessible regions as well as biologically relevant areas within the intron.
As shown in Figure 5A, we observed meaningful differences in the accessibility of the regions probed. We calculated statistical error using the SEM for the fluorescence shift, as propagated from the SEM of multiple determinations (≥4) of fluorescence at non-inducing and inducing conditions. We determined that accessibility of regions was statistically different from each other when the means of our observations differed by at least two standard errors. Using this highly stringent metric, we concluded that Probes 3 and 7 were significantly more exposed than Probes 2, 4, 5 and 9. This observation supported that the iRS3 system can discriminate between exposed and protected regions. We then categorized each region as exposed, protected or in between based on comparing each fluorescence shift to the median accessibility of all regions (Figure 5B). To determine if the inherent thermodynamic properties of each probe could cause the observed fluorescence patterns, we plotted the MFE of the bound complex between the probe sequence and the specific target region versus the normalized fluorescence shift. As can be seen from Supplementary Figure S4, there is no significant bias in the binding affinity of the probes (note that the slope of the trend line and the R2 value approximate to zero and, points are randomly distributed around the trend line).
To explain the general accessibility of each target region, we conducted an in vivo DMS footprinting analysis covering approximately 92% of the entire intron (except about 35 nucleotides at the 3′ and 5′ ends of the intron). Additionally, we compared the iRS3 results to structural studies of the group I intron reported in the literature (1,5,39–40). A particularly useful study was performed by Russell et al. when they explored the structure of the group I intron using DMS footprinting and hydroxyl radical footprinting in vitro (40). We found reliable consistency between in vivo and in vitro DMS footprinting of the group I intron structure when looking at the overall protection level of each area targeted by our different probes (Figure 5C, Supplementary Figure S5). In general, our iRS3 reporters show some agreement with the in vitro hydroxyl radical footprinting (40) and DMS footprinting data (Figure 5). Specifically, the region targeted by Probe 5 appear to be protected, Probes 4 and 6 targeted regions appear to be moderately protected and exposed respectively and, Probes 7 and 8 regions appear to be more exposed when doing a qualitative assessment of all three footprinting patterns (Figure 5C). Overall, we noted two major differences when comparing Figure 5B and C.
First, in general the footprinting results generally estimate an overall higher exposure level (Figure 5C) for the region targeted by Probe 9 than iRS3 determinations (Figure 5A). This difference is likely due to the region being a stable and heavily based-paired helix (34) potentially more difficult to be disrupted by oligonucleotide hybridization than modified by chemical probes. The discrepancy between hydroxyl radical footprinting and iRS3 is reasonably logical given that hydroxyl radical footprinting cleaves the RNA phosphodiester backbone and this cleavage is less influenced by base pairing in the intron structure (1,39). While DMS footprinting identified a few exposed nucleotides in the Probe 9 target region, this region has enough protected and undetermined nucleotides to preclude drawing conclusions about the global region's accessibility from in vivo DMS. These findings strongly suggest that the iRS3 is a measure of global accessibility that may provide different information, specifically, how available an entire region is to form base-pairing interactions.
Second, iRS3 accessibility results for the region assayed by Probe 3 appear to contradict all footprinting studies in general (Figures 5 and 6A). We reasoned that the greater accessibility of this region to the IRS3 reporter could reflect an ability of the probe to interact with folding intermediates in which the complementary segment of the intron is exposed. This hypothesis was supported by previous findings that transitions from some folding intermediates to the native form require transient disruption of the long-range P3 base pairs (41,42). Upon P3 disruption, the 5′ strand of P3 is expected to be accessible to Probe 3, while the 3′ strand most likely forms the alternative base pairs alt P3 (43). To test whether the accessibility of Probe 3 depends on exposure of the P3 region, we split up the targeted area into two shorter target sequences: P3 (nt 95–104 targeted by Probe 3a, 10 nucleotides) and P4 (nt 104–112 targeted by Probe 3b, 9 nucleotides) (Figure 6B). After demonstrating that these shorter probes bound to the group I intron in vitro (Supplementary Figure S3), we incorporated the probes into the iRS3 construct. Interestingly, Probe 3a showed an even higher fluorescence shift than Probe 3 while Probe 3b displayed no fluorescence shift (Figure 6C). We conclude that indeed, the high accessibility to Probe 3 likely arises from interaction with the 5′ strand of P3, probably because the probe is able to interact with and partially folded trapped intermediate (see Discussion). These results also confirmed our ability to obtain higher structural resolution in our system when using shorter probes.
Figure 6.

iRS3 differs from in vivo DMS footprinting findings in the P3 domain of the gI intron. Panel (A) shows a relatively low DMS reactivity for the 5′ strands of domains P3 and P4 in the gI intron suggesting an overall protected area. The upper plot is a representative footprinting pattern where the dashed box represents the region of interest. The lower plot is a subtraction between ‘DMS’ and ‘no DMS’ band intensities averaged for two independent determinations. Panel (B) illustrates the Probe 3 target area, where dash lines indicate the target segments of each probe and the letter ‘P’ followed by a number indicates the different structural domains. Panel (C) shows the fluorescence shift for Probe 3 (domains P3 and P4) and shorter versions Probe 3a (domain P3) and Probe 3b (domain P4).
iRS3 can discriminate between group I intron mutants
We also examined if our system could be used to assay structural differences between RNA variants. For these experiments, we compared the wild-type gI intron to two intron variants, the quintuple mutant and the A-rich bulge mutant (37). The quintuple mutant contains mutations in five critical tertiary contacts (Figure 2) that are known to be highly disruptive to the tertiary structure and catalytic activity of the intron (38). Based on this, we hypothesized that the quintuple mutant would exhibit significant differences in accessibility using the IRS3 relative to the WTI. Given that most of the targeted regions of the intron remained unaltered (at the primary sequence level) in the quintuple mutant, we used the same library of probe-reporters designed for the wild-type gI intron. As for the A-rich bulge mutant, it is a milder variant than the quintuple mutant as it disrupts only one tertiary contact (P5a, Figure 2).
As shown in Figure 7, expression of the quintuple mutant results in significantly different shifts in fluorescence (marked with asterisks) relative to the WTI for Probes 1, 2 and 7 (Supplementary Table S4). From these results, we learned that a couple of areas of the intron become more accessible to oligonucleotides in vivo (e.g. domains P1 (Probe 1) and P6ab (Probe 7)), while others become more protected as a result of the quintuple mutations (e.g. domain P2.1, corresponding to Probe 2). Furthermore, the increase in the average fluorescence observed in the quintuple mutant relative to the WTI (∼30%) indicates the potential of capturing increased molecular accessibility in the quintuple mutant that results from its lack of tertiary structure relative to the WTI (44). On the other hand, the A-rich bulge mutant shows potential differences mostly around the area of mutations, domain P5ac (Probes 4 and 5). The P5abc domain is known to be important to the stabilization and catalytic activity of the intron (33), and it is plausible that mutations affect tertiary contacts in this local area. It is important to note that the 9/10 probes were designed to target regions in the mutants that contain the same sequence as the WTI.
Figure 7.

iRS3 can detect different levels of structural disruption in intron variants. Structural differences between the wild-type gI intron, quintuple mutant and A-rich bulge mutants were measured by calculating the change of the fluorescence shift from the wild type (Fold Change = Fluorescence shift for mutant using Probe X/Fluorescence shift for wild-type intron using Probe X). Standard error of the mean (SEM) for the fold change was calculated as propagated from the SEM for the fluorescence shifts. Differences in accessibility (compared to the wild type) for a given region were considered statistically significant (marked with asterisks) if the mean differed by at least two standard errors from the wild-type baseline (indicated as a dashed line).
The area targeted by Probe 3 displayed particular differences in accessibility between the WTI and quintuple mutant. Specifically, Probe 3 showed an increased fluorescence shift in the quintuple mutant relative to the WTI indicating higher accessibility in this region. This was expected given that Probe 3 targets domain P3–P4, which does not properly base pair in the quintuple mutant due to the absence of required long-range interactions (33,45–47). Likewise, we captured differences between the WTI and the quintuple mutant via IRS3 fluorescence shifts in the P6b region (targeted by Probe 7). We expected that the P6ab area would be more accessible in the quintuple mutant because this domain normally contributes to a tertiary contact that has been mutated in the quintuple mutant (5). Interestingly, for Probe 7, the A-rich bulge mutant shows a milder difference with respect to the wild type than the one shown for the quintuple mutant. This finding supports the iRS3 sensitivity to discriminate more subtle structural differences.
DISCUSSION
In this work, we have combined the traditional idea of using nucleotide accessibility as a measure of RNA structure (1,33) with a genetically encoded biosensor to sense that availability. The novelty of our approach lies in the creative implementation of oligo-hybridization probing directly in living cells. In this work, we demonstrated the potential of the iRS3 to be used as a powerful tool in the study of RNA structures in vivo. First, we showed the ability to capture differential structural accessibilities (as defined by base-pairing interactions) with high specificity within various local regions throughout the Tetrahymena gI intron. We also established the ability of the iRS3 to capture structural differences between wild type intron and a distant variant (quintuple mutant). Finally we have also showcased the ability of the iRS3 to sense milder mutations as it is the case of the A-rich bulge mutant with respect to the quintuple mutant.
Despite the fact that most of the regions of the gI intron exhibited similar structural behaviors in vivo and in vitro, for this stable model intron, we discovered some regions that behave differently when probed using oligonucleotides in living cells. The most unambiguous example of regions that behave differently when probed with the iRS3 in vivo was the region P3 (assayed by Probe 3), which appeared significantly more accessible by oligonucleotide hybridization in vivo, relative to all three standard techniques: in vitro hydroxyl radical footprinting and, in vitro and in vivo DMS footprinting techniques. This difference could exist because the misfolded RNA is not at a high enough concentration to be detected by classical primer extension, but is detectable through oligonucleotide probing.
Figure 8 illustrates the fundamental differences in using oligonucleotide probes versus small molecules for in vivo RNA structural probing that can explain increased sensitivity to the detection of low abundance intermediates in our iRS3 approach. We illustrate the simplest case of a two state folding equilibrium system to represent the dynamics of folding in a region (Region X) presumed to be mostly protected (State 1). However, as expected given dynamic folding equilibrium, other structural conformations are also observed. These structures may be more exposed (e.g. State 2), but appear at a lower frequency (indicated by the larger equilibrium arrow pointing to State 1, Figure 8A). Based on these dynamics, the potential of modifying Region X (during its less favorable but more accessible equilibrium states) by a small molecule like DMS is rather low (Figure 8B). This is due to the intrinsic single-hit kinetics of these chemical probing approaches that result in, at most, one modification per molecule. These modifications can happen at any cytidine or adenosine of the molecule not specifically within the target region. In contrast, an oligonucleotide that has strong complementarity for a target region can bind with high specificity to its target. This oligonucleotide–target interaction can lock less-favorable structures in that state, shifting the equilibrium toward less abundant conformations and giving a signal for exposure that is larger than the exposure of the region in the absence of probe, when exposure is considered as a fraction of the RNA population (Figure 8C). We suggest that this process underlies the ability of iRS3 to capture the presence of low level folding intermediates that are accessible to Probe 3, whereas these intermediates are not observed in the steady state by DMS or hydroxyl radical footprinting methods (5,40). The ability of the iRS3 to capture folding equilibrium intermediates of importance to the RNA folding pathway makes it a useful complement to current in vivo small-molecule-based structural probing approaches.
Figure 8.
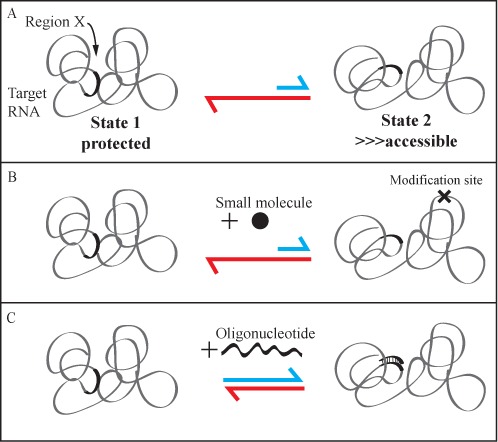
Oligonucleotide versus small-molecule in vivo structural probing. (A) Equilibrium between two conformations of the target RNA. The conformation on the left (State 1) exhibiting relative protection for Region X is more favorable. The less favorable alternative conformation (State 2) on the left exhibits increased exposure of Region X. The equilibrium arrows indicate the relative abundance of each state. (B) The addition of a small molecule to react with the target RNA results in single-hit kinetics where, on average, at most one specific A or C nucleotide (in the case of DMS footprinting) is modified per molecule (‘X’ representing site of modification); the figure illustrates the low likeliness of modifying nucleotides within Region X. Equilibrium shown is same as described above. (C) An oligonucleotide has an increased probability to hit and bind Region X as it bares full base-pairing complementarity to Region X. Additionally, the oligonucleotide can benefit from capturing the less-favorable State 2 by locking the target RNA at the more exposed conformation, shifting the equilibrium toward the less favorable alternative conformation (illustrated by the longer blue arrow, relative to panels A and B).
We believe that the structural information gained from the iRS3 can enrich in vivo RNA structural studies for a couple of reasons. First, the ability of the iRS3 to capture folding equilibrium intermediates of the RNA folding pathway makes it a useful complement to current structural probing approaches. Second, iRS3 probing provides a fundamentally different measure of structural accessibility than chemical methods, namely that accessibility of a region can be interpreted as the availability of a given region to participate in interactions with other macromolecules (i.e. DNA, RNA). Given these capabilities, potential applications of the iRS3 include detecting alternative structural conformations, and observing the structural effects of tuning RNA–RNA interfaces using mutations.
Another major appeal of this in vivo oligonucleotide-based structural probing approach is the ability to design the central riboregulator of the system to sense any target RNA in a rational way. Simple manipulation of the iRS3 plasmid (e.g. making plasmid compatible for golden gate cloning) should make the system highly amenable for rapid insertion of any probe of choice. Although this system could be incorporated in other organisms beyond E. coli, further studies are required to determine if the iRS3system can detect RNAs at native levels. Given these advantages, our method has the potential to provide a relatively easy-to-use platform to capture dynamic structural changes in a wide range of RNAs within living systems.
SUPPLEMENTARY DATA
Supplementary data are available at NAR Online.
Acknowledgments
We would like to thank Dr Rick Russell for his kind gift of the gI intron mutants, the L-21/ScaI plasmid, the use of a capillary electrophoresis (CE) system, for providing us with the in vitro DMS footprinting raw data from Russell et al. (40) and for meaningful discussions throughout the course of the project. Special thanks to Brant Gracia and Luke Ward from the Russell lab for their assistance on the operation of the CE system and other meaningful discussions. We would also like to thank Dr James Collins for his generous gift of the pZER riboregulator plasmid used in this work. We also acknowledge Fade Gong who helped with the initial design of the reporter system, Mathew Pribadi for his assistance in molecular cloning and Grant Gelderman for his assistance with the DMS footprinting.
Author contributions. Designed research: K.D., C.C., R.D., M.K., E.F., S.S., J.V.A., L.M.C.; performed experiments: S.S., J.V.A., C.C., M.K., E.F., R.D., K.D.; analyzed data: S.S., J.V.A., E.F., C.C., M.K., R.D., L.M.C.; wrote paper: L.M.C., S.S. and J.V.A.
Footnotes
These authors contributed equally to this work.
FUNDING
Welch Foundation [F-1756]; National Science Foundation [MCB 1330862]; Consejo Nacional de Ciencia y Tecnología [CONACYT-194638 to J.V.A.]. Funding for open access charge: Welch Foundation [F-1756]; National Science Foundation CAREER Program [CBET-1254754]; Air Force Office of Scientific Research (AFOSR) Young Investigator Program [FA9550-13-1-0160].
Conflict of interest statement. None declared.
REFERENCES
- 1.Tijerina P., Mohr S., Russell R. DMS footprinting of structured RNAs and RNA-protein complexes. Nat. Protocols. 2007;2:2608–2623. doi: 10.1038/nprot.2007.380. [DOI] [PMC free article] [PubMed] [Google Scholar]
- 2.Edwards A., Garst A., Batey R. Chapter 9: Determining Structures of RNA Aptamers and Riboswitches by X-ray Crystallography. In: Mayer G, editor. Nucleic Acid and Peptide Aptamers. New York: Humana Press; 2009. pp. 135–163. [DOI] [PMC free article] [PubMed] [Google Scholar]
- 3.Scott L., Hennig M. Chapter 2: RNA Structure Determination by NMR. In: Keith J, editor. Bioinformatics. New York: Humana Press; 2008. pp. 29–61. [Google Scholar]
- 4.Shcherbakova I., Brenowitz M. Monitoring structural changes in nucleic acids with single residue spatial and millisecond time resolution by quantitative hydroxyl radical footprinting. Nat. Protocols. 2008;3:288–302. doi: 10.1038/nprot.2007.533. [DOI] [PubMed] [Google Scholar]
- 5.Wan Y., Suh H., Russell R., Herschlag D. Multiple unfolding events during native folding of the Tetrahymena Group I Ribozyme. J. Mol. Biol. 2010;400:1067–1077. doi: 10.1016/j.jmb.2010.06.010. [DOI] [PMC free article] [PubMed] [Google Scholar]
- 6.Wurst R.M., Vournakis J.N., Maxam A.M. Structure mapping of 5′-32P-labeled RNA with S1 nuclease. Biochemistry. 1978;17:4493–4499. doi: 10.1021/bi00614a021. [DOI] [PubMed] [Google Scholar]
- 7.Zemora G., Waldsich C. RNA folding in living cells. RNA Biol. 2010;7:634–641. doi: 10.4161/rna.7.6.13554. [DOI] [PMC free article] [PubMed] [Google Scholar]
- 8.Emerick V.L., Woodson S.A. Self-splicing of the Tetrahymena pre-rRNA is decreased by misfolding during transcription. Biochemistry. 1993;32:14062–14067. doi: 10.1021/bi00213a040. [DOI] [PubMed] [Google Scholar]
- 9.Zhang F., Ramsay E.S., Woodson S.A. In vivo facilitation of Tetrahymena group I intron splicing in Escherichia coli pre-ribosomal RNA. RNA. 1995;1:284–292. [PMC free article] [PubMed] [Google Scholar]
- 10.Schroeder R., Grossberger R., Pichler A., Waldsich C. RNA folding in vivo. Curr. Opin. Struct. Biol. 2002;12:296–300. doi: 10.1016/s0959-440x(02)00325-1. [DOI] [PubMed] [Google Scholar]
- 11.Lindell M., Romby P., Wagner E.G.H. Lead(II) as a probe for investigating RNA structure in vivo. RNA. 2002;8:534–541. doi: 10.1017/s1355838201020416. [DOI] [PMC free article] [PubMed] [Google Scholar]
- 12.Wells S.E., Hughes J.M., Igel A.H., Ares M., Jr. Use of dimethyl sulfate to probe RNA structure in vivo. Methods Enzymol. 2000;318:479–493. doi: 10.1016/s0076-6879(00)18071-1. [DOI] [PubMed] [Google Scholar]
- 13.Kertesz M., Wan Y., Mazor E., Rinn J.L., Nutter R.C., Chang H.Y., Segal E. Genome-wide measurement of RNA secondary structure in yeast. Nature. 2010;467:103–107. doi: 10.1038/nature09322. [DOI] [PMC free article] [PubMed] [Google Scholar]
- 14.Spitale R.C., Crisalli P., Flynn R.A., Torre E.A., Kool E.T., Chang H.Y. RNA SHAPE analysis in living cells. Nat. Chem. Biol. 2013;9:18–20. doi: 10.1038/nchembio.1131. [DOI] [PMC free article] [PubMed] [Google Scholar]
- 15.Wan Y., Kertesz M., Spitale R.C., Segal E., Chang H.Y. Understanding the transcriptome through RNA structure. Nat. Rev. Genet. 2011;12:641–655. doi: 10.1038/nrg3049. [DOI] [PMC free article] [PubMed] [Google Scholar]
- 16.Lai D., Proctor J.R., Meyer I.M. On the importance of cotranscriptional RNA structure formation. RNA. 2013;19:1461–1473. doi: 10.1261/rna.037390.112. [DOI] [PMC free article] [PubMed] [Google Scholar]
- 17.Grohman J.K., Gorelick R.J., Kottegoda S., Allbritton N.L., Rein A., Weeks K.M. An immature retroviral RNA genome resembles a kinetically trapped intermediate state. Journal of virology. 2014;88:6061–6068. doi: 10.1128/JVI.03277-13. [DOI] [PMC free article] [PubMed] [Google Scholar]
- 18.Isaacs F.J., Dwyer D.J., Ding C., Pervouchine D.D., Cantor C.R., Collins J.J. Engineered riboregulators enable post-transcriptional control of gene expression. Nat. Biotechnol. 2004;22:841–847. doi: 10.1038/nbt986. [DOI] [PubMed] [Google Scholar]
- 19.Vazquez-Anderson J., Contreras L.M. Regulatory RNAs: charming gene management styles for synthetic biology applications. RNA Biol. 2013;10:1778–1797. doi: 10.4161/rna.27102. [DOI] [PMC free article] [PubMed] [Google Scholar]
- 20.Kruger K., Grabowski P.J., Zaug A.J., Sands J., Gottschling D.E., Cech T.R. Self-splicing RNA: autoexcision and autocyclization of the ribosomal RNA intervening sequence of Tetrahymena. Cell. 1982;31:147–157. doi: 10.1016/0092-8674(82)90414-7. [DOI] [PubMed] [Google Scholar]
- 21.Koduvayur S.P., Woodson S.A. Intracellular folding of the Tetrahymena group I intron depends on exon sequence and promoter choice. RNA. 2004;10:1526–1532. doi: 10.1261/rna.7880404. [DOI] [PMC free article] [PubMed] [Google Scholar]
- 22.Golden B.L., Gooding A.R., Podell E.R., Cech T.R. A preorganized active site in the crystal structure of the Tetrahymena Ribozyme. Science. 1998;282:259–264. doi: 10.1126/science.282.5387.259. [DOI] [PubMed] [Google Scholar]
- 23.Cech T.R., Damberger S.H., Gutell R.R. Representation of the secondary and tertiary structure of group I introns. Nat. Struct. Mol. Biol. 1994;1:273–280. doi: 10.1038/nsb0594-273. [DOI] [PubMed] [Google Scholar]
- 24.Russell R., Zhuang X., Babcock H.P., Millett I.S., Doniach S., Chu S., Herschlag D. Exploring the folding landscape of a structured RNA. Proc. Natl. Acad. Sci. 2002;99:155–160. doi: 10.1073/pnas.221593598. [DOI] [PMC free article] [PubMed] [Google Scholar]
- 25.Kieft J.S., Tinoco I. Solution structure of a metal-binding site in the major groove of RNA complexed with cobalt (III) hexammine. Structure. 1997;5:713–721. doi: 10.1016/s0969-2126(97)00225-6. [DOI] [PubMed] [Google Scholar]
- 26.Waring R.B., Ray J.A., Edwards S.W., Scazzocchio C., Davies R.W. The Tetrahymena rRNA intron self-splices in E. coli: in vivo evidence for the importance of key base-paired regions of RNA for RNA enzyme function. Cell. 1985;40:371–380. doi: 10.1016/0092-8674(85)90151-5. [DOI] [PubMed] [Google Scholar]
- 27.Zadeh J.N., Steenberg C.D., Bois J.S., Wolfe B.R., Pierce M.B., Khan A.R., Dirks R.M., Pierce N.A. NUPACK: analysis and design of nucleic acid systems. J. Comput. Chem. 2011;32:170–173. doi: 10.1002/jcc.21596. [DOI] [PubMed] [Google Scholar]
- 28.DiChiara Jeanne M., Contreras-Martinez Lydia M., Livny Jonathan, Smith Dorie, McDonough Kathleen A., Belfort Marlene. Multiple small RNAs identified in Mycobacterium bovis BCG are also expressed in Mycobacterium tuberculosis and Mycobacterium smegmatis. Nucleic acids research. 2010;38:4067–4078. doi: 10.1093/nar/gkq101. [DOI] [PMC free article] [PubMed] [Google Scholar]
- 29.Hee Cho Seung, Lei Roy, Trey D. Henninger, Lydia M. Contreras. Discovery of ethanol-responsive small RNAs in Zymomonas mobilis. Applied and environmental microbiology. 2014;80:4189–4198. doi: 10.1128/AEM.00429-14. [DOI] [PMC free article] [PubMed] [Google Scholar]
- 30.Contreras L.M., Huang T., Piazza C.L., Smith D., Qu G., Gelderman G., Potratz J.P., Russell R., Belfort M. Group II intron-ribosome association protects intron RNA from degradation. RNA. 2013;19:1497–1509. doi: 10.1261/rna.039073.113. [DOI] [PMC free article] [PubMed] [Google Scholar]
- 31.Waldsich C., Grossberger R., Schroeder R. RNA chaperone StpA loosens interactions of the tertiary structure in the td group I intron in vivo. Genes Dev. 2002;16:2300–2312. doi: 10.1101/gad.231302. [DOI] [PMC free article] [PubMed] [Google Scholar]
- 32.Mitra S., Shcherbakova I.V., Altman R.B., Brenowitz M., Laederach A. High-throughput single-nucleotide structural mapping by capillary automated footprinting analysis. Nucleic Acids Res. 2008;36:e63. doi: 10.1093/nar/gkn267. [DOI] [PMC free article] [PubMed] [Google Scholar]
- 33.Zarrinkar P.P., Williamson J.R. Kinetic intermediates in RNA folding. Science. 1994;265:918–924. doi: 10.1126/science.8052848. [DOI] [PubMed] [Google Scholar]
- 34.Zarrinkar P., Williamson J. The P9.1–P9.2 peripheral extension helps guide folding of the Tetrahymena ribozyme. Nucleic Acids Res. 1996;24:854–858. doi: 10.1093/nar/24.5.854. [DOI] [PMC free article] [PubMed] [Google Scholar]
- 35.Ikawa Y., Yoshimura T., Hara H., Shiraishi H., Inoue T. Two conserved structural components, A-rich bulge and P4 XJ6/7 base-triples, in activating the group I ribozymes. Genes Cells. 2002;7:1205–1215. doi: 10.1046/j.1365-2443.2002.00601.x. [DOI] [PubMed] [Google Scholar]
- 36.Strobel S.A., Shetty K. Defining the chemical groups essential for Tetrahymena group I intron function by nucleotide analog interference mapping. Proc. Natl. Acad. Sci. 1997;94:2903–2908. doi: 10.1073/pnas.94.7.2903. [DOI] [PMC free article] [PubMed] [Google Scholar]
- 37.Naito Y., Shiraishi H., Inoue T. P5abc of the Tetrahymena ribozyme consists of three functionally independent elements. RNA. 1998;4:837–846. doi: 10.1017/s1355838298972016. [DOI] [PMC free article] [PubMed] [Google Scholar]
- 38.Das R., Kwok L.W., Millett I.S., Bai Y., Mills T.T., Jacob J., Maskel G.S., Seifert S., Mochrie S.G.J., Thiyagarajan P., et al. The fastest global events in RNA folding: electrostatic relaxation and tertiary collapse of the Tetrahymena Ribozyme. J. Mol. Biol. 2003;332:311–319. doi: 10.1016/s0022-2836(03)00854-4. [DOI] [PubMed] [Google Scholar]
- 39.Lehnert V., Jaeger L., Michele F., Westhof E. New loop–loop tertiary interactions in self-splicing introns of subgroup IC and ID: a complete 3D model of the Tetrahymena thermophila ribozyme. Chem. Biol. 1996;3:993–1009. doi: 10.1016/s1074-5521(96)90166-0. [DOI] [PubMed] [Google Scholar]
- 40.Russell R., Das R., Suh H., Travers K.J., Laederach A., Engelhardt M.A., Herschlag D. The paradoxical behavior of a highly structured misfolded intermediate in RNA folding. J. Mol. Biol. 2006;363:531–544. doi: 10.1016/j.jmb.2006.08.024. [DOI] [PubMed] [Google Scholar]
- 41.Mitchell D., 3rd, Jarmoskaite I., Seval N., Seifert S., Russell R. The long-range P3 helix of the Tetrahymena ribozyme is disrupted during folding between the native and misfolded conformations. J. Mol. Biol. 2013;425:2670–2686. doi: 10.1016/j.jmb.2013.05.008. [DOI] [PMC free article] [PubMed] [Google Scholar]
- 42.Mitchell D., III, Russell R. Folding pathways of the Tetrahymena Ribozyme. J. Mol. Biol. 2014;426:2300–2312. doi: 10.1016/j.jmb.2014.04.011. [DOI] [PMC free article] [PubMed] [Google Scholar]
- 43.Pan J., Woodson S.A. Folding intermediates of a self-splicing RNA: mispairing of the catalytic core. J. Mol. Biol. 1998;280:597–609. doi: 10.1006/jmbi.1998.1901. [DOI] [PubMed] [Google Scholar]
- 44.Benz-Moy T.L., Herschlag D. Structure–function analysis from the outside in: long-range tertiary contacts in RNA exhibit distinct catalytic roles. Biochemistry. 2011;50:8733–8755. doi: 10.1021/bi2008245. [DOI] [PMC free article] [PubMed] [Google Scholar]
- 45.Woodson S.A. Structure and assembly of group I introns. Curr. Opin. Struct. Biol. 2005;15:324–330. doi: 10.1016/j.sbi.2005.05.007. [DOI] [PubMed] [Google Scholar]
- 46.Pan J., Woodson S.A. The effect of long-range loop–loop interactions on folding of the Tetrahymena self-splicing RNA. J. Mol. Biol. 1999;294:955–965. doi: 10.1006/jmbi.1999.3298. [DOI] [PubMed] [Google Scholar]
- 47.Rangan P., Masquida B., Westhof E., Woodson S.A. Assembly of core helices and rapid tertiary folding of a small bacterial group I ribozyme. Proc. Natl. Acad. Sci. 2003;100:1574–1579. doi: 10.1073/pnas.0337743100. [DOI] [PMC free article] [PubMed] [Google Scholar]
Associated Data
This section collects any data citations, data availability statements, or supplementary materials included in this article.