

Abstract
Thymocyte differentiation is a complex process involving well-defined sequential developmental stages that ultimately result in the generation of mature T-cells. In this study, we analyzed DNA methylation and gene expression profiles at successive human thymus developmental stages. Gain and loss of methylation occurred during thymocyte differentiation, but DNA demethylation was much more frequent than de novo methylation and more strongly correlated with gene expression. These changes took place in CpG-poor regions and were closely associated with T-cell differentiation and TCR function. Up to 88 genes that encode transcriptional regulators, some of whose functions in T-cell development are as yet unknown, were differentially methylated during differentiation. Interestingly, no reversion of accumulated DNA methylation changes was observed as differentiation progressed, except in a very small subset of key genes (RAG1, RAG2, CD8A, PTCRA, etc.), indicating that methylation changes are mostly unique and irreversible events. Our study explores the contribution of DNA methylation to T-cell lymphopoiesis and provides a fine-scale map of differentially methylated regions associated with gene expression changes. These can lay the molecular foundations for a better interpretation of the regulatory networks driving human thymopoiesis.
INTRODUCTION
Hematopoiesis is a hierarchical process that facilitates the generation of exceptionally great cellular diversity from a single progenitor. In order to fulfill this complex developmental program, multipotent progenitors must transit across various intermediate progenitor stages and be able to deploy a flexible transcriptional program. T-cell differentiation is initiated from bone marrow-derived progenitors that colonize the thymus. These early thymic immigrants are still uncommitted and can differentiate into multiple hematopoietic lineages, namely, B and T lymphocytes, NK cells and myeloid cells (1–3). The first restricted T-cell population (CD34+CD1a+) expressed neither a functional T-cell receptor (TCR) nor the CD4 and CD8 coreceptors (4,5). Rearrangements of the TCRD, TCRG and TCRB loci are initiated at this stage (6,7), and αβ T-cell differentiation progresses toward double positive (DP) thymocytes via an immature single positive (ISP) CD4+ stage. Only DP thymocytes that have successfully rearranged TCRB and express a TCRβ chain in association with the pre-TCRα chain can progress further, proliferate and undergo TCRA gene rearrangements, in a process termed β-selection. Once the mature TCRαβ is expressed, DP thymocytes become positively selected and mature into CD4+ or CD8+ single positive (SP) cells that finally leave the thymus and migrate to the periphery.
While thymocyte maturation is a very complex process, it is commonly accepted that differentiation of an early uncommitted progenitor into a mature T lymphocyte is a unidirectional and sequential process that involves first the loss of multipotency and then the acquisition of the highly specialized T-cell function (8). The molecular mechanisms that contribute to these processes are of particular interest. T-cell development is critically dependent on unique stepwise signals provided by NOTCH1, although a highly complex transcriptional network encompasses the differentiation process at each developmental stage. In fact, NOTCH1 signaling, together with some driving factors, such as RUNX1, GATA3, LEF1, IKAROS and c-MYC, induce T-cell commitment and enable T-cell maturation (9–12). In addition, these transcriptional modulators must work in conjunction with cis-regulatory elements and then contribute to the regulation of targeted genes at each differentiation stage. Unfortunately, the mechanistic details of these interactions are largely unknown. Recent evidence from mouse thymocytes showed that histone modifications act as highly dynamic cis-regulatory elements closely related to gene expression and transcription factor binding during T-cell development (13,14). For instance, PU.1 binding to the Tal1 gene during thymocyte differentiation is associated with enriched dimethylation at lysine 4 of histone H3 (H3K4me2) and increased gene expression, but inversely correlated with trimethylation of lysine 27 of histone H3 (H3K27me3) (13). In addition to histone marking, other epigenetic mechanisms, such as DNA methylation, which is usually associated with gene repression, can also play a key role in T-cell development. Indeed, DNA methylation analysis of DN1, DN2 and DN3 mouse thymocytes have identified some differentially methylated genes that are essential during thymopoiesis, including genes encoding the lymphocyte-specific protein tyrosine kinase (Lck) and transcription factor 7 (Tcf7) (15). Changes in DNA methylation patterns are likewise essential for the induction of T-cell effector functions and T-cell plasticity and affect key genes such as IFNG, FOXP3, GZMB and RORC (16–22), further highlighting the importance of the role of DNA methylation in the acquisition and maintenance of T-cell identity.
In this study, we sought to explore the association of particular DNA methylation profiles with the highly dynamic transcriptional program encompassing human αβ T-cell differentiation, from early uncommitted progenitors to intrathymic SP CD4+ and SP CD8+ populations. Our analysis revealed a global trend of demethylation during T-cell differentiation that was closely associated with the development of the TCR function. This provides new insights into the regulatory mechanisms involved in the process.
MATERIALS AND METHODS
Isolation of human thymocyte subpopulations
Thymus samples were routinely obtained during pediatric corrective cardiac surgery. Informed consent was obtained in accordance with the Declaration of Helsinki. The study was performed in accordance with approved guidelines established by the Research Ethics Board of the Spanish Research Council. Normal human postnatal thymocytes were isolated by Ficoll-Hypaque centrifugation (Nycomed, Pharma) from thymus fragments removed during corrective cardiac surgery of patients aged 1 month to 4 years. CD34+ intrathymic progenitors were isolated from thymocyte suspensions by depletion of mature thymocytes using a sheep red blood cell rosetting technique (23), followed by immunomagnetic cell sorting using the Dynal CD34 Progenitor Cell Selection System (Life Technologies), according to the manufacturer's instructions. CD34+-selected cells were then depleted of CD4+ thymocytes by AutoMACS cell sorting using CD4 MicroBeads (Miltenyi Biotec). This population was subjected to further treatment with CD1a MicroBeads and magnetic cell sorting (AutoMACS), as described elsewhere (7). This produced two separate populations of CD34int CD1a+ thymocyte precursors and CD34bright CD1a− multipotent progenitors, which are referred to throughout this paper as CD34+ CD1a+ and CD34+ CD1a−, respectively.
To isolate pre-TCR+ thymocytes, cell suspensions obtained by Ficoll-Hypaque were fractionated by centrifugation on stepwise Percoll density gradients (Pharmacia, LKB), as described elsewhere (7). Thymocytes recovered from the 1.068 density layer were first depleted of mature T-cells by incubation with phycoerythrin-labeled anti-TCRαβ plus anti-TCRγδ mAbs (Beckman Coulter) and anti-PE MicroBeads (Miltenyi Biotec), followed by two rounds of AutoMACS negative selection. Next, pre-TCR thymocytes were isolated by positive selection using CD8 MicroBeads (Miltenyi Biotec), as previously described (24).
To isolate DP TCRαβ+ thymocytes, CD4+ cells were first selected from cell suspensions obtained by Ficoll-Hypaque centrifugation by magnetic sorting using the CD4 MultiSort Kit (Miltenyi Biotec). CD8+ cells were then magnetically sorted from the recovered CD4+ cell subset using the CD8 MultiSort Kit (Miltenyi Biotec), and the CD4+ CD8+ (DP) cell fraction was then subjected to treatment with a PE-labeled anti-TCRαβ mAb (Beckman Coulter), anti-PE MicroBeads (Miltenyi Biotec) and magnetic cell sorting to yield the DP TCRαβ+ cell subset.
CD4+ and CD8+ SP thymocytes were independently isolated from Ficoll-Hypaque thymocyte suspensions. Cells were first subjected to two rounds of depletion using CD8 or CD4 MicroBeads, and recovered cells depleted of CD4+ or CD8+ thymocytes were treated with CD8 or CD4 MicroBeads, respectively, and positively selected by magnetic sorting. CD4− CD8+- and CD4+ CD8−-sorted populations were then incubated with PE-coupled anti-TCRαβ and anti-PE MicroBeads and subjected to positive selection. Isolated cell subsets were >95% pure for the indicated phenotype upon fluorescence-activated cell sorting (FACS) reanalysis (Supplementary Figure S1).
RNA extraction, whole genome gene expression characterization and quantitative real-time PCR
Total RNA was isolated with an RNAqueous-Micro kit (Ambion). RNA integrity, size and quantification were evaluated in RNA Nano Chips with a Bioanalyzer (Agilent Technologies) and Qubit® 2.0 Fluorometer (Life Technologies). Whole-genome expression was characterized using Human HT12 v4 BeadChips (Illumina Inc.). In brief, cRNA was synthesized with a TargetAmp™ Nano-g™ Biotin-aRNA Labeling Kit for the Illumina® System (Epicentre, Cat. No. TAN07924) and subsequent amplification, labeling and hybridization were performed according to Illumina's whole-genome gene expression direct hybridization protocol. Datasets were generated from two biological replicates per cell type, which were obtained from a pool of three individuals. Samples were pooled using identical amounts of DNA per donor. Raw data were extracted with GenomeStudio analysis software (Illumina Inc.) in the form of GenomeStudio's Final Report (sample probe profile). RNA was extracted from two independent sample sets (one sample at each differentiation step from two different donors) for quantitative real-time polymerase chain reaction (PCR). cDNA was synthesized from total RNA (1 μg) using the SuperScript II Reverse Transcriptase Kit (Invitrogen), following the manufacturer's instructions. Quantitative real-time PCR (qRT-PCR) was performed with universal SYBR® Green PCR Master Mix (Applied Biosystems) on a StepOnePlus Real-Time PCR System. Glyceraldehyde 3-phosphate dehydrogenase (GAPDH) was used as housekeeping gene to standardize data, following the ΔΔCt method. Primers are described in Supplementary Table S1.
DNA extraction, whole-genome methylation profiling and bisulfite pyrosequencing
DNA methylation was analyzed with Infinium HumanMethylation450 (HM450) BeadChips (Illumina Inc.). This array provides genomic coverage of a total of 21 231 UCSC RefGenes (including the 5′ and 3′ untranslated regions), 26 658 CpG islands (96%), 59 916 DNAse hypersensitive sites and 80 538 informatically predicted enhancers (25). Total DNA was extracted with an adenosine triphosphate (ATP) Genomic DNA MiniKit (ATP Biotech), following the manufacturer's instructions. Quantification and integrity were measured with a Qubit® 2.0 Fluorometer (Life Technologies) and 1x Tris Acetate-EDTA-agarose gels, respectively. Starting with 500 ng of good quality total DNA, unmethylated cytosines were converted to uracils using an EZ DNA MethylationTM Kit (Zymo Research). Subsequently, whole genome methylation profiles were characterized by amplification of converted DNA and hybridization on Infinium HumanMethylation450 (HM450) BeadChips (Illumina Inc.) following Illumina's Infinium HD assay methylation protocol. Datasets were generated from two biological replicates per cell type, which were obtained from a pool of three individuals. Samples were pooled using identical amounts of DNA per donor. Raw data were decoded with GenomeStudio software (Illumina Inc.) to obtain a Final Report (sample probe profile). DNA was extracted from two independent sample sets (one sample at each differentiation step from two different donors) for bisulfite pyrosequencing. Sodium bisulfite modification of 500 ng DNA was performed with the EZ DNA methylation kit (D5002, Zymo Research). Bisulfite pyrosequencing was performed with the PyroMark Q24 reagents (Qiagen), following the manufacturers’ instructions. The PyroMark Assay Design tool (v. 2.0.01.15) was used to obtain pyrosequencing oligonucleotides (Supplementary Table S2). After PCR amplification of the region of interest, methylation levels were quantified using the PyroMark Q24 system (Biotage).
Statistical analysis
Raw data from GenomeStudio were processed and analyzed in the R statistical computing environment, using R packages from the Bioconductor project (26) and SwIMA (Mosen-Ansorena, D and Aransay, AM, ‘Integral analysis and automatic reporting for Illumina expression/methylation arrays’. Unpublished manuscript). Using the lumi package (27), raw methylation data were background-corrected, log2-transformed, quantile-adjusted for color balance and quantile-normalized. Raw expression data were background-corrected and log2-transformed. Then, probes with detection values >0.01 in all samples were filtered, and the remaining values were quantile-normalized. Sex chromosomes were excluded from the analysis. For methylation sites, annotation of regulation and site location were recorded using Illumina's IlluminaHumanMethylation450k.db package. Methylation and pairwise expression comparisons were estimated at each differentiation step. A linear model was fitted to the data and empirical Bayes-moderated t-statistics were calculated using the limma (28) package. P-values were adjusted by determining false discovery rates (FDRs) using the Benjamini–Hochberg procedure. A site was considered differentially methylated in a differentiation step for values of FDR-adjusted P < 0.05 and M-difference (ΔM) > 1.5. As a reference, differences of M = 2.0 are equivalent to differences of 0.25 in beta values (29). Those probes within the full-length gene or up to 1500 bp from transcription start site were annotated as being gene-associated. To reduce false-positive results from the functional analysis of the methylation data, the hypergeometric test was used to assess the enrichment in significant methylation sites within each gene compared with the number of CpG sites represented on the BeadChip. For expression data, a gene was considered to be differentially expressed if at least one of its associated probes had a value of FDR-adjusted P < 0.05 and an >1.5-fold absolute change. Gene ontology (GO) enrichment analysis was performed with the GOstats package and the DAVID GO web-based tool. Heat maps and CIRCOS were generated with the gplots and RCircos (30) packages, respectively. The reactome functional interaction network was built using Cytoscape software (31). The network was then exported to Gephi (32), whereupon the Fruchterman–Reingold clustering algorithm was used to derive the graph (33). The raw DNA methylation and gene expression data have been submitted to NCBI Gene Expression Omnibus under de accession number GSE55112 (http://www.ncbi.nlm.nih.gov/geo/query/acc.cgi?acc=GSE55112).
RESULTS
Global methylation analysis during human intrathymic differentiation
In order to gain a comprehensive view of DNA methylation during human αβ T-cell differentiation we examined several cell populations isolated ex vivo from the neonatal human thymus, which represent defined in vivo maturation stages and focused on four critical developmental check-points: T-cell commitment (step 1), defined by the transition from early thymic progenitors with lymphomyeloid potential (CD34+/CD1a−) to T-lineage-restricted progenitors (CD34+/CD1a+) (2,3); β-selection (step 2), which occurs during the transition from DN CD34+/CD1a+ thymocytes to DP pre-T-cells expressing Pre-TCR; TCRαβ acquisition (step 3), which occurs after downregulation of Pre-TCR and gives rise to a substantial population of DP TCRαβ+ cells and positive selection (step 4), which results in lineage specification of DP TCRαβ+ thymocytes into either SP CD4+ or SP CD8+ cells (steps 4a and 4b, respectively).
Methylation datasets were generated from two biological replicates per cell type (only one in the case of CD34+/CD1a+), and each biological replicate was obtained from a pool of three individuals. To confirm the differentiation sequence, we first used two-dimensional principal component analysis (Figure 1A). The observed sequence did not differ from the expected results, although the Pre-TCR+ and DP TCRαβ+ thymocytes appeared tightly grouped. Also, the magnitude of the methylation changes between DP TCRαβ+ and SP CD4+ (step 4a) or SP CD8+ (step 4b) cells was much greater than between the two SP populations, suggesting that steps 4a and 4b share many differentially methylated regions (DMRs). Hierarchical clustering correctly grouped all biological replicates and confirmed the differentiation sequences (Supplementary Figure S2).
Figure 1.

Overview of DNA methylation during thymocyte maturation. (A) Principal component analysis of all samples based on methylation profiles obtained from HM450 arrays. Arrows represent the direction of differentiation. (B) Venn diagrams showing all annotated DMRs at each differentiation step. (C) Genomic distribution of the thymic DMRs at each differentiation step using CIRCOS. Colored bars represent the ΔM-value. The gray lines intersect at ΔM = 0.
To identify DMRs, we selected CpG sites with an M-difference (ΔM) > 1.5 and an adjusted value of P < 0.05 at each differentiation step. Using these criteria, we annotated 3804 unique DMRs within the entire differentiation process (Supplementary Table S3), although they were unevenly distributed, from only 57 DMRs (step 3) to 1692 DMRs (step 4a) (Figure 1B). Despite the large scale of the methylation changes, most differentiation steps shared a very small amount of DMRs, suggesting that methylation changes are mostly unique events during thymocyte differentiation. Only steps 4a and b shared a significant amount of DMRs (>50%), mirroring the phenotypic proximity demonstrated by the principal component analysis. This was also observed in the genome-wide representation of the methylation data, which all had a unique genomic distribution of DMRs at each differentiation step, except for the remarkably similar 4a and 4b steps (Figure 1C).
We observed both gain (de novo-methylated DMRs) and loss (demethylated DMRs) of methylation during thymocyte differentiation. Nevertheless, scatter plots for each differentiation step showed that DNA demethylation prevailed over de novo methylation in all differentiation stages, with the sole exception of the earliest differentiation step: from CD34+/CD1a− to CD34+/CD1a+ cells (step 1) (Figure 2A). In fact, most DMRs underwent demethylation events during T-cell maturation that were mostly concentrated at the β-selection stage (step 2) and at the transition from DP TCR αβ+ to SP CD8+ or SP CD4+ (steps 4a and 4b, respectively). Overall, we annotated 3826 demethylation versus 1167 de novo methylation events during thymocyte differentiation, implying that DNA demethylation is the dominant mechanism (Figure 2B), at least within the genomic coverage of the HM450 BeadChip. These changes were mostly located outside CpG islands and in gene body regions (Figure 2C). In addition, DNA methylation changes at CpG islands were found at higher frequencies during early T-cell commitment (step 1) than at subsequent differentiation steps.
Figure 2.

Demethylation and de novo methylation during thymocyte differentiation. (A) Scatter plots of all annotated DMRs at each differentiation step. (B) Volcano plot showing all probes demethylated (blue) and de novo-methylated (red) during differentiation. (C) Distribution of thymic DMRs according to CpG content and gene location. Shores were defined as the region 2 kb upstream and downstream of a CpG island and shelves as the 2 kb region outside of a shore.
Changes in DNA methylation are mostly unique and irreversible events during thymocyte differentiation
Box plots with the M-values of all demethylated and de novo-methylated thymic DMRs showed that DNA demethylation was progressive throughout differentiation (Figure 3A), indicating that loss of methylation is not generally reverted. M-values between intrathymic CD8 and CD4 SP populations are very similar as both populations share a significant proportion of their DMRs. On the other hand, M-values of de novo methylation DMRs increased only at the earliest developmental transition, and remained stable in subsequent differentiation steps.
Figure 3.

DNA methylation dynamics during differentiation. (A) Box plots showing M-values of demethylated and de novo-methylated DMRs. Each box plot represents de M-value distribution of all annotated thymic DMRs at each differentiation step. (B) Heat maps showing methylation values of all demethylated DMRs at each differentiation step and in all cell samples. DMRs at each differentiation step are grouped together to allow visualization of the methylation status at subsequent stages. (C) K-means clusters of all thymic DMRs during differentiation (cluster centroid; black line).
Heat maps with all DMRs at each differentiation step confirmed that the demethylated and the de novo-methylated CpG sites remained stable in subsequent differentiation steps without reversion of the methylation status (Figure 3B). A similar result was observed when DMRs were grouped by behavior during differentiation by K-mean clustering (Figure 3C). Instead of a progressive loss or gain of methylation, once a DMR had undergone a methylation change it generally remained unchanged at subsequent stages or changed only mildly. For instance, as shown in Figure 3C, clusters 4, 8 and 17 showed a gain of methylation at step 1 and afterwards the centroid of the cluster remained flat. Also, DMRs in clusters 13 and 29 experienced an abrupt loss of methylation during β-selection that was maintained during the DP and SP stages. A few clusters, such as 20 and 22, showed a progressive loss of methylation during two consecutive differentiation steps, and some others, such as 1 and 2, showed almost flat centroids due to the clustering of those DMRs with less marked changes. Nevertheless, none of the cluster centroids presented a transient peak at any intermediate differentiation step. Together, these results indicate that demethylation and de novo methylation are generally not continuous processes, but rather unique and irreversible events that occur at specific points during thymocyte maturation.
DNA methylation changes during αβ T-cell development are strongly associated with T-cell differentiation and TCR function
We found 3804 probes that were differentially methylated during T-cell development in the thymus, corresponding to 1760 genes (Supplementary Table S3). The HM450 array contains an average of 17 CpG sites per gene region, so we assessed the enrichment of DMRs within each gene by hypergeometric testing (see ‘Materials and Methods‘). By this means, we annotated 457 highly significant genes that were differentially methylated during T-cell development, corresponding to 1642 probes (Supplementary Table S4). Of these, only 95 genes contained one or more hypermethylated probes and only 11 genes (RAG1, RAG2, CD8A, CD1A, PTCRA, OSBPL5, ZP1, CBFA2T3, AXIN2, ARPP21 and BCL11B) showed reversion of the methylation changes accumulated at a previous differentiation stage. GO analysis revealed that differentially methylated genes were essentially involved in the immune function (Figure 4A), including hematopoiesis, T-cell differentiation and antigen processing and presentation. However, the distribution of these functional categories during T-cell differentiation was not homogenous. Steps 2 and 4a/4b were the most highly enriched for hematopoiesis-related genes, while step 1 showed a preferential enrichment of antigen processing and presentation and cell-adhesion categories (Supplementary Table S5). Additionally, step 3 did not show any significant enrichment of any GO category, further supporting the notion that the transition from β-selected pre-T-cells to αβ TCR+ cells is unremarkable at the DNA methylation level.
Figure 4.
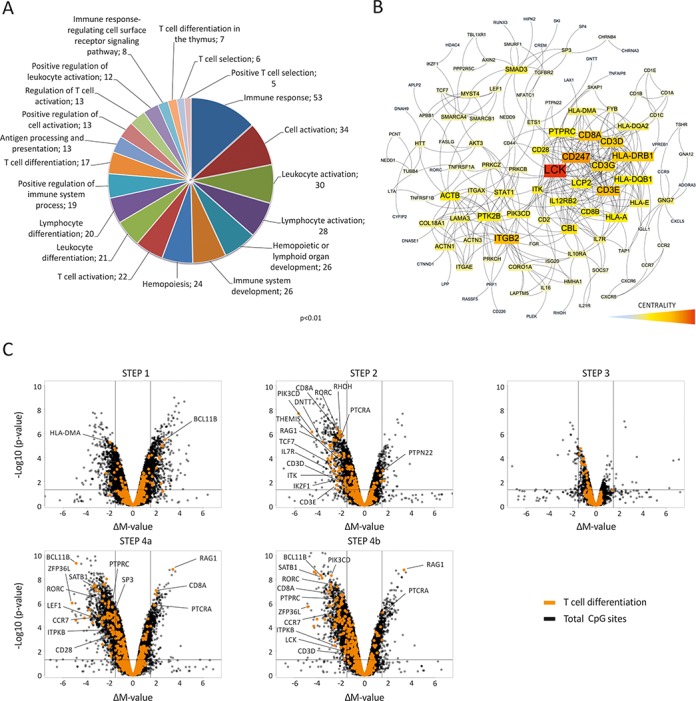
Functional analysis of thymic DMRs. (A) GO analysis of all thymic DMRs. The frequencies of genes in each category are indicated (P < 0.01). (B) Reactome functional interaction network of DMR-enriched genes. Network centrality is indicated by a color scale. (C) Volcano plots with overlapping ΔM-values of all microarray probes (black dots) in each differentiation step with only those associated with genes in the T-cell differentiation signature (orange dots).
Generation of a functional protein interaction network involving all highly significant differentially methylated genes showed an intricate interconnected grid, which indicates a strong functional connection between the annotated genes (Figure 4B). A centered cluster of genes associated with TCR function was clearly observed. This included the CD3 complex, the CD8A and CD28 molecules, and many genes involved in TCR signaling, such as the lymphocyte-specific protein tyrosine kinase (LCK), the FYN binding protein (FYB) and the IL2-inducible T-cell kinase (ITK). Another gene cluster was observed around the integrin beta 2 (ITGB2) that included genes involved in cell adhesion (ITGAE, ITGAX), cytoskeleton (ACTN3, ACTN1, CORO1A), extracellular matrix (LAMA3, COL8A1) and intracellular signaling associated with these processes (PTK2B, PRKCH, CTNND, RASSF5). We also overlapped the T-cell differentiation signature (GeneWeaver, GO:0030217) with the DNA methylation profile at each differentiation step (Figure 4C). We observed that most differentially methylated genes in this signature became demethylated during maturation, following the global demethylation trend in the thymus. β-selection (step 2) was associated with one of the most prominent demethylation waves in thymocyte maturation, which affected 16 known components of the T-cell differentiation program, including some of the most essential pre-TCR/TCR components and some associated signaling proteins (ITK, PIK3CD, THEMIS). Additionally, RAG1, the mutagenic DNA nucleotidylexotransferase (DNTT) and the pre-T-cell antigen receptor α (PTCRA) were demethylated at this point, suggesting that DNA demethylation contributes to the generation of a functional pre-TCR complex.
The transition from β-selected thymocytes expressing a functional pre-TCR to DP thymocytes expressing the mature αβ TCR (step 3) was not associated with changes in any gene in the TCR differentiation signature. In contrast, the transition from DP TCR α/β+ to SPCD4+ or SPCD8+ thymocytes (steps 4a and b), which marks the positive selection process, is associated with the most noticeable DNA demethylation wave during thymocyte development. Most of the genes included in the T-cell differentiation signature underwent demethylation and were shared by SP CD4+ and SP CD8+ cells, although a few interesting divergences were detected. Of these, CD28 was demethylated in the CD4+ lineage, while CD8A and LCK were specifically demethylated in the CD8+ lineage. It is worth noting that CD8A had unusual DNA methylation dynamics, since it was demethylated at the β-selection checkpoint, but subsequently remethylated in the SP CD4+ lineage. Only two other genes in the T-cell differentiation signature, PTCRA and RAG1, showed remethylation after demethylation, indicating that remethylation events may be restricted to just a few key genes.
On the whole, we found that DMRs were highly enriched in the T-cell differentiation signature but were not restricted to it. Some differentially methylated genes are involved in other biological functions such as apoptosis (TNFAIP8, FASL) or cell adhesion (ITGAE, ITGAX). Up to 88 genes that encode transcriptional regulators were differentially methylated, many of them with an as yet unknown function in the T-cell differentiation context (HOXA6, FOXK1, VOPP1, TOX2, etc.) (Table 1). We also found transcriptional regulators that were differentially methylated between the CD4+ and CD8+ lineages, and which are well known effectors during the process of CD4 versus CD8 lineage commitment. These included the zinc finger and BTB domain containing 7B (ZBTB7B), the thymocyte selection-associated high-mobility group box (TOX) and RUNX3, and some other genes that had not previously been reported, such as the arginine-glutamic acid dipeptide (RE) repeats (RERE) and the additional sex comb-like 1 (ASXL1).
Table 1. Transcriptional modulators differentially methylated during thymic differentiation.
| Differentiation step | Gene (official gene symbol) |
|---|---|
| Step 1 | BCL11Ba, FOXK1a, HOXA6a, LHX6, PRDM8a, TFCP2 and ZNF135a. |
| Step 2 | AHRR, BCL11B, CBFA2T3, HDAC4, IKZF1, JMJD6, MSI2, RAG1, RORC, SMARCA4, SMARCB1, TBL1XR1, TCF7, TNRC6B and TULP4. |
| Step 3 | AFF3, CDC73, RCOR3, VOPP1, ZNF691a and ZNF707a. |
| Step 4a and 4b | ACTB, AIRE, BACH2, BCL11B, EIF2C2, ETS1, HIPK2, LBH, MAFGa, PASK, RAG1a, RORC, SATB1, SMYD1, STAT1, TNRC6B, TOX2, ZFP36L1, ZNF217, ZNF238 and APBB1. |
| Step 4a only | MYST4, PRDM1, SP3, SP4, ATF7IP, RERE, ASH1L, CREM, CBFA2T3a, FOXK1, LEF1, SSBP2, ZBTB7B, ASCC1, ASXL1, CTNND1a, DNMT3A, DPF2, LMO2a, SSBP2, STOX2, TOX, ZCCHC11 and ZNF589. |
| Step 4b only | CBL, KLF13, SMAD3, FOXP1, NFATC1, RUNX3, SND1, TRERF1, TBL1XR1, SKI, ZHX2, BCL9L, C14orf43, PHRF1 and PNRC1. |
aDe novo-methylated genes.
Gene expression dynamics in T-cell differentiation
To study the association between DNA methylation and the transcriptional program encompassing thymocyte development, we analyzed RNA expression at each particular thymic differentiation step. Gene expression datasets were generated from two biological replicates per cell type, which were obtained from a pool of three individuals. Up to 4465 unique probes corresponding to 3803 differentially expressed genes (DEGs) were annotated during differentiation (>1.5-fold change) (Supplementary Table S6). Principal component analysis showed a similar sample distribution to that of DNA methylation. Nonetheless, the Pre-TCR+ and DP TCRαβ+ thymocytes were not as tightly grouped (Supplementary Figure S3), indicating that both cell subsets have their own gene expression program, even in the absence of significant DNA methylation changes.
Most DEGs were accumulated at steps 2, 4a and b (Figure 5A) but, in contrast to DMRs, we found no specific bias toward either upregulation (2961 probes) or downregulation (2792 probes). In addition, global gene expression dynamics during thymocyte differentiation behaved quite differently from DNA methylation, as many differentially expressed probes were shared between two or more differentiation steps (Figure 5A), while DMRs were mainly stage-specific (Figure 1B). This suggested that gene expression changes occur progressively during thymocyte differentiation. To test this hypothesis, we applied K-means clustering to all DEGs (Figure 5B). In contrast to DMR clusters, many of the resulting DEG clusters presented progressive changes during consecutive differentiation steps and minimum or maximum values at intermediate stages. DEG clusters included many genes known to be involved in thymic differentiation. For instance, clusters 18 and 26 showed a progressive increase in expression until SP CD4+ and SP CD8+ stages and included many genes related to TCR and T-cell response, such as IL32, CD27, LAT, ITK, CCR7 and FYB. Cluster 20 exhibited the opposite trend, and included many genes of the B-cell and myeloid developmental program, such as LAT2, VPREB1, IGLL1, NCF4, EMR2, CTSG, PLEK and LYN, and early differentiation markers such as CD34. Other clusters (6, 13, 16, 19 and 27) showed maximal expression levels in Pre-TCR+ and DP TCRαβ+ cells, their expression decreasing at downstream SP CD4+/CD8+ stages. This was the case for cluster 16, which contained some key genes of the T-cell developmental program and TCR signaling including RORC, NFATC3, CD8A and CD8B, and others with an as yet unknown function in this process (VOPP1, ARPP-21, RASD1, MAFB, etc.). The remaining clusters showed very different kinetics during T-cell maturation but none of them showed strong asymmetry between CD4+ and CD8+ SP stages. In fact, although positive selection of SP CD4+/CD8+ thymocytes (steps 4a/4b) accounted for most of the expression changes occurring during T-cell development, the two populations shared over 70% of the annotated changes. This finding indicates that CD4+ and CD8+ SP thymocytes are remarkably similar and also explains the presence of the almost flat centroids between the two cell types in the K-means clusters. Despite these similarities, we found that important genes were differentially expressed between the populations (Figure 5C). For instance, many cytotoxicity-associated genes were exclusively upregulated in SP CD8+ cells (CTSW, GZMK, PRF1 and FGFBP2), and also the recently described transcription factor in mouse NKT cells (ZNF683) (34,35), which is a homolog of Blimp-1 that greatly increased its expression (>7-fold change) in SP CD8+ cells. Conversely, some genes were only upregulated in SP CD4+ cells, such as cathepsin L1 (CTSL1), which is involved in protein recycling within the lysosome and the maturation of the MHC class II complex, the chemokine (C-C Motif) receptor 4 (CCR4) and ZBTB7B.
Figure 5.

Gene expression changes during differentiation. (A) Venn diagrams showing the number of probes differentially expressed at each differentiation step. (B) K-means clustering of thymic DEGs during T-cell differentiation (cluster centroid; black line) and heat maps of representative K-means clusters. (C) Gene expression changes during differentiation of CD4+ and CD8+ lineages. Comparison of gene expression changes in SP CD4+ cells (horizontal axis) and SP CD8+ cells (vertical axis) versus DP cells.
Recent reports have provided very detailed measures of gene expression throughout mouse T-cell differentiation, providing a new opportunity to compare regulatory networks between mouse and human T-cell development programs (12,13). Indeed, our analysis of human thymocytes identified many common elements with mouse counterparts. During early T-cell lineage commitment, repression of many progenitor cell genes in mouse is also observed in human thymocytes. The shutdown of the progenitor and non T-cell programs in both mouse and human cells involves a number of transcriptional regulators, such as HHEX, LYL1, SPI1, NFE2, MYCN, LMO2 and several interferon regulatory factors (IRF) (13). Another interesting finding from the initial steps of differentiation is the differential expression of four diacylglycerol (DAG) kinases (DGKA, DGKE, DGKD and DGKQ), which is similar to previous observations in mouse thymocytes, suggesting that the function of this family of proteins is conserved during T-cell development (12). Later in differentiation, human thymocytes share many elements within the Notch signaling pathway, including upregulation of NOTCH-induced genes such as TCF7 and BLC11b during β-selection, whose expression is subsequently maintained at a high level and c-MYC, which is only transiently overexpressed upon β-selection. Overall, the transcriptional program induced by β-selection is similar in mouse and human thymocytes and includes transient activation of NOTCH signaling and expression of TCR-associated components (CD3 complex, PTCRA, ITK, FYB, RORC, etc.). Correspondingly, positive selection in mouse and human includes TCR signaling components and transcriptional regulators as a consequence of TCR signaling of the newly rearranged αβ TCR. Similarly to what occurs in mice, we observed upregulation of canonical TCR transcriptional regulators (EGR2, FOS, RELB, NFKB1 and NFKB2), and some negative selection-associated genes (PDCD1 and GADD45B). Also, human data confirmed the upregulation of some inhibitory molecules (ID2 and ID3) and the downregulation of TCF12, previously observed during mouse positive selection (12). Finally, differentiation of CD4+ and CD8+ lineages seems to be highly conserved in both humans and mice, including, as expected, many cytotoxicity-associated genes and transcriptional regulators (EOMES, ZBTB7B and RUNX3), which further emphasizes the transcriptional similarity between human and mouse regulatory networks. Overall, these results highlight the importance of studying mouse T-cell differentiation for the valuable insights into human development it provides.
DNA methylation is associated with gene expression changes during αβ T-cell differentiation
We next investigated whether, as expected, DNA methylation and gene expression levels are inversely correlated throughout human thymopoiesis. Among the 4993 DNA methylation changes found during thymic differentiation (ΔM > 1.5), 768 (around 15.4%) were inversely correlated with the RNA expression of their associated genes (>1.5-fold change) at a concurrent differentiation step (Figure 6A). Most of these inverse correlations corresponded to demethylation events associated with upregulated genes (670 probes), which suggests a more prominent role of demethylation in gene expression.
Figure 6.

Association of DNA methylation and gene expression. (A) Correlation between DMRs and expression of their associated genes. Each bar represents the number of DMRs associated with gene expression changes (FC > 1.5) at a concurrent differentiation step. (+) indicates de novo methylation or gene expression upregulation. (−) represents demethylation or gene expression downregulation. (B) DNA methylation and gene expression kinetics of representative genes during T-cell differentiation. To aid visualization of expression and methylation data in all differentiation stages, CD4+ and CD8+ cells are represented as consecutive samples. Black dots indicate differentially methylated CpG sites associated with each gene. The transcription start site (TSS) is indicated by an arrow. (C) Distribution of thymic DMRs associated with changes in gene expression, according to CpG content and gene location.
Given that only 15.4% of the methylation changes detected were inversely correlated with gene expression, it is possible that the other DMRs may affect gene expression at downstream differentiation steps or may not be related to gene expression at all. Indeed, we found 113 demethylated probes that are only associated to gene expression upregulation at downstream differentiation steps (Supplementary Table S8). This suggests that some genes, such as DGKD and PDCD1 (Figure 6B), could be demethylated to allow subsequent expression in response to forthcoming regulatory events, as reported in previous studies (36).
To investigate how DNA methylation may affect gene expression in human thymopoiesis, we classified all DMRs associated with gene expression changes according to their gene location and CpG density. We found that shelf and non-CpG islands were the most significantly enriched categories (P < 10−13 and P < 10−16, respectively), while CpG islands were almost entirely excluded (P < 10−16) (Figure 6C). With respect to gene location, no significantly enriched category was observed. Collectively, these results indicate that DMRs associated with gene expression changes are mostly concentrated in CpG-poor regions.
GO enrichment analysis of DEGs showed that cell cycle was the most enriched functional category (Supplementary Figure S4A), while the set of DMRs was far more enriched in hematopoiesis-related genes. By contrast, GO enrichment analysis considering only those genes with inversely correlated gene expression and DNA methylation showed preferential enrichment of immune response and leukocyte activation-related genes (Supplementary Figure S4B). Cell cycle-related GO categories were absent and thus, although many cell cycle genes were differentially expressed during T-cell differentiation, they did not appear to be significantly regulated by DNA methylation. Importantly, KEGG (Kyoto Encyclopedia of Genes and Genomes) enrichment analysis of these genes identified the TCR signaling pathway as the most prominent functional pathway regulated by DNA methylation (FDR, P < 10−6) (Supplementary Figure S4C). This category included many essential genes associated with TCR function, such as PTPRC, ITK, CD3G, CD3D, CD8A, CD247, PIK3CD, NFKBIA, PDCD1, FYB, CD28, NFATC1, etc., most of which were demethylated and upregulated during β-selection and SP CD4+/CD8+ specification. As an example, genes encoding the CD3 complex components (CD3D, CD3G, CD3E and CD247), and also some essential TCR signaling elements such as ITK, were demethylated and overexpressed during the transition from CD34+/CD1a+ to pre-TCR+ cells (Figure 6B and Supplementary Figure S5). The SLP76-associated phosphoprotein, known as FYB, was likewise overexpressed and demethylated at the β-selection checkpoint, while SLP76 demethylation and overexpression occurred at the downstream SP stage. Thus, DNA demethylation seems to affect TCR function at different points during T-cell differentiation, which probably help tune the TCR signaling.
Other signaling pathways known to be essential in thymopoiesis were not so clearly affected by DNA methylation. Particularly, of the 137 annotated genes associated with the NOTCH signaling pathway (GO:0007219, GeneWeaver), which is essential for inducing T-cell commitment and development, 33 underwent significant gene expression changes (>1.5-fold change) between particular differentiation stages (Supplementary Figure S6), but only downregulation of the nuclear receptor corepressor 2 (NCOR2), the arrestin β 1 (ARRB1) and the cyclin-dependent kinase 6 (CDK6) were associated with DNA methylation changes. In addition to NOTCH signaling, shutdown of the non-T-cell lineage regulatory programs is essential for T-cell lineage commitment (8). Indeed, we found downregulation of many essential key factors of the myeloid and B-cell differentiation program during the transition from CD34+/CD1a− to CD34+/CD1a+ cells (step 1), including genes encoding the spleen focus-forming virus proviral integration oncogene 1 (SPI1), the Spi-B transcription factor (SPIB), CCAAT/enhancer binding protein (C/EBP) α (CEBPA), the feline sarcoma oncogene (FES), the v-Rel avian reticuloendotheliosis viral oncogene homolog B (RELB) and tescalcin (TESC). None of these was associated with de novo methylation events.
Methylation changes were also noted in many essential genes exclusively associated with the DP to SP transition, such as the inositol (1,4,5) trisphosphate 3-kinase B (ITPKB) gene, which is known to be involved in positive selection (37). Accordingly, this gene was demethylated and upregulated at the SP CD4+/CD8+ specification stage (Figure 6B and Supplementary Figure S5). We also found some genes that were exclusively demethylated either in the CD4+ or in the CD8+ lineage, such as ZBTB7B, which was specifically demethylated and overexpressed in SP CD4+ cells.
We also found a few genes that showed more complex regulation kinetics with concurrent silencing and remethylation events. These included the RAG locus, which is specifically demethylated and upregulated in β-selected thymocytes and then remethylated and silenced after positive selection, during the transition from DP TCRαβ+ to SP CD8+ and CD4+ cells. Following the same pattern, CD8A was also demethylated and overexpressed in pre-TCR+ thymocytes but, expectedly, remethylation was only observed in the SP CD4+ subset (Figure 6B and Supplementary Figure S5). In contrast, SP CD8+ cells underwent an additional demethylation event in two CpG sites at an intronic region of the CD8A gene, suggesting that complex regulatory mechanisms control lineage-specific DNA methylation. Epigenetic silencing by remethylation of previously demethylated genes was not a common regulatory mechanism during human T-cell development, but was restricted to a very small subset of genes that also included the gene encoding the CD1a molecule (CD1A); the CAMP-regulated phosphoprotein of the 21 kDa gene (ARPP21); the pre-T-cell antigen receptor alpha gene (PTCRA) and the oxysterol binding protein-like 5 gene (OSBPL5). However, most of the genes repressed during the DP/SP transition (TCF7, NFATC3, RORC, etc.) experienced no associated DNA remethylation event.
DISCUSSION
Genome-wide methylation and gene-expression studies comparing multipotent hematopoietic stem/progenitor cells with terminally differentiated lineage-restricted cells have provided evidence of the magnitude of DNA methylation and gene expression changes during the process of hematopoiesis (15,38,39). To evaluate the contribution of these changes to the particular developmental program of T-cells, we have performed a more systematic analysis of individual maturation stages within the human T-cell lineage and shown that DNA methylation is deeply modulated during the T-cell differentiation process that occurs in the postnatal human thymus. We found that DNA methylation changes in a particular CpG site take place generally only once during development and are then stable in subsequent differentiation stages. These changes consist of demethylation and de novo methylation events, which occur throughout the entire differentiation process, although de novo methylation is mostly restricted to the T-cell commitment stage (step 1). This result is in agreement with the reported role of DNA methyltransferase 3a (DNMT3a) during hematopoietic stem cell differentiation, which seems to be required for epigenetic silencing of some stem cell-specific genes (40). Nonetheless, de novo methylation was poorly correlated with gene repression. In fact, we observed that many important hematopoiesis-related genes known to be repressed during mouse T-cell commitment (13) are also downregulated during the transition from CD34+/CD1a− to CD34+/CD1a+ human thymocytes (LYL1, HHEX, NFE2, MYCN, LMO2, CEBPA, SPI1, etc.), although these changes are not associated with de novo methylation events. This raises the question of how de novo methylation contributes to the T-cell differentiation program and, particularly, to T-cell specification and commitment. A likely explanation is that de novo methylation does not work as a direct regulatory mechanism of gene expression, but might reinforce other repressing mechanisms that are already in place. De novo methylation preceded by gene repression has been well documented in some experimental settings, such as the silencing of retroviral sequences during embryonic development, X chromosome inactivation and the silencing of the imprinted IGF2R gene (41–46). Our results also revealed delayed kinetics associated with de novo DNA methylation. For instance, the LIM domain only 2 protein (LMO2), which is essential during erythroid development, is repressed during early T-cell specification and β-selection, but is methylated de novo at the downstream SP stages. Similarly, the immunoglobulin lambda-like polypeptide (IGLL) gene, which encodes one of the surrogate light-chain subunits of the Pre-B-cell receptor, as well as the pleckstrin (PLEK) gene, which encodes the major Protein kinase C (PKC) substrate in platelets and is involved in phagosome maturation in macrophages, are both downregulated early in development during T-cell commitment, but are not methylated until the β-selection checkpoint. Therefore, de novo methylation of these genes cannot act as the major driver of hematopoietic potential restriction during thymopoiesis, but instead could help fix T-cell commitment at later stages of development. It is also important to emphasize that epigenetic silencing of previously repressed loci is unlikely to be exclusively mediated by DNA methylation, as delayed histone marking also occurs during mouse thymocyte differentiation (13), and thus several repressive epigenetic mechanisms may coincide to ensure strong and irreversible repression. Alternatively, de novo methylation events could represent not only a gain of 5-methylcytosine (5mC) but also of 5-hydroxymethycytosine (5hmC), since analysis methods based on bisulfite DNA modification cannot distinguish the two epigenetic marks. In a very recent report, 5hmC was studied in different mouse T-cell subsets, including two intrathymic populations (DP and SP stages) (47). Although this epigenetic mark constitutes <1% of total CpG methylation in the thymus (48), it was found to be enriched in highly transcribed genes and enhancer regions (47), suggesting a regulatory role in T-cell differentiation. Thus, a proportion of the de novo methylation events noted in our study could be associated with active transcription rather than epigenetic silencing. Nonetheless, 5hmC and 5mC were not simultaneously studied, so we cannot tell whether 5hmC marked an active demethylation process or rather acted as a unique and stable epigenetic mark with its own regulatory function. Future studies will help to clarify the role of 5hmC during T-cell lineage specification.
We found DNA demethylation to be much more frequent than de novo methylation and to be highly correlated with transcriptional activation during thymocyte differentiation. This trend of demethylation has been noted before in the hematopoietic compartment when comparing hematopoietic stem cells with terminally differentiated cells (38) and, in a more detailed study, the prevalence of demethylation over de novo methylation was clearly demonstrated during B lymphopoiesis (49). In human thymocyte maturation, we observed that DNA demethylation affects the expression of many essential genes associated with the T-cell developmental program, but of particular note is the enrichment on TCR-related genes among thymic DMRs. In addition to TCR function genes, we found key developmental genes whose expression is associated with demethylation, such as RORC, CCR7, TCF7, RUNX3, IKAROS, etc. However, the lack of association between DMRs and specific signaling pathways that are essential for T-cell development, such as the NOTCH pathway, is surprising, although it could be because this pathway has a broad developmental role that is not restricted to T-cells.
An important aspect of our results is that DNA methylation appears to contribute to the decision about alternative CD4+ versus CD8+ lineage exclusion during the positive selection process. However, we found CD8+ and CD4+ intrathymic lineages to be very similar at the transcriptional level, in line with previous transcriptome analysis in mouse and human cells (6,12). This similarity was also evident in the methylome, although we identified DMRs that were associated with some transcriptional regulators known to be involved in the CD4 versus CD8 cell fat decision (ZBTB7B, RUNX3, TOX) (50,51) and with potential new candidates, such as ASXL1 and RERE. This suggests that we may not yet have identified all the functional genes regulated at this developmental checkpoint. On the other hand, CD4 was previously reported to be epigenetically silenced in the CD8+ lineage, but we did not observe any de novo-methylated region associated with this gene. There may be DMRs in the CD4 gene that are not covered by the HM450 array. Nonetheless, it has been reported that epigenetic silencing of CD4 is not affected by the inhibition of DNA methylation, suggesting that other mechanisms may be involved (52).
Another significant aspect of DNA methylation kinetics is that they are typically unidirectional, i.e., the newly acquired methylation status in most regions that accumulate methylation changes is not reversed. Notably, most hypermethylation events are concentrated at the early T-cell-specification stage, but we found a poor correlation with gene expression. Taken together, these observations imply that most genes that achieve transient maximum expression at intermediates stages of the differentiation process are silenced by a DNA methylation-independent mechanism. Nevertheless, we identified a few genes that, after demethylation, underwent remethylation and repression in a subsequent stage of differentiation (RAG1, RAG2, PTCRA, CD8A, CD1a, ARPP21 and OSBPL5). Interestingly, some of these genes are essential during T-cell development, but need to be efficiently shutdown to ensure proper maturation. Indeed, repression of RAG1 and RAG2 is critical for ensuring allelic exclusion and T-cell clonality. Also, PTCRA, encoding the pre-Tα surrogate chain, needs to be silenced after TCRB rearrangement to allow for a transient pre-TCR expression and its subsequent replacement by the mature αβ TCR and CD8A gene must be repressed in CD4+ cells to avoid MHC class I binding. Consequently, the remethylation events observed in these genes probably reflect a critical requirement for irreversible epigenetic silencing.
In summary, mapping DMRs during T-cell differentiation has yielded a large catalogue of novel cis- and trans-regulatory elements that will give us further insight into the biological significance of epigenetic regulation during development. Our results show how DNA methylation dynamics are linked with transcriptome networks during thymocyte differentiation and reveal that these changes are mostly irreversible demethylation events often associated with gene expression. In this context, the intuitive notion that epigenetic silencing might drive lineage restriction during T-cell development may be deceptive; rather, it appears that DNA demethylation of lineage-specific genes allows progression during differentiation, and so works as an inductive mechanism, while de novo methylation is mostly an auxiliary mechanism in thymopoiesis. The specific interaction of these DMRs with other epigenetic marks and transcriptional modulators needs to be clarified in further studies in order to complete our picture of the molecular mechanisms underlying T-cell commitment and differentiation in the human thymus.
SUPPLEMENTARY DATA
Supplementary Data are available at NAR Online.
Acknowledgments
We thank the Pediatric Cardiosurgery Units of Hospital Universitario Ramón y Cajal, Hospital Universitario La Paz and Hospital Universitario Doce de Octubre (Madrid, Spain) for the thymus samples.
FUNDING
Plan Nacional de [I+D+I 2008–2011]; Instituto de Salud Carlos III [grant number PI12/02587]; Red Española de Investigación Renal (REDinREN) [grant number RD12/0021/0018 and RD12/0021/0021]; Spanish Ministry of Science and Innovation [grant number SAF2010-15106 and PLE2009-0110]; European Union [Fondos FEDER]; Navarra Government [to D.M.A]; Basque Country Government [Etortek Research Programs 2010/2012]; Bizkaia County's Innovation Technology Department [to A.M.A.]. Funding for open access charge: Instituto de Salud Carlos III [grant number PI12/02587].
Conflict of interest statement. None declared.
REFERENCES
- 1.Marquez C., Trigueros C., Franco J.M., Ramiro A.R., Carrasco Y.R., Lopez-Botet M., Toribio M.L. Identification of a common developmental pathway for thymic natural killer cells and dendritic cells. Blood. 1998;91:2760–2771. [PubMed] [Google Scholar]
- 2.Marquez C., Trigueros C., Fernandez E., Toribio M.L. The development of T and non-T cell lineages from CD34+ human thymic precursors can be traced by the differential expression of CD44. J. Exp. Med. 1995;181:475–483. doi: 10.1084/jem.181.2.475. [DOI] [PMC free article] [PubMed] [Google Scholar]
- 3.de Yebenes V.G., Carrasco Y.R., Ramiro A.R., Toribio M.L. Identification of a myeloid intrathymic pathway of dendritic cell development marked by expression of the granulocyte macrophage-colony-stimulating factor receptor. Blood. 2002;99:2948–2956. doi: 10.1182/blood.v99.8.2948. [DOI] [PubMed] [Google Scholar]
- 4.Weerkamp F., Baert M.R., Brugman M.H., Dik W.A., de Haas E.F., Visser T.P., de Groot C.J., Wagemaker G., van Dongen J.J., Staal F.J. Human thymus contains multipotent progenitors with T/B lymphoid, myeloid, and erythroid lineage potential. Blood. 2006;107:3131–3137. doi: 10.1182/blood-2005-08-3412. [DOI] [PubMed] [Google Scholar]
- 5.Galy A., Verma S., Barcena A., Spits H. Precursors of CD3+CD4+CD8 +cells in the human thymus are defined by expression of CD34. Delineation of early events in human thymic development. J. Exp. Med. 1993;178:391–401. doi: 10.1084/jem.178.2.391. [DOI] [PMC free article] [PubMed] [Google Scholar]
- 6.Dik W.A., Pike-Overzet K., Weerkamp F., de Ridder D., de Haas E.F., Baert M.R., van der Spek P., Koster E.E., Reinders M.J., van Dongen J.J., et al. New insights on human T cell development by quantitative T cell receptor gene rearrangement studies and gene expression profiling. J. Exp. Med. 2005;201:1715–1723. doi: 10.1084/jem.20042524. [DOI] [PMC free article] [PubMed] [Google Scholar]
- 7.Ramiro A.R., Trigueros C., Marquez C., San Millan J.L., Toribio M.L. Regulation of pre-T cell receptor (pT alpha-TCR beta) gene expression during human thymic development. J. Exp. Med. 1996;184:519–530. doi: 10.1084/jem.184.2.519. [DOI] [PMC free article] [PubMed] [Google Scholar]
- 8.Rothenberg E.V. T cell lineage commitment: identity and renunciation. J. Immunol. 2011;186:6649–6655. doi: 10.4049/jimmunol.1003703. [DOI] [PMC free article] [PubMed] [Google Scholar]
- 9.Rothenberg E.V., Moore J.E., Yui M.A. Launching the T-cell-lineage developmental programme. Nat. Rev. Immunol. 2008;8:9–21. doi: 10.1038/nri2232. [DOI] [PMC free article] [PubMed] [Google Scholar]
- 10.Naito T., Tanaka H., Naoe Y., Taniuchi I. Transcriptional control of T-cell development. Int. Immunol. 2011;23:661–668. doi: 10.1093/intimm/dxr078. [DOI] [PubMed] [Google Scholar]
- 11.Braunstein M., Anderson M.K. HEB in the spotlight: transcriptional regulation of T-cell specification, commitment, and developmental plasticity. Clin. Dev. Immunol. 2012;2012:678705. doi: 10.1155/2012/678705. [DOI] [PMC free article] [PubMed] [Google Scholar]
- 12.Mingueneau M., Kreslavsky T., Gray D., Heng T., Cruse R., Ericson J., Bendall S., Spitzer M.H., Nolan G.P., Kobayashi K., et al. The transcriptional landscape of alphabeta T cell differentiation. Nat. Immunol. 2013;14:619–632. doi: 10.1038/ni.2590. [DOI] [PMC free article] [PubMed] [Google Scholar]
- 13.Zhang J.A., Mortazavi A., Williams B.A., Wold B.J., Rothenberg E.V. Dynamic transformations of genome-wide epigenetic marking and transcriptional control establish T cell identity. Cell. 2012;149:467–482. doi: 10.1016/j.cell.2012.01.056. [DOI] [PMC free article] [PubMed] [Google Scholar]
- 14.Vigano M.A., Ivanek R., Balwierz P., Berninger P., van Nimwegen E., Karjalainen K., Rolink A. An epigenetic profile of early T-cell development from multipotent progenitors to committed T-cell descendants. Eur. J. Immunol. 2014;44:1181–1193. doi: 10.1002/eji.201344022. [DOI] [PubMed] [Google Scholar]
- 15.Ji H., Ehrlich L.I., Seita J., Murakami P., Doi A., Lindau P., Lee H., Aryee M.J., Irizarry R.A., Kim K., et al. Comprehensive methylome map of lineage commitment from haematopoietic progenitors. Nature. 2010;467:338–342. doi: 10.1038/nature09367. [DOI] [PMC free article] [PubMed] [Google Scholar]
- 16.Suarez-Alvarez B., Rodriguez R.M., Fraga M.F., Lopez-Larrea C. DNA methylation: a promising landscape for immune system-related diseases. Trends Genet. 2012;28:506–514. doi: 10.1016/j.tig.2012.06.005. [DOI] [PubMed] [Google Scholar]
- 17.Wilson C.B., Rowell E., Sekimata M. Epigenetic control of T-helper-cell differentiation. Nature Rev. Immunol. 2009;9:91–105. doi: 10.1038/nri2487. [DOI] [PubMed] [Google Scholar]
- 18.Scharer C.D., Barwick B.G., Youngblood B.A., Ahmed R., Boss J.M. Global DNA methylation remodeling accompanies CD8 T cell effector function. J. Immunol. 2013;191:3419–3429. doi: 10.4049/jimmunol.1301395. [DOI] [PMC free article] [PubMed] [Google Scholar]
- 19.Schoenborn J.R., Dorschner M.O., Sekimata M., Santer D.M., Shnyreva M., Fitzpatrick D.R., Stamatoyannopoulos J.A., Wilson C.B. Comprehensive epigenetic profiling identifies multiple distal regulatory elements directing transcription of the gene encoding interferon-gamma. Nat. Immunol. 2007;8:732–742. doi: 10.1038/ni1474. [DOI] [PMC free article] [PubMed] [Google Scholar]
- 20.Cohen C.J., Crome S.Q., MacDonald K.G., Dai E.L., Mager D.L., Levings M.K. Human Th1 and Th17 cells exhibit epigenetic stability at signature cytokine and transcription factor loci. J. Immunol. 2011;187:5615–5626. doi: 10.4049/jimmunol.1101058. [DOI] [PubMed] [Google Scholar]
- 21.Schmidl C., Hansmann L., Andreesen R., Edinger M., Hoffmann P., Rehli M. Epigenetic reprogramming of the RORC locus during in vitro expansion is a distinctive feature of human memory but not naive Treg. Eur. J. Immunol. 2011;41:1491–1498. doi: 10.1002/eji.201041067. [DOI] [PubMed] [Google Scholar]
- 22.Floess S., Freyer J., Siewert C., Baron U., Olek S., Polansky J., Schlawe K., Chang H.D., Bopp T., Schmitt E., et al. Epigenetic control of the foxp3 locus in regulatory T cells. PLoS Biol. 2007;5:e38. doi: 10.1371/journal.pbio.0050038. [DOI] [PMC free article] [PubMed] [Google Scholar]
- 23.Poggi A., Costa P., Morelli L., Cantoni C., Pella N., Spada F., Biassoni R., Nanni L., Revello V., Tomasello E., et al. Expression of human NKRP1A by CD34+ immature thymocytes: NKRP1A-mediated regulation of proliferation and cytolytic activity. Eur. J. Immunol. 1996;26:1266–1272. doi: 10.1002/eji.1830260613. [DOI] [PubMed] [Google Scholar]
- 24.Trigueros C., Ramiro A.R., Carrasco Y.R., de Yebenes V.G., Albar J.P., Toribio M.L. Identification of a late stage of small noncycling pTalpha- pre-T cells as immediate precursors of T cell receptor alpha/beta+ thymocytes. J. Exp. Med. 1998;188:1401–1412. doi: 10.1084/jem.188.8.1401. [DOI] [PMC free article] [PubMed] [Google Scholar]
- 25.Bibikova M., Barnes B., Tsan C., Ho V., Klotzle B., Le J.M., Delano D., Zhang L., Schroth G.P., Gunderson K.L., et al. High density DNA methylation array with single CpG site resolution. Genomics. 2011;98:288–295. doi: 10.1016/j.ygeno.2011.07.007. [DOI] [PubMed] [Google Scholar]
- 26.Gentleman R.C., Carey V.J., Bates D.M., Bolstad B., Dettling M., Dudoit S., Ellis B., Gautier L., Ge Y., Gentry J., et al. Bioconductor: open software development for computational biology and bioinformatics. Genome Biol. 2004;5:R80. doi: 10.1186/gb-2004-5-10-r80. [DOI] [PMC free article] [PubMed] [Google Scholar]
- 27.Du P., Kibbe W.A., Lin S.M. lumi: a pipeline for processing Illumina microarray. Bioinformatics. 2008;24:1547–1548. doi: 10.1093/bioinformatics/btn224. [DOI] [PubMed] [Google Scholar]
- 28.Smyth G.K. Linear models and empirical bayes methods for assessing differential expression in microarray experiments. Stat. Appl. Genet. Mol. Biol. 2004;3:Article3. doi: 10.2202/1544-6115.1027. [DOI] [PubMed] [Google Scholar]
- 29.Du P., Zhang X., Huang C.C., Jafari N., Kibbe W.A., Hou L., Lin S.M. Comparison of Beta-value and M-value methods for quantifying methylation levels by microarray analysis. BMC Bioinformatics. 2010;11:587–595. doi: 10.1186/1471-2105-11-587. [DOI] [PMC free article] [PubMed] [Google Scholar]
- 30.Zhang H., Meltzer P., Davis S. RCircos: an R package for Circos 2D track plots. BMC Bioinformatics. 2013;14:244–248. doi: 10.1186/1471-2105-14-244. [DOI] [PMC free article] [PubMed] [Google Scholar]
- 31.Shannon P., Markiel A., Ozier O., Baliga N.S., Wang J.T., Ramage D., Amin N., Schwikowski B., Ideker T. Cytoscape: a software environment for integrated models of biomolecular interaction networks. Genome Res. 2003;13:2498–2504. doi: 10.1101/gr.1239303. [DOI] [PMC free article] [PubMed] [Google Scholar]
- 32.Bastian M., Heymann S., Jacomy M. Gephi: an open source software for exploring and manipulating networks. International AAAI Conference on Weblogs and Social Media. 2009:361–362. [Google Scholar]
- 33.Fruchterman T.M., Reingold E.M. Graph drawing by force-directed placement. Software: Pract. Exp. 1991;21:1129–1164. [Google Scholar]
- 34.Hertoghs K.M., Moerland P.D., van Stijn A., Remmerswaal E.B., Yong S.L., van de Berg P.J., van Ham S.M., Baas F., ten Berge I.J., van Lier R.A. Molecular profiling of cytomegalovirus-induced human CD8+ T cell differentiation. J. Clin. Invest. 2010;120:4077–4090. doi: 10.1172/JCI42758. [DOI] [PMC free article] [PubMed] [Google Scholar]
- 35.van Gisbergen K.P., Kragten N.A., Hertoghs K.M., Wensveen F.M., Jonjic S., Hamann J., Nolte M.A., van Lier R.A. Mouse Hobit is a homolog of the transcriptional repressor Blimp-1 that regulates NKT cell effector differentiation. Nat. Immunol. 2012;13:864–871. doi: 10.1038/ni.2393. [DOI] [PubMed] [Google Scholar]
- 36.Thomassin H., Flavin M., Espinas M.L., Grange T. Glucocorticoid-induced DNA demethylation and gene memory during development. EMBO J. 2001;20:1974–1983. doi: 10.1093/emboj/20.8.1974. [DOI] [PMC free article] [PubMed] [Google Scholar]
- 37.Wen B.G., Pletcher M.T., Warashina M., Choe S.H., Ziaee N., Wiltshire T., Sauer K., Cooke M.P. Inositol (1,4,5) trisphosphate 3 kinase B controls positive selection of T cells and modulates Erk activity. Proc. Natl. Acad. Sci. U.S.A. 2004;101:5604–5609. doi: 10.1073/pnas.0306907101. [DOI] [PMC free article] [PubMed] [Google Scholar]
- 38.Calvanese V., Fernandez A.F., Urdinguio R.G., Suarez-Alvarez B., Mangas C., Perez-Garcia V., Bueno C., Montes R., Ramos-Mejia V., Martinez-Camblor P., et al. A promoter DNA demethylation landscape of human hematopoietic differentiation. Nucleic Acids Res. 2012;40:116–131. doi: 10.1093/nar/gkr685. [DOI] [PMC free article] [PubMed] [Google Scholar]
- 39.Deaton A.M., Webb S., Kerr A.R., Illingworth R.S., Guy J., Andrews R., Bird A. Cell type-specific DNA methylation at intragenic CpG islands in the immune system. Genome Res. 2011;21:1074–1086. doi: 10.1101/gr.118703.110. [DOI] [PMC free article] [PubMed] [Google Scholar]
- 40.Challen G.A., Sun D., Jeong M., Luo M., Jelinek J., Berg J.S., Bock C., Vasanthakumar A., Gu H., Xi Y., et al. Dnmt3a is essential for hematopoietic stem cell differentiation. Nat. Genet. 2012;44:23–31. doi: 10.1038/ng.1009. [DOI] [PMC free article] [PubMed] [Google Scholar]
- 41.Gautsch J.W., Wilson M.C. Delayed de novo methylation in teratocarcinoma suggests additional tissue-specific mechanisms for controlling gene expression. Nature. 1983;301:32–37. doi: 10.1038/301032a0. [DOI] [PubMed] [Google Scholar]
- 42.Niwa O., Yokota Y., Ishida H., Sugahara T. Independent mechanisms involved in suppression of the Moloney leukemia virus genome during differentiation of murine teratocarcinoma cells. Cell. 1983;32:1105–1113. doi: 10.1016/0092-8674(83)90294-5. [DOI] [PubMed] [Google Scholar]
- 43.Lock L.F., Takagi N., Martin G.R. Methylation of the Hprt gene on the inactive X occurs after chromosome inactivation. Cell. 1987;48:39–46. doi: 10.1016/0092-8674(87)90353-9. [DOI] [PubMed] [Google Scholar]
- 44.Wutz A., Jaenisch R. A shift from reversible to irreversible X inactivation is triggered during ES cell differentiation. Mol. cell. 2000;5:695–705. doi: 10.1016/s1097-2765(00)80248-8. [DOI] [PubMed] [Google Scholar]
- 45.Santoro F., Mayer D., Klement R.M., Warczok K.E., Stukalov A., Barlow D.P., Pauler F.M. Imprinted Igf2r silencing depends on continuous Airn lncRNA expression and is not restricted to a developmental window. Development. 2013;140:1184–1195. doi: 10.1242/dev.088849. [DOI] [PubMed] [Google Scholar]
- 46.Bird A. DNA methylation patterns and epigenetic memory. Genes Dev. 2002;16:6–21. doi: 10.1101/gad.947102. [DOI] [PubMed] [Google Scholar]
- 47.Tsagaratou A., Aijo T., Lio C.W., Yue X., Huang Y., Jacobsen S.E., Lahdesmaki H., Rao A. Dissecting the dynamic changes of 5-hydroxymethylcytosine in T-cell development and differentiation. Proc. Natl. Acad. Sci. U.S.A. 2014;111:E3306–E3315. doi: 10.1073/pnas.1412327111. [DOI] [PMC free article] [PubMed] [Google Scholar]
- 48.Ito S., Shen L., Dai Q., Wu S.C., Collins L.B., Swenberg J.A., He C., Zhang Y. Tet proteins can convert 5-methylcytosine to 5-formylcytosine and 5-carboxylcytosine. Science. 2011;333:1300–1303. doi: 10.1126/science.1210597. [DOI] [PMC free article] [PubMed] [Google Scholar]
- 49.Lee S.T., Xiao Y., Muench M.O., Xiao J., Fomin M.E., Wiencke J.K., Zheng S., Dou X., de Smith A., Chokkalingam A., et al. A global DNA methylation and gene expression analysis of early human B-cell development reveals a demethylation signature and transcription factor network. Nucleic Acids Res. 2012;40:11339–11351. doi: 10.1093/nar/gks957. [DOI] [PMC free article] [PubMed] [Google Scholar]
- 50.Aliahmad P., Kadavallore A., de la Torre B., Kappes D., Kaye J. TOX is required for development of the CD4 T cell lineage gene program. J. Immunol. 2011;187:5931–5940. doi: 10.4049/jimmunol.1101474. [DOI] [PMC free article] [PubMed] [Google Scholar]
- 51.Collins A., Hewitt S.L., Chaumeil J., Sellars M., Micsinai M., Allinne J., Parisi F., Nora E.P., Bolland D.J., Corcoran A.E., et al. RUNX transcription factor-mediated association of Cd4 and Cd8 enables coordinate gene regulation. Immunity. 2011;34:303–314. doi: 10.1016/j.immuni.2011.03.004. [DOI] [PMC free article] [PubMed] [Google Scholar]
- 52.Zou Y.R., Sunshine M.J., Taniuchi I., Hatam F., Killeen N., Littman D.R. Epigenetic silencing of CD4 in T cells committed to the cytotoxic lineage. Nat. Genet. 2001;29:332–336. doi: 10.1038/ng750. [DOI] [PubMed] [Google Scholar]
Associated Data
This section collects any data citations, data availability statements, or supplementary materials included in this article.