


Abstract
We explore the role of DNA damage processing in the progression of cognitive decline by creating a new mouse model. The new model is a cross of a common Alzheimer's disease (AD) mouse (3xTgAD), with a mouse that is heterozygous for the critical DNA base excision repair enzyme, DNA polymerase β. A reduction of this enzyme causes neurodegeneration and aggravates the AD features of the 3xTgAD mouse, inducing neuronal dysfunction, cell death and impairing memory and synaptic plasticity. Transcriptional profiling revealed remarkable similarities in gene expression alterations in brain tissue of human AD patients and 3xTg/Polβ+/− mice including abnormalities suggestive of impaired cellular bioenergetics. Our findings demonstrate that a modest decrement in base excision repair capacity can render the brain more vulnerable to AD-related molecular and cellular alterations.
INTRODUCTION
Alzheimer's disease (AD) represents a major social and medical challenge for modern society. While insight into inheritable (familial) AD has enhanced our understanding of the process of disease initiation, we still have only a limited comprehension of mechanisms involved in the progression of the disease. A recent assessment of Alzheimer's drugs in development has reported a drug failure rate of over 99% (1). The poor clinical results are indicative of an incomplete understanding of disease progression. Here, we focus on identifying mechanisms that may be responsible for accelerating progression of AD. We consider that an age-related decline in DNA damage processing may exacerbate AD progression. Previous studies have shown that DNA damage, particularly oxidative DNA damage, accumulates in AD and its precursor, mild cognitive impairment (MCI) (2–18). Other studies have documented that DNA repair is dysregulated in AD, using postmortem brain, mouse models or cell lines (2,16,17,19–28). These findings support the notion that oxidative stress is an early and significant event in AD progression.
Both AD (29–32) and aging (reviewed (33)) have been reported to be associated with an increase in oxidative stress. The blood-brain barrier protects against many exogenous DNA damaging agents, but does not offer protection against endogenous DNA damage resulting from spontaneous decay or reactions with radical species generated during normal cellular respiration. As a direct consequence of the high levels of oxygen consumption in the brain, oxidative DNA damage, in particular, presents a major threat to neuronal function and viability (34). The steady-state level of oxidative DNA damage within the brain is a dynamic balance between DNA damage and DNA repair. At the forefront of oxidative DNA damage repair is the base excision repair (BER) pathway. BER corrects DNA lesions through the action of DNA glycosylases that excise damaged bases, AP endonucleases that initiate removal of abasic sites, DNA polymerases that insert the correct base(s) and DNA ligases that reseal the DNA backbone (35). The primary polymerase involved in BER is DNA polymerase beta (Polβ). Notably, loss of any of the central components of BER results in early embryonic or post-natal lethality (reviewed (36)). In the case of Polβ, death of null embryos occurs in the late stages of embryogenesis and is associated with neuronal development defects (37). Consistent with a particular vulnerability of neurons to reduced BER, we (38) and others (39) have reported that repair of oxidative DNA damage in neurons is heavily dependent on Polβ.
We previously reported that DNA repair was reduced on a range of oxidative DNA substrates in extracts from the brain tissue of patients with AD or MCI (19). This reduced activity was associated with lower levels of DNA polymerase β protein and gap-filling activity. Other BER enzymatic activities, namely base excision, abasic site incision and nick ligation, were not significantly altered, suggesting that among these patients, Polβ is rate limiting for repair (19). There was also a strong inverse correlation between DNA gap filling activity and neuropathological severity (Braak stage). The reduced levels of Polβ in patients with MCI suggest that loss of Polβ occurs early in the disease process. Consistent with these data, other studies have shown that Down syndrome patients have an abnormally high risk of AD and also have decreased levels of Polβ (40–43).
To test the hypothesis that reduced repair of oxidative DNA damage can exacerbate AD pathology, we utilized a widely used mouse model of AD (3xTgAD mice) and assessed the consequence of reduced BER (Polβ haploinsufficiency) on cognitive function, synaptic plasticity, Aβ pathology and neurodegeneration. 3xTgAD mice, which express mutant forms of human β-amyloid precursor protein (APP), presenilin-1 and Tau, develop age-dependent extracellular Aβ plaques, intracellular Tau accumulation, oxidative stress and cognitive deficits (44,45), but no neuronal degeneration. Thus, we generated 3xTgAD mice heterozygous for Polβ to assess the potential impact of reduced Polβ levels in order to mimic what is seen in human AD patients in a mouse model.
Our studies reveal that 3xTg/Polβ+/− mice have deficiencies in Polβ activity and BER capacity, which results in a significant increase in DNA damage accumulation. Moreover, in contrast to the 3xTgAD mice, and more similar to human AD patients, 3xTg/Polβ+/− mice exhibit neuronal death, which was associated with accumulation of intracellular Aβ and impaired autophagy. Brain gene expression analysis revealed a transcriptomic profile of 3xTg/Polβ+/− mice that is more similar to human AD patients than either Polβ+/− or 3xTgAD mice. Thus, reducing Polβ levels on the background of aberrant APP processing and Tau accumulation is sufficient to accelerate synaptic and cognitive deficits, and elicit an AD-like molecular fingerprint and neuronal degeneration.
MATERIALS AND METHODS
Animals
All mice were maintained on a standard NIH diet with a 12-h light/dark cycle. Animals were group housed where possible and had ad lib access to food and water throughout the trial. All mice were bred at the National Institute of Aging (Baltimore, MD, USA). The original 3xTgAD line was generated as described previously (45,46)), the strain was created by microinjecting the APP (Swe) and tau (P301L) genes into a homozygous PS1(M146V) embryo. The APP(Swe) and tau(P301L) genes are randomly knocked-in and co-integrated at the same site and thus do not independently segregate. Our 3xTg/WT Polβ and 3xTg/Polβ(+/-) stains were polymerase chain reaction screened for each gene and maintained as PS1 (M146V) homozygous and positive for APP (Swe) and tau (P301L). We have used western blotting to distinguish one versus two cassettes of APP and tau. Polβ(+/-) mice on a mixed genetic background were originally obtained from Dr A.R. Heydari (Wayne State University) (47,48). Wild type (WT) mice were derived from breeding Polβ(+/-) mice. The Polβ colony was maintained by breeding WT and Polβ(+/-) since homozygous mice are embryonic lethal. The 3xTg/WT Polβ and 3xTg/Polβ(+/-) stains were maintained similarly. Only female adult mice were used in the experiments with litter mate controls used throughout. All experiments were done blinded using only mouse identification numbers with the exception of western protein analysis and metabolic studies. In animal behavioral studies, animals were randomized in processing order. Further, for repeat behavioral analysis including Morris water maze (MWM), processing order was randomized each day of training.
Microarray analysis
Gene expression analysis was conducted on 19 female mice, (WT n = 5, Polβ n = 4, 3xTgAD n = 6 and 3xTg/Polβ n = 4). Transcriptional profiling was determined using Illumina Sentrix BeadChips (Illumina, San Diego, CA, USA). Total RNA was extracted from the prefrontal cortex using an RNA extraction kit (Qiagen) with further purification using a second column (RNA clean and concentrate, Zymo Research). Initial quantitation was conducted using a NanoDrop ND-1000 spectrophotometer. The quality of the RNA was inspected using a 2100 Bioanalyzer (Aligent technologies). Samples below an RNA integrity number of 7.5 were discarded. The microarray was performed by the Gene expression and Genomics core facility (NIA) and analyzed using DIANE 6.0 software (see http://www.grc.nia.nih.gov/branches/rrb/dna/diane_software.pdf for information). Transcriptional profiling was determined using Illumina Sentrix BeadChips. Total RNA was used to generate biotin-labeled cRNA using the Illumina TotalPrep RNA Amplification Kit. In short, 0.5 μg of total RNA was first converted into single-stranded cDNA with reverse transcriptase using an oligo-dT primer containing the T7 RNA polymerase promoter site and then copied to produce double-stranded cDNA molecules. The double-stranded cDNA was cleaned and concentrated with the supplied columns and used in an overnight in vitro transcription reaction where single-stranded RNA (cRNA) was generated incorporating biotin-16-UTP. A total of 0.75 μg of biotin-labeled cRNA was hybridized at 58°C for 16 h to Illumina's Sentrix Mouse Ref-8 Expression BeadChips (Illumina, San Diego, CA, USA). Each BeadChip has ∼25 600 well-annotated RefSeq transcripts with ∼30-fold redundancy. The arrays were washed, blocked and the labeled cRNA was detected by staining with streptavidin-Cy3. Hybridized arrays were scanned using an Illumina BeadStation 500X Genetic Analysis Systems scanner and the image data extracted using the Illumina GenomeStudio software, version 1.1.1.1. Raw microarray data were log transformed to yield z-scores. The z-ratio was calculated as the difference between the observed gene z-scores for the experimental and the control comparisons, and dividing by the standard deviation associated with the distribution of these differences. Z-ratio values of ±1.5 were chosen as cut-off values and calculated using a 5% false discovery rate threshold. A complete set of 522 cellular pathways was obtained from the Molecular Signatures Database (MSigDB, Broad Institute, Massachusetts Institute of Technology, MA, USA). The complete set was tested for Geneset enrichment using parametric analysis of gene set enrichment (49). For each pathway z-score, a P-value was computed using JMP 6.0 software to test for the significance of the z-score obtained. The microarray data have been deposited in Gene Expression Omnibus (GEO accession: GSE60911).
Western DNA polymerase β protein quantitation
Mice were euthanized by cervical dislocation, with the brain removed from the skull and dissected into regions of interest. Protein was extracted by initially homogenizing the samples in radioimmunoprecipitation assay (RIPA) buffer with Halt protease inhibitor cocktail (Pierce) on ice for 30 min. After incubation samples were centrifuged at 10 000 x g at 4°C for 15 min. Supernatant was removed and aliquoted before storage at −80°C. Protein concentration was determined using a bicinchoninic acid assay using bovine serum albumin (BSA) standards (Pierce). 100 μg of total protein lysate was separated on a mini-protean®TGX™ gradient (4–15%) gel (Bio-Rad) at 60 V for 120 min. Transfer was conducted overnight onto a Novex®polyvinyl difluoride (PVDF) 0.2-μm membranes (Life Science) at 4°C at 40 V. Membranes were blocked in 4% milk protein for 60 min at RT. Overnight exposure to primary antibody at 4°C. Secondary (1:10,000) (GE lifesciences) for 120 min at room temperature (RT). Antibodies utilized; anti-DNA polymerase β (Trevigen, 4445-MC-100) and anti-Lamin A/C (Santa Cruz). Secondary horseradish peroxidase (HRP) conjugate was detected by chemiluminescence (Super Signal West Femto, Pierce) on a Chemidoc imager XRS+™ (Bio-Rad). Images were analyzed and quantitated using ImageLab (V3.0) (Bio-Rad) with DNA polymerase β signal normalized to either Lamin A/C. Protein samples were assayed according to age with a minimum of three mice per group and two technical replicates.
Plasmid-based BER substrate preparation
Substrates containing a single defined lesion were prepared as previously described (60). Briefly, oligonucleotides were commercially synthesized (Integrated DNA Technologies) containing either a uracil or a cytosine in a defined location. The oligonucleotides were phosphorylated using phosphonucleokinase (New England Biolabs) and annealed to single-stranded DNA prepared from pGEM-3Zf(+). Subsequently, the primed plasmid was replicated using T4 DNA polymerase (New England Biolabs) and ligated with T4 DNA ligase (New England Biolabs) in the presence of T4 Gene 32 Protein and BSA. To purify covalently closed, circular DNA substrates, reaction products were separated by size and purified (Qiagen).
Protein extract preparations for repair activity
Proteins were extracted from animal brain sections by homogenizing with an equal tissue volume (1XTV) of Buffer I (10-mM Tris-HCl, pH 8.0, 200-mM KCl), followed by addition of another 1XTV of Buffer II (10-mM Tris-HCl, pH 8.0, 200-mM KCl, 2-mM EDTA, 40% glycerol, 0.5% NP-40, 2-mM DTT) and protease inhibitor cocktail (1X total volume, Thermo Fisher, Rockville, IL, USA). Extracts were incubated at 4°C for 2 h with rotation. Next, extracts were centrifuged at 14 000 rpm in a microfuge at 4°C for 15 min. Supernatants were removed to a new tube and protein concentrations were determined (Thermo Fisher) followed by aliquoting extracts into small volumes and storage at −80°C.
BER in vitro repair assay
BER assays were performed under described conditions (Akbari, Otterlei et al. 2004), with few exceptions. Protein was diluted as described in text in 35 μl of purified water. A master mix of 5X reaction buffer (25-mM MgCl2, 200-mM Hepes, pH 7.8, 2.5-mM DTT, 10-mM ATP, 100-μM dNTPs, 1.8-mg/ml BSA), plasmid substrate (250 ng/reaction), protease and phosphatase inhibitors (Thermo Fisher) and either γ-32P-dCTP or γ-32P-dGTP (2.0 μCu/reaction) as specified in text was added to the diluted proteins for a total of 50-μl reactions. Reactions were incubated at 30°C for 1 h and DNA was purified (Qiagen) before restriction digest. Restriction digests were performed at 37°C for 1 h. An equal volume of loading buffer (90% formamide) was added to each digest and half of the total volume was electrophoresed on a 20% denaturing polyacrylamide gel at 15 W for 1 h. Labeled fragments were visualized by phosphorimaging (Typhoon GE healthcare).
Comet analysis of DNA damage in brain regions
We used a protocol for quantifying DNA damage of cells by the single cell comet electrophoresis method in multiple mini-gels previously described in (50). Brain regions from 20-month-old mice were dissected and homogenized in 1X phosphate buffered saline (PBS) on ice. The homogenate was passed through a 0.45-μm filter to catch any remaining tissue fragments. The extracts were then spun down at 800 x g for 10 min at 4°C. The supernatant was removed and the nuclei pellet weighed and re-diluted in the appropriate ratio of 1X PBS. The nuclei were added to melted agarose at a ratio of 4:1. Approximately 4 μl of agarose cell suspension was dotted onto the hydrophilic side of the GelBond film (Lonza), repeated as necessary for each sample using a multi-channel pipette. The membrane was allowed to cool and the cells lyzed overnight at 4°C, using standard neutral comet protocol (50). We ran the electrophoresis at 25 V for 30 min at 4°C and stained with 1x SYBR Gold (Life Technologies). Comets were imaged using a fluorescent microscope and comet analysis software. All four mice were run together on a single film for each section, reducing variability. At least 50 comets were taken and the assay was repeated with different ages with similar trends always observed in the data. Statistical analysis was conducted on the data using one-way ANOVA.
Cardiac perfusion and sectioning
The cohorts of 6-, 14- and 24-month-old mice (n = 4) of each phenotype were anesthetized by isoflurane inhalation. The animals were cardiac perfused with 0.1-M PBS followed by 4% parafolmaldehyde. Animals were decapitated and brains were immediately removed. The brains were placed in 4% paraformaldehyde for 48 h, followed by equilibration in 30% sucrose. Tissue was sectioned coronally (40 μm) on a freezing microtome (Thermo-Fisher) and stored at −20°C in tissue cryoprotectant solution (TCS) .
DNA damage visualization in tissue
Tissue sections (40 μm) were mounted on slides and air dried overnight. Slides were rehydrated and then heated in a solution of 0.1-M citrate buffer (pH 6) for 10 min and left to cool to RT. It was imperative to be able to clearly distinguish single nuclei from neighboring nuclei to achieve accurate damage quantitation. The close proximity of nuclei in the hippocampal regions particularly the dentate gyrus and CA1 regions hampered quantitation. Consequently, damage assessment was limited to neuronal and non-neuronal nuclei in the frontal cortex where nuclei boundaries could be clearly delineated. Double-stranded breaks (DSBs) were detected with two alternate antibodies, a 53BP1 DyLight™ 550 preconjugated antibody (Novus Biology, NB100-304R) and γH2AX (Ser139) Alexa Fluor® 488 conjugated antibody (Cell Signaling Technology®, #9719). Slides were mounted in Vectashield with DAPI (Vector Labs). Cortex sections from four mice per age, per genotype were assessed for DNA damage using the γH2AX marker. γH2AX foci were manually counted in blinded samples.
Apoptotic activation in tissue
Tissue sections were prepared as per DNA damage visualization section above. Images were taken of every sixth brain section (coronal) of at least three mice per group, per age. Apoptotic activation was measured by the fluorescent intensity of acleaved-caspase-3-specific primary antibody (Asp175) (Cell Signaling Technology®, #9579S) conjugated with Goat anti-rabbit 488 secondary antibody (Invitrogen). The captured images were analyzed for relative quantification of cleaved-caspase 3 intensity using Image J software (51). Briefly, a 25 × 25 pixel box was positioned over the area of interest and the average intensity within the selection measured (the sum of the intensities of all the pixels in the selection divided by the number of pixels). Lipofuscin-related baseline auto-fluorescence was calculated by measuring the intensity of fluorescence of negative (no primary antibody) samples (52). At least 100 tissue areas per experiment were analyzed from two independent experiments. Of note, areas that had excessive amounts of background in all samples, which included the dentate gyrus, were not included in the analysis.
Amyloid deposition and cleaved caspase-3 activation
We measure the amount of co-localization between Aβ and cleaved caspase-3 using the same tissue preparation as described above. Antibodies used were cleaved-caspase-3 (Asp175) (Cell Signaling Technology®,#9579S) and human Aβ amyloid (Cell Signaling, #2454). The Aβ antibody used was raised against N-terminal residues (672–713 (Aβ42) and 672–711 (Aβ40)) and hence is more specific for these fragments but can also detect other Aβ fragments (such as Aβ-37, Aβ-38 and Aβ-39) and to a lesser extent the n-terminal of full length APP. Six-month cortex tissue was investigated from either 3xTgAD or 3xTg/Polβ mice, WT and Polβ mice do not express human APP or derivatives and were consequently omitted from this analysis. At least three mice from each group were measured. Cells with co-localization were determined using average background cut-off intensity values negating any lipofuscin related auto-fluorescence. Percentage of cells with strong co-localization was determined from all cells with amyloid accumulation.
ELISA of AD relevant peptides
Kits were purchased from Invitrogen to measure the protein concentration of human amyloid beta (Aβ) 40 and 42, human Tau protein and mouse Aβ 40 and 42. All proteins were diluted to 5 μg/μl in extraction buffer, and 10 μl of each sample was added to 10-μl 8M guanidine HCl to improve detection. Diluent buffer was added to achieve a final 1:10 dilution. Standard dilutions of each protein were prepared as directed. Averages and standard errors were calculated from each genotype from three to four mice. Each individual sample was assayed in duplicate or triplicate. Tissue was taken from the hippocampal region. Standard curves were obtained with r2 values >0.975 per experiment. For further information refer to manufactures instructions.
Detect and quantitation of autophagic markers
We measured markers of autophagy and apoptosis at 14 months by previously described western. Primary antibodies to Beclin-1 (#PRS3613, Sigma-Aldrich), Caspase-3 (#9662, cell signaling), BCL-2 (#2570, cell signaling), p62 (#8025, cell signaling) and LC3 (#NB100-2220, Novus) were used with HRP-conjugated secondary antibodies (GE lifesciences).
Measurement of AD relevant peptides, plaque number and size
The slides were blocked with blocking buffer (10% goat serum or other) for 30 min, then incubated with primary antibodies raised against human Aβ amyloid (Cell Signaling, #2454) or human PHF-Tau (Pierce Endogen, #MN1040B, clone AT180) over 24–48 h at 4°C. After washing, Alexa 488 or Alexa568 (1:500, Invitrogen) 2nd antibodies were incubated for 1–2 h at room temperature, then washed again and incubated with 10-nM Hoechst for 30 min. The slides were mounted with fluorescence mounting medium (Vector; USA), sealed with coverslips and visualized under confocal laser microscopy (Zeiss LSM 510). For non-specific staining and negative control, primary antibodies were omitted. The mozaix module addition to the Zeiss axiovison software (Zeiss) was used to take images of entire sections. The whole brain images (every sixth slice from olfactory to cerebellum) were batch analyzed in Velocity (PerkinElmer). Plaque size and quantity was measured throughout the brain. Only objects bigger than 10 μm and smaller than 1000 μm were counted. At least three mice for each group at each age were counted.
Morris water maze
Mice were trained in the MWM (53) to locate a platform submerged 10 mm below the surface of a pool filled with water at 25°C, made opaque with white non-toxic paint. In the pre-training phase the mice were introduced to the apparatus for 90 s and assessed for the ability to find a visible platform. After the pre-training phase all future trials were blinded. The next day the mice began the training phase. Each mouse had four trials per day, with the starting point changed after each trial. Each trial lasted 60 s or until the mouse located the platform. If the platform was not located within the allotted period then the mouse was guided to the platform. The mouse was rested on the platform for 15 s after each trial. The mice were trained for 7 days or until significant improvement was measured. Upon completion of the training phase, the platform was removed for the probe trials. The probe trials were 60 s in duration and began 4 h after the last training phase. The probe trial measured whether the mouse could recall which quadrant previously contained the platform. All parameters were recorded semi-automatically by a video tracking system (Anymaze, Stoelting). The maze parameters were changed according to the age of the mouse. Poor performances in the learning phase at 14 months resulted in alterations in the water maze setup to enhance learning at 20 months, this included more prominent and numerous visual cues. Statistics employed included the comparison of the time in the four quadrants separately for each time and mouse type. We were only interested in comparing the target quadrant with the other three quadrants and so a Bonferroni adjustment was made for these three comparisons. This protocol included the pre-established exclusion criteria that if a mouse did not swim during the training phase, the animal would be excluded from all analysis. No single group was found to be preferentially affected by the exclusion criteria.
Open field maze
Animals were placed in the center of a defined open field region (43 cm × 42 cm) (Med Associates, Georgia, VT, USA) and left without disruption for 15 min. The center zone was defined as a 10.2 cm2 equidistant from the peripheral walls. Movement was monitored by two sets of pulsed modulated infrared photobeams. The exploratory phase was deemed to have occurred in the first 150 s, this is supported by the data. The tracking software (Activity monitor version 4, Med-Associates) recorded the mouse location in the open field region.
Elevated plus maze
This was conducted essentially as per (54). The apparatus consists of two closed arms (50 × 10 × 40 cm) with high walls and two open arms (50 × 10 × 5 cm) with low walls. A mouse with a high level of anxiety will spend more time in the closed arms rather than venture into the ‘less safe’ open arms. The mice were placed individually in the center of the maze for a period of 5 min. A digital camera tracked the movements of the mouse with the video analyzed by Anymaze software (Stoelting, Version 4.3).
BrdU injections, immunohistochemistry and unbiased stereology used to determine adult neurogenesis
As previously described (55), in brief, BrdU (Sigma) was dissolved in 0.9% NaCl and filtered sterile at 0.2 μm. The mice received single doses of 50-mg/g body weight at a concentration of 10 mg/ml, 1 intraperitoneal injection per day for 5 consecutive days. Mice were anesthetized and used for further experiments 4 weeks after last injection. A 1:6 series of equidistant (240 μm between sections) free-floating 40-μm coronal sections was washed in 1X TBS and incubated in 2N HCl at 37°C for 30 min to denature DNA and then neutralized in 0.1-M borate buffer for 10 min at RT. After thorough washing, the sections were blocked with TBS++ (3% Donkey Serum, 0.05-M TBS, 0.5% Triton-X 100) for 30 min at RT and incubated with rat anti- BrdU (1:100, Accurate Chemical Westbury NY) and the neuronal marker anti-NeuN (1:100, Millipore) for 72 h at 4°C. After rinses with TBS and blocking in TBS++, sections were co-incubated with donkey anti-rat Alexa Fluor 488 (1:250, Molecular Probes, Carlsbad, CA, USA) and donkey anti-mouse Alexa Fluor 568 dyes (1:250, Jackson ImmunoResearch) for 3 h at RT. We captured images using an Axiovert 200M Zeiss microscope (Zeiss) equipped with the software AxioVision 4.8.3.0. Mosaics. All images were z-stacked, taken under 10X objective and these were used to determine the amount of BrdU+ cells co-labeling with NeuN. These images were also used to measure the volume of the dentate gyrus.
Stereology
Based on the total number of BrdU+ cells analyzed, the percentage of BrdU+ cells with a neuronal phenotype was calculated. To estimate the volume of the dentate gyrus, the NeuN stained area of the dentate gyrus was traced in the software AxioVision 4.8.3.0. The granule cell reference volume was determined by summing the traced granule cell areas for each section multiplied by the distance between sections sampled. The number of BrdU-labeled cells was then related to granule cell layer sectional volume and multiplied by the reference volume to estimate total number of BrdU-positive cells.
Electrophysiology
Hippocampal slices were prepared using procedures described previously (56). Briefly, the mice were euthanized by isoflurane, the brains were rapidly removed and transverse slices cut at a thickness of 350 μm. The slices were allowed to recover for at least 1 h in ACSF (120-mM NaCl, 2.5-mM KCl, 1.25-mM NaH2PO4, 26-mM NaHCO3, 1.3-mM MgSO4, 2.5-mM CaCl2, 10-mM glucose at pH 7.4) at RT prior to recording. The osmolality of the ACSF was adjusted to 290 mosm using a 5600 Vapor Pressure Osmometer (Wescor, Inc.). All recordings were performed at 30–32°C. Data were collected using a MultiClamp 700B amplifier (Molecular Devices). Signals were filtered at 2 kHz and digitized at 10 kHz with a Digidata 1440A Data Acquisition System, and analyzed using pCLAMP 10 software (Molecular Devices). Data are presented as the mean ± standard error. Statistical significance was assessed via an unpaired two-tailed Student's t-test or a one-way ANOVA for multiple comparisons with Tukey–Kramer post-hoc analysis.
Metabolic studies
A comprehensive animal metabolic monitoring system (CLAMS; Columbus Instruments) was used to evaluate the general metabolic status. On the test day, all animals were allowed to habituate to the testing environment for 30 min in their home cages. Additionally, once placed in the metabolic chambers, animals were given 2 h prior to formal data collection to acclimatize to the metabolic chamber environment. The Respiratory Exchange Ratio (RER) is the ratio of VCO2 to VO2. VO2 and VCO2 represent the volume of O2 consumption and the volume of CO2 production, respectively. Activity was measured on the x and z axes by using infrared beams to count the beam breaks at consecutive intervals during a specified measurement period (48 h). Feeding is measured by recording the difference in the scale measurement of the center feeder from one time point to another. The accumulated drink volume is measured by a volumetric drinking monitor that detects when the subject licks a specially designed sipper tube and delivers a measured volume of liquid to the subject.
Statistics
Comparison between two groups was analyzed by non-parametrical Student's t-test with Welch's correction. One-way ANOVA with Tukey's multiple comparison testing was used to calculate statistical significance among multiple groups. Prism analysis software (PRISM 6, Graphpad, La Jolla, CA, USA) was used throughout, full statistical output available.
Declaration of ethical approval of experiments
All animal protocols were approved by the Animal Care and Use Committee (361-LMG-2014), of the National Institute of Aging.
RESULTS
Reduction in DNA polymerase β leads to increased levels of DNA strand breaks and elevated apoptosis in 3xTgAD mice
We compared four lines of mice to assess the onset and progression of neurodegeneration: WT, Polβ+/− (Polβ from here on), 3xTgAD/Polβ+/+ (3xTgAD) and 3xTgAD/Polβ+/− (3xTg/Polβ). We performed experiments on only female young adult (6 months), middle age (14 months) and old (24 months) mice (Figure 1A) using litter mates throughout. The decision to use only female mice in this study was based on the sexual dimorphism of AD (more common in females) and also the stronger AD like phenotype previously reported in the 3xTgAD strain (57).
Figure 1.
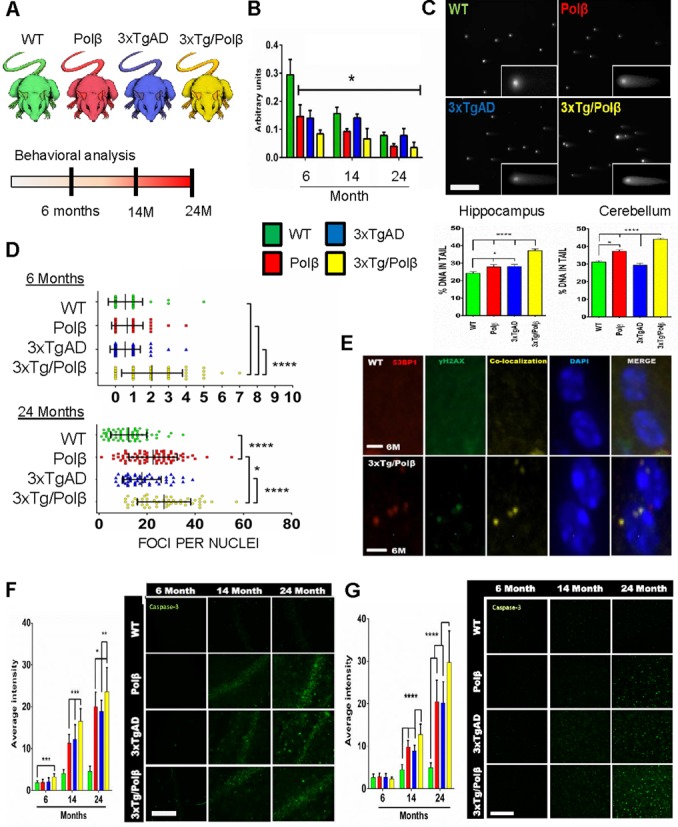
DNA polymerase β decline causes increased susceptibility to DNA damage in the mouse brain. (A) Diagrammatic representation of study. Mice utilized; Wild type (WT), Polymerase β heterozygous (Polβ), Alzheimer's (AD) transgenic (3xTgAD) and the 3xTgAD/Polβ cross (3xTg/Polβ). Comprehensive behavioral analysis was conducted at 6, 14 and 24 months. (B) Cortex Polβ protein levels in the four mouse lines at the indicated ages. All groups had significantly lower protein levels compared to 6-month WT mice, n = 3, *P < 0.05. Refer to Supplementary Figure S1A for additional information and full images. (C) Neutral comet analysis of designated mouse brain regions shows more DNA strand breaks in 3xTg/Polβ mice at 24 months of age. ****P < 0.001, scale bar = 300 μm. (D) Quantitation of double-stranded break (DSB) foci per cell by γH2AX staining shows increases in only the 3xTg/Polβ mice at 6 months, while all transgenic groups have elevated foci levels at 24 months compared to WT (n = 3 for each set, greater than 50 cells counted per set). Error bars represent mean ± SD. (E) Co-localization between antibodies targeting 53BP1 and γH2AX confirms that these foci mark DNA DSBs. Six month (M) old WT and 3xTgAD/Polβ mice are shown as a representative image. Scale bar = 5 μm. (F) Levels of cleaved caspase-3 in the hippocampus correspond to age, disease and repair deficiency. **P < 0.01, ***P < 0.005, n = 3, multiple sequential sections per animal. Scale bar = 200 μm. (G) Levels of cleaved caspase-3 in the cortex confirm global increase in apoptotic activation in transgenic mice after 14 months, n = 3, multiple sections per animal, scale bar = 200 μm. Error bars represent mean ± standard error of mean (SEM), in all panels and figures unless otherwise specified.
DNA Polβ protein levels decline during aging (58,59), this is despite elevated levels of oxidative stress and associated DNA damage. Indeed, we found reduced Polβ levels in the cerebral cortex when comparing 6- and 24-month-old animals of all four groups (Figure 1B and Supplementary Figure S1A–F). As expected, Polβ levels were lower in both the 6-month-old Polβ and 3xTg/Polβ mice compared to WT mice. Similar results were seen in hippocampal and cerebellar extracts. We asked whether the reduction of Polβ was evidence of a general decrease in all BER genes during AD by performing microarray analysis on RNA prepared from the frontal cortex of the four mouse strains (GEO accession: GSE60911). We reviewed 20 genes related to the repair of oxidative damage (Supplementary Figure S1G) and found that only Polβ expression was substantially reduced in 20-month transgenic mice (Polβ mice z-score = −4, 3xTgAD mice z-score = −2.6, 3xTg/Polβ z-score = −3.5), consistent with our previous AD patient protein results (19). We next examined the functional relevance of the Polβ decline in BER activity assays. It has been previously established that the Polβ heterozygote mice have lower levels of DNA repair in the brain (48). We used these and other previously characterized in vitro DNA repair substrates (60,61) (Supplementary Figure S1H) and found that, as expected, nucleotide incorporation was also lower in 3xTg/Polβ compared to 3xTgAD hippocampal samples. This is consistent with Polβ protein levels predicting BER capacity in vitro (39,62).
We next determined if the in vitro BER results correlated with in vivo DNA damage accumulation by measuring DNA strand breaks in brain tissue at 24 months using the neutral comet assay (Figure 1C). Higher levels of DNA damage in the hippocampus of 3xTg/Polβ mice compared to all other groups were observed; this trend was also observed in the cerebellum. In addition, we measured the amount of DNA DSBs present in cortical tissue by quantifying γH2AX foci (Figure 1D). At 6 months, we observed a significant increase in DSB foci in only the 3xTg/Polβ group relative to the other three mouse lines. By 24 months, all groups had a significant elevation in DSB foci. Compared with the results from 6-month-old mice, the 24 month results are consistent with an accumulation of DNA damage with age (Figure 1D, lower). The 3xTg/Polβ mice also had significantly higher levels of DSB foci than all other mice at 24 months. Recently, it was suggested that the DSB marker γH2AX plays a role in functions other than DSB repair (63). To confirm that the γH2AX foci were indeed associated with DSB foci, we examined a second commonly used marker, 53BP1 (Figure 1E). The γH2AX foci did co-localize with 53BP1, indicating that γH2AX foci formation provides an accurate representation of DSB levels in the mouse brain.
We next measured whether the accumulation of DNA damage particularly in the 3xTg/Polβ mouse could elicit an early apoptotic response. At 6 months, only the 3xTg/Polβ animals had elevated levels of cleaved caspase-3, a marker for a DNA damage-mediated apoptotic response, in the hippocampus (Figure 1F). The cleaved caspase-3 immunoreactivity was not exclusively nuclear suggesting that the response observed maybe indicative of early synaptic dysfunction (64) as well as apoptosis (65). All Polβ, 3xTgAD and 3xTg/Polβ mice aged 14 and 24 months displayed a significant elevation in cleaved caspase-3 compared to WT in both hippocampus and cortex (Figure 1G), correlating with the accumulation of DSBs in these tissues. Further, at both 14 and 24 months, the 3xTg/Polβ mice had significantly higher levels of cleaved caspase-3 compared to 3xTgAD and Polβ mice, indicating that the 3xTg/Polβ mouse has elevated DNA damage and early caspase-3 activation.
DNA repair deficiency leads to intracellular amyloid retention associated with impaired autophagy
One of the hallmark features found in human AD is the accumulation of Aβ fragments inside neurons and in extracellular deposits. The Aβ deposition can exacerbate DSBs associated with normal physiological brain activity and can trigger neuronal apoptosis (66–68). We investigated whether there was a correlation between amyloid deposition and the high levels of apoptosis and DSBs in the 3xTg/Polβ deficient mice. At 6 months, Aβ fragments were prevalent in both transgenic groups (3xTgAD and 3xTg/Polβ only), with the majority of staining occurring intracellular (Figure 2A). In this investigation, we did not attempt to distinguish cell type, although we can report that the morphology of the stained cells is neuron like. Moreover, the cortex tissue from the 3xTg/Polβ mice showed significantly higher levels of co-localization between apoptotic marker cleaved caspase-3 and Aβ fragments than observed in the 3xTgAD mouse cortex. WT and Polβ samples do not carry the human APP transgene so neither showed any immunoreactivity to the human-specific Aβ antibody employed by this analysis. These data suggest that Aβ accumulation and Polβ deficiency can both trigger an apoptotic response, this response being the strongest in the 3xTg/Polβ mice. There were no differences in the levels of APP or Tau in 3xTgAD and 3xTg/ Polβ mice, indicating that the elevated apoptotic response was not due to changes in APP/Tau expression (Supplementary Figure S2A and B). Indeed, tau pathology was not altered by BER status in all experiments undertaken, including measurement of phosphorylation levels and protein aggregation in tissue (Supplementary Figure S2B, not shown). In addition, the levels of two common Aβ fragments, human Aβ40 and Aβ42, were measured by ELISA and were not significantly different in 3xTgAD and 3xTg/Polβ mice (Figure 2B). Again, WT and Polβ samples did not show any reactivity to the human Aβ ELISA. These findings suggest that a genetic-dependent or age-related decrease in Polβ in conjunction with Aβ deposition results in a synergistic increase in DSBs and elevated levels of apoptosis.
Figure 2.
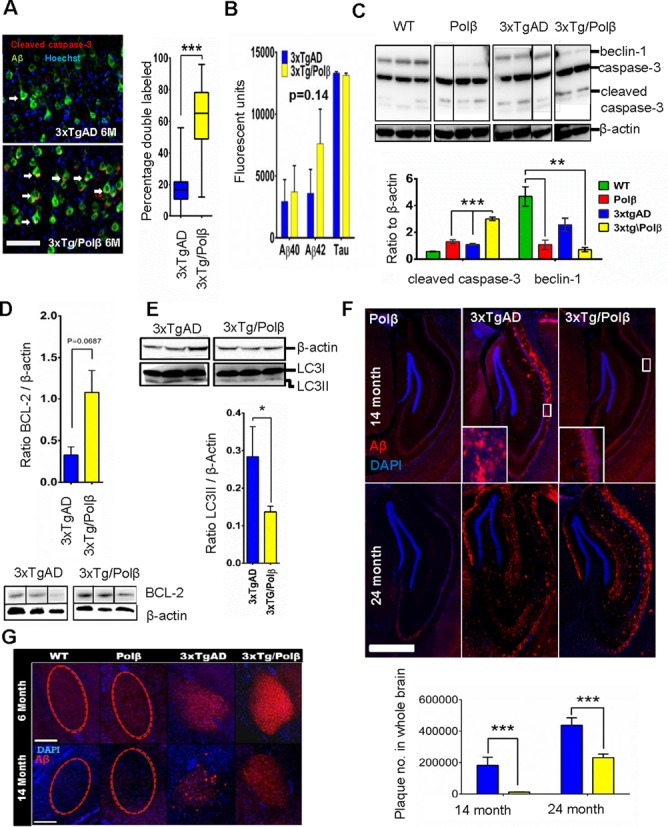
DNA Repair deficiency modulates Aβ deposition. (A) Cleaved caspase-3 immunoreactivity co-localized with amyloid signal in 6-month cortex samples at a higher frequency in repair deficient mice. n = 4 per set, 50 cells per mouse, scale bar = 50 μm. (Right) Y-axis represents the percentage of Aβ positive cells that also had distinct cleaved caspase-3 co-localization. Box plot shows mean ± SD. Arrows indicate cells with dual antibody co-localization. *** P< 0.005 (B) Levels of AD hallmark peptides Aβ40, Aβ42 and tau were not significantly altered with repair deficiency (also see Supplementary Figure S2A and B) in 14-month hippocampal extracts (n = 4). Arbitrary units are a measure of ELISA fluorescent output. (C) Autophagy protein beclin-1 is heavily reduced in 14-month repair deficient mice. Levels of the full length and cleaved caspase-3 are also altered in all transgenic groups. Graph of cleaved caspase shows that 3xTg/Polβ animals have higher levels of the apoptotic marker than parental lines compared to β-actin housekeeping protein (n = 4). ** P< 0.01 (D) The 14-month 3xTg/Polβ mice had higher ratio of anti-autophagic protein BCL-2 (n = 3). (E) There was lowerLC3II/ β-Actin ratio in the 14-month 3xTg/Polβ animals (n = 4), western insert shows LC3II levels higher in 3xtgAD animals (LC3I overexposed, refer to Supplementary Figure S2C for additional images). All bands shown were run on the same gel but are not contiguous. (F) The 3xTg/Polβ animals have slowed extracellular Aβ deposition in the hippocampal region with no extracellular plaques present at 14 months. Instead the mice display visible intracellular Aβ deposition, scale bar = 1.5 mm, image is representative of n = 4. (Insert) Extracellular Aβ plaques in 14-month 3xTgAD mice and intracellular deposition of Aβ in 3xTg/Polβ mice. WT (not shown) and Polβ animals did not have Aβ deposition. At 24 months both 3xTgAD and 3xTg/Polβ had extensive plaques formation not observed in the non-3xTg groups. (Bottom) Quantitation of extracellular plaque number through the brain in 14- and 24-month animals, n = 3, full description in materials and methods. (G) As observed in the hippocampus, amyloid deposition in the amygdala shifts from intracellular to predominantly extracellular in the 3xTgAD mice at 14 months but not in the 3xTg/Polβ group, scale bar = 200 μm, images are representative, n = 4.
The activation of a DNA damage-related apoptotic response can lead to cell death, but sub-lethal levels of apoptotic response can also be a potent inhibitor of autophagy (69). A defect in autophagy in a transgenic AD mouse model has been shown to exacerbate AD-related intracellular Aβ (70). We investigated whether the early caspase-3 activation in the 3xTg/Polβ mice was associated with reduced autophagy-related proteins (Figure 2C). Consistent with reports in AD patients (71), we found a significant decrease in the key autophagic protein beclin-1 in the 3xTgAD mouse at 14 months. Notably, this decrease was significantly greater in mice with a DNA repair deficiency (Polβ and 3xTg/Polβ). Thus, Polβ deficiency alone can be enough to inhibit autophagy. Indeed, we also observed higher levels of autophagic inhibitor BCL-2 (Figure 2D) in the 3xTg/Polβ. There was also significantly more autophagic precursor protein LC3I (Supplementary Figure S2C), but lower levels of autophagic activator LC3II (Figure 2E) in the 14 month, 3xTg/Polβ mice, relative to 3xTgAD mice.
The knockout of the autophagy-related protein 7 (Atg7) was recently shown to inhibit Aβ plaque formation in an AD mouse model (70). We investigated whether the reduced expression of autophagic proteins in the 3xTg/Polβ mice would affect Aβ accumulation. The Polβ mouse, with non-3xTg background, is shown as a negative control (Figure 2F) with only background immunoreactivity to the human Aβ antibody (as also seen in WT samples). At 14 and 24 months, the 3xTg mice had extensive extracellular plaques in the hippocampus. In contrast, at 14 months, the 3xTg/Polβ mice only had intracellular Aβ aggregation with few plaques. By 24 months the 3xTg/Polβ mice also presented with extensive extracellular plaques, and the plaque distribution resembled the 14-month 3xTgAD group, suggesting an intact yet suppressed mechanism of extracellular amyloid deposition in the 3xTg/Polβ mice. Quantification of extracellular Aβ plaque frequency (below 2F images) in 3xTgAD and 3xTg/PolB mice revealed differences in plaque accumulation (Figure 2F, bottom). Higher magnification images of the hippocampal amyloid deposition are presented in Supplementary Figure S2G. Plaque burden was also assessed in the amygdala, another AD-associated-brain region (72,73) (Figure 2G). Aβ deposition paralleled the pattern reported in the hippocampus and was associated with early behavioral changes (Supplementary Figure S2D–F). Higher magnification images of amygdala amyloid deposition are presented in Supplementary Figure S2H. These data demonstrate that a reduction of Polβ in an AD mouse correlates with alterations in the distribution of amyloid plaques and reduced expression of proteins associated with autophagy.
Hippocampal degeneration after a reduction in DNA repair
In human AD, cell death results in severe atrophy of the hippocampus and regions of the cerebral cortex. However, neuronal death is absent or limited in most AD transgenic mouse models including the 3xTgAD. We asked whether the enhanced intracellular Aβ deposition, elevated DNA damage and apoptotic response in the 3xTg/Polβ mouse would result in hippocampal neuron loss. A neuronal marker, NeuN (neuronal nuclei), was used to measure absolute hippocampal volume (Figure 3A and B and Supplementary Figure S3A). No change in volume was observed in any of the transgenic mice at 6 months, confirming that early neural development was unaffected. In contrast, a reduction in hippocampal volume was evident at 14 months in all our transgenic mice compared to WT, but was significant only in the 3xTg/Polβ mice. Because the hippocampus contains neural stem cells, the extensive loss of hippocampal volume in the 3xTg/Polβ mice could be explained by increased cell death and/or reduced neurogenesis. A DNA repair compromised animal model has been reported to have reduced levels of adult neurogenesis (74), a phenotype that has also been observed in AD mouse models (75,76). We asked whether the reduced hippocampal volume measured in the 3xTg/Polβ mice was due to a decline in adult neurogenesis. At six months, neurogenesis was similar in all mice investigated; however, a decrease in adult neurogenesis was seen at 14 months in all transgenic groups compared to WT, but with no additional reduction in the 3xTg/Polβ group (Figure 3C). Hence, the 3xTg/Polβ mice have an age-related decline in adult neurogenesis that is similar to 3xTg mice and therefore not responsible for the greater hippocampal atrophy of 3xTg/Polβ mice compared to 3xTg mice.
Figure 3.
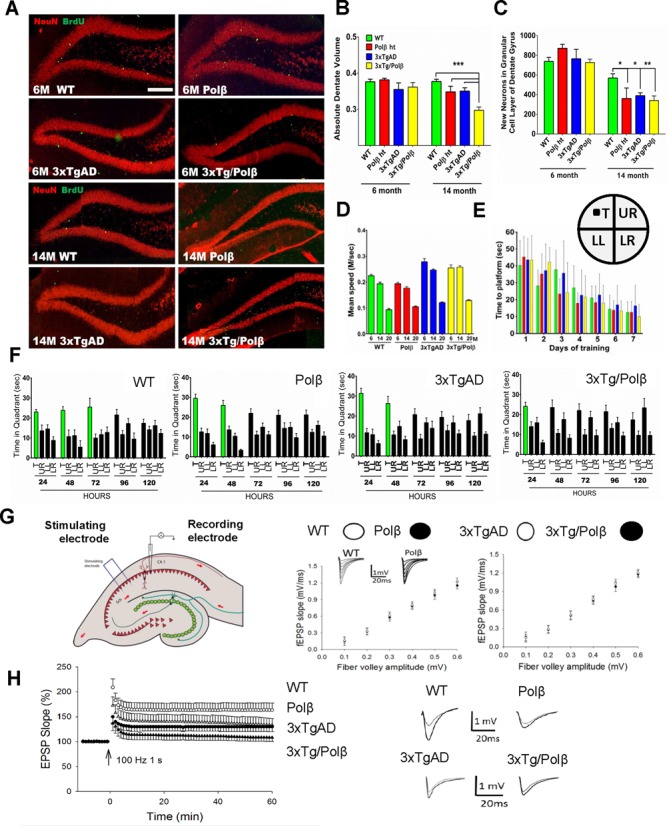
DNA repair deficiency drives AD-related hippocampal degeneration. (A) The dentate gyrus shows no difference in volume or BrdU incorporation (neurogenesis) at 6 months, but after 14 months a significant decrease in neurogenesis and dentate volume is observed in all groups compared to WT. Scale bar = 400 μm (n = 4). (B) Dentate gyrus volume measured as a proportion of total brain volume shows a synergistic decrease in the 3xTg/Polβ group at 14 months compared to all groups (n = 4). (C) The level of neurogenesis in the dentate gyrus is not significantly affected at 6 months though BrdU incorporation is heavily reduced in all groups after 14 month compared to WT (n = 4).* P< 0.05, ** P< 0.01, *** P< 0.005 (D) We used the Morris water maze (MWM) to measure hippocampal dependent memory loss. Water maze swim speed was higher in 3xTg groups at 6 and 14 months but was comparative at 20 months (n = 8–14). (E) There was no difference in learning in any of the groups in the MWM (see also Supplementary Figure S3B) (insert) diagrammatic representation of water maze showing platform location. Quadrant abbreviations: T = target quadrant, UR = upper right quadrant, LL = lower left, LR = lower right. (F) Memory retention was affected at 20 months in all groups compared to WT, notably the most affected was the 3xTg/Polβ group. Green bars represent days of significant memory retention. Significance was determined using quadrant comparison with Bonferroni post hoc analysis. (G) Long-term potentiation (LTP) measured at the Schaffer collateral synapses (n = 8, 4 pairs). There was no difference in pre-synaptic transmissions. (H) Post synaptic defect was detected with significant differences between all groups compared to WT. The 3xTg/Polβ mice had a synergistic decrease in LTP, relative to 3xTg and Polβ.
Hippocampal atrophy is closely linked to cognitive dysfunction in human AD patients (77). We tested spatial learning and memory retention using the MWM. This test uses a pool with opaque water in which the mice were trained to find a submerged platform. We then removed the platform and asked whether the mice could recall the former location of the platform. Mice in all four groups were able to find a visible (non-submerged) platform with similar latency (78). The 3xTgAD and 3xTg/Polβ mice exhibited a faster average swim speed (Figure 3D). All groups were able to learn the location of a submerged platform with comparable latencies (Figure 3E and Supplementary Figure S3B). While there was no difference in spatial learning, memory retention was impaired in all three groups of transgenic mice at 14 and 20 months compared to WT mice (Figure 3F and Supplementary Figure S3C). Memory retention was particularly affected in the 3xTg/Polβ mice. Comparing the directness of the path to the platform at the 20 month time point also revealed that the 3xTg/Polβ group had reduced memory retention compared to 3xTgAD mice that was significant at 72 h post-training (Supplementary Figure S3D).
We considered whether the reduction in memory retention was influenced by a loss of synaptic plasticity. We measured long term potentiation (LTP), a key cellular change involved in learning and memory in 20-month old mice. Initially, field excitatory postsynaptic potentials (fEPAPs) were recorded during and after stimulation of the presynaptic Shaffer collateral pathway in hippocampal slices from the four groups of mice, with no significant differences seen (Figure 3G and Supplementary Figure S3E and F). Paired pulse facilitation was also recorded to detect changes in neurotransmitter release, and again, no differences were observed among all four mouse lines. These findings suggest that BER deficiency does not modulate basal transmission at the CA1 synapses of the hippocampus. fEPAPs were then recorded in CA1 stratum radiatum (Figure 3H and Supplementary Figure S3G). LTP was significantly impaired in Polβ, 3xTg and 3xTg/Polβ mice, with the severest deficit in LTP occurring in the 3xTg/Polβ mice (Figure 3H). Thus, a BER deficiency exacerbates an AD-related deficit in hippocampal synaptic plasticity.
The new AD mouse model has severe energetic dysfunction
The 3xTg/Polβ mouse has more severe AD phenotypes than either Polβ or 3xTgAD mice. We performed microarray analysis on the frontal cortex of 20-month-old mice to elucidate potential causative genes and pathways. Principle components analysis of significant genes showed that the mice segregated according to genotype (Supplementary Figure S4A). Pathway comparison showed that the 3xTg/Polβ mice had a different pathway profile than either 3xTgAD or Polβ animals (Supplementary Figure S4B). We used Kyoto encyclopedia of genes and genomes (KEGG) pathway analysis to identify which of the mouse groups had the most similarities with patients that had neurodegenerative diseases. In Figure 4A, we show that the 3xTg/Polβ mouse has striking similarities when compared to both AD and, interestingly, also to Parkinson's and Huntington's diseases, using both pathway z-score and P-value statistics. Indeed, there is research suggesting that BER dysregulation is a component in the progression of these diseases (79–82).
Figure 4.
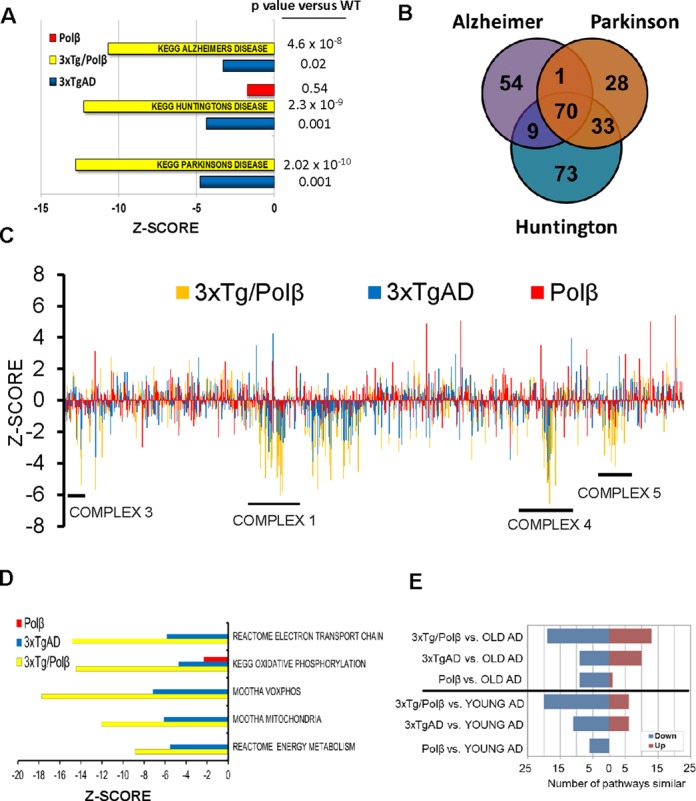
The 3xTg/Polβ mouse has severe energetic dysfunction and has more pathways similar to human AD patients than the 3xTgAD or Polβ mice alone. (A) KEGG pathway analysis showed that 3xTg/Polβ array had a more significantly changed pathway z-scores and P values when compared to three common neurodegenerative diseases than parental lines. (B) Venn diagram of genes most commonly deregulated in the three KEGG disease pathways shows that 70 genes are in common, 68 of these are involved in mitochondrial bioenergetics, 2 in apoptotic response. (C) Gene expression changes of 1500 mitochondrial-related genes (each strain relative to WT). Results show genes associated with energy complex formation are particularly affected in 3xTgAD and synergistically downregulated in 3xTg/Polβ. Genes particularly affected in the 3xTg/Polβ animals correspond to complexes (as numbered on diagram) 1, 3, 4 and 5. (D) Microarray data confirm that many pathways associated with energy metabolism are significantly deregulated in the 3xTg/Polβ mouse; also see S4D for P value analysis. (E) We compared the mouse gene expression results to a large human AD prefrontal cortex microarray data set (Zhang et al. (87)) (GSE44770). OLD AD refers to late onset AD patients, YOUNG AD refers to patients with mild cognitive impairment, an AD precursor disease.
We next asked whether there were common gene components for the three common human neurodegenerative diseases: Alzheimer's, Parkinson's and Huntington's and found 70 genes (Figure 4B). Out of 70 genes, 68 were involved in mitochondrial energy complexes, suggesting that the BER deficiency in the 3xTg/Polβ mice may induce or exacerbate mitochondrial dysfunction. In Figure 4C, we plotted the expression levels of 1500 mitochondrial related genes (GO0005739, Mitochondrion). There was not a general decrease in mitochondria-related genes, but rather distinct regions of downregulation corresponding to the mitochondrial energy complexes, particularly complexes 1, 3, 4 and 5. The 3xTgAD mice also had a decrease in gene expression related to mitochondrial energy metabolism, consistent with previous observations (83–86). In the 3xTg/Polβ mice, most of the same genes displayed a synergistic reduction (Supplementary Figure S4C), supporting the notion that mice with compromised DNA repair and Aβ pathology have severe metabolic defects in neural tissue. Further, numerous pathway sets associated with oxidative phosphorylation and mitochondria were heavily decreased in the 3xTg/Polβ microarray data set (Figure 4D), P-value analysis (Supplementary Figure S4D). To assess whether these metabolic changes could be detected at the organism level, we used metabolic cages measuring various respiratory parameters (Supplementary Figure S4E and F). All transgenic animals had changes in reserve respiratory capacity (RER) compared to WT. In all cases the transgenic mice had a change in metabolism indicative of a shift away from respiration to carbohydrate metabolism.
To determine whether molecular alterations in the brains of 3xTg/Polβ mice resemble human AD, we compared our mouse prefrontal cortex microarray data set with a large human array data set obtained from analysis of the prefrontal cortex of 377 late on-set AD patients, 119 MCI patients and 359 controls (87) (GSE44770). In this comparison the 3xTg/Polβ mice had more pathways change in a similar direction (up or down) to the human patients with MCI and late-onset AD (Figure 4E) than the 3xTgAD or Polβ mice. Of note, the Polβ mice did have some pathway similarities with the late on-set AD particularly in downregulated pathways (Figure 4E). However, the downregulated pathways were not the same as the affected pathways in the 3xTg mice (Supplementary Figure S4G). Indeed, the pathway comparison analysis suggests that the 3xTg/Polβ mouse is more similar to human AD because of the combination of pathways downregulated in the 3xTgAD and Polβ mice separately. We compared the z-score of each of the pathways in Supplementary Figure S4H and did an overall comparison of these pathways between the mouse and human groups. When compared to human AD patients only the 3xTg/Polβ mouse was not significantly different. Further, the two parental lines were significantly different to the 3xTg/Polβ in this analysis. These data suggest that the 3xTg/Polβ mice are markedly different from parental strain and have a stronger similarity to human AD patients. We assessed a second human microarray comparison on AD patient peripheral fibroblasts (88). Again, 3xTg/Polβ mice had more pathways similar to the human patients than did the 3xTgAD or Polβ mice (Supplementary Figure S4).
DISCUSSION
We generated and characterized at the molecular, cellular and behavioral levels, 3xTgAD mice with a 50% reduction in Polβ expression. We found that Polβ haploinsufficiency exacerbated deficits in memory retention and hippocampal synaptic plasticity in 3xTgAD mice. More importantly, reduced DNA repair was sufficient to trigger neuronal death and hippocampal atrophy that did not otherwise occur in 3xTgAD mice. Moreover, the neuronal degeneration in 3xTg/Polβ mice is associated with impaired autophagy, accumulation of amyloid plaques and a brain transcriptome profile remarkably similar to that of human AD patients. We did not attempt life-span studies on the 3xTg/Polβ mice but can report equal numbers of mice to litter mates at 24 months consistent with published data reporting that Polβ heterozygosity does not influence longevity (89). Our findings provide evidence that the reduction in levels of Polβ in normal brain aging and AD can render neurons more vulnerable to dysfunction and death.
There is substantial evidence that within the human population BER protein levels vary considerably (reviewed (90)). In addition, patients with Down syndrome, who always develop AD-like neuropathology and cognitive deficits, exhibit reduced levels of Polβ (91). DNA damage has a central role in aging (92), and our findings suggest that it may contribute to the appearance of more severe AD pathogenesis. Previous studies showed that patients with MCI and AD have a significant decrease in BER, with Polβ levels correlating with Braak stage (19,93,94). Indeed, AD patients accumulate oxidative DNA lesions, which are primary substrates of the BER pathway in the brain (93–95). We found that a reduction in Polβ levels exacerbates AD-like cognitive and synaptic deficits in 3xTgAD mice.
The notion that DNA damage plays a role in AD pathology is supported by recent evidence that physiological brain activity induces DNA strand breaks that are further aggravated by Aβ (66). The presented data provide a putative mechanism linking oxidative endogenous DNA damage, age-related reduction in DNA repair and DSB formation. We found that Polβ levels decline in the mouse brain during normal aging and that a further reduction caused by Polβ haploinsufficiency is sufficient to trigger age-related accumulation of DNA DSBs and neuronal apoptosis. In contrast to 3xTgAD mice, 3xTg/Polβ mice exhibit more extensive neuronal damage and loss in the hippocampus. Our results are corroborated by the recent findings that other AD mouse models have higher levels of activated caspase-3 in the hippocampus (64). Notably, these authors found that caspase-3 triggered synaptic dysfunction (but not cell death) and pharmacological inhibition of caspase activity rescued cognitive dysfunction. We found that the damage to neurons exacerbated by a reduction of Polβ levels in 3xTgAD mice correlated with a reduction in autophagy markers. Previous findings suggest that autophagy is impaired in neurons in AD (96), which may, in turn, contribute to intracellular accumulation and neurotoxicity of Aβ (70,97). Reduced DNA repair in the AD mouse caused an increase in the apoptotic response while decreasing many autophagic components. The increased apoptotic response correlated with a reduction of extracellular plaque formation, and an exacerbation of behavioral and synaptic deficits, possibly by increasing accumulation of Aβ within neurons. Indeed, it was recently reported that knockout of the autophagy protein atg7 results in intracellular Aβ accumulation and worse cognitive function in APP mutant mice (70). The Aβ-related phenotypes of the APP/atg7 mice and our 3xTg/Polβ mice support accumulating evidence that extracellular Aβ plaques may not be a critical factor in cognitive impairment in AD. Indeed, many subjects with extensive Aβ plaques are cognitively normal (98), and some interventions that ameliorate cognitive deficits in 3xTgAD mice do not decrease (99), but actually increase (100) Aβ plaque levels.
The notion that AD symptoms are not directly linked to Aβ extracellular plaque formation in the mouse is supported by a major finding of the present study, namely, that reduced BER can promote AD-like phenotypes. In addition, the Polβ and 3xTgAD animals performed comparatively throughout the study. While not directly tested in the presented research, there was no overt difference in life span between the transgenic groups (89). We propose that the similarity between these two groups stems from both having similar steady state levels of DNA damage. This in turn induced near identical levels of apoptotic activation, hippocampal degeneration, memory dysfunction and synaptic plasticity. Of note, a mouse defective in another DNA repair pathway, nucleotide excision repair, also presents with similar age related neurodegenerative pathology as the repair deficient Polβ mice investigated in this study (101). Together, the two studies strongly suggest a causal relationship between increased DNA damage and age-dependent cognitive decline. Interestingly, the Polβ mouse has a high level of energy demand consistent with recent findings reporting that persistent DNA damage can increase energy consumption (102). Despite this, only when the mouse is crossed with the 3xTgAD animal does the 3xTg/Polβ mouse show a decline in oxidative phosphorylation. We believe that the rapid decline of metabolic pathways caused by the increased DNA damage-associated energy burden is the key attribute that distinguishes the 3xTg/Polβ mice from the 3xTgAD animals. In support, we have recently shown that the cognitive decline in the 3xTgAD mouse can be stalled by improving neuronal bioenergetics using the precursor nicotinamide (83).
Considerable evidence suggests that mitochondrial dysfunction and a deficit in cellular energy substrates occurs in vulnerable neurons in AD early in the disease process (103,104). Our bioinformatics analysis of the transcriptomes of frontal cortical cells in brain tissue samples of 3xTgAD mice with or without reduced Polβ levels, and human AD and control subjects, revealed similarities in the gene networks altered in AD and in Polβ-deficient AD mice. Of particular note was the downregulation of numerous genes encoding proteins in the mitochondrial electron transport chain in the 3xTg/Polβ mice and AD patients, compared to age-matched Polβ, 3xTgAD and WT mice, and neurologically normal human subjects. These findings suggest that Polβ deficiency and Aβ accumulation may compromise the ability of the neurons to support synaptic activity to survive. Consistent with this neuro-protective role of Polβ, both BER deficiency (21,105,106) and Aβ (107) are known to render neurons vulnerable to reductions in cellular energy levels.
Collectively, the findings advance our understanding of the age-related molecular and cellular changes that can render neurons vulnerable to AD and age-associated dysfunction and degeneration, and suggest novel approaches for preventing or delaying the onset of cognitive impairment and AD. These results suggest that interventions that sustain or elevate Polβ or DNA repair levels may protect neurons against dysfunction and degeneration in aging and AD. Recent findings are consistent with this possibility. For example, exercise upregulates the expression of the BER enzyme AP endonuclease 1 in the hippocampus and cerebral cortex of mice by a mechanism that may involve brain-derived neurotrophic factor and the transcription factor cyclic AMP response element-binding protein (108) Regular exercise can reduce the risk of AD (109), thus bolstering DNA repair may be beneficial. Signaling pathways that induce expression of Polβ in neurons are unknown, and elucidation of such pathways may provide insight into novel approaches for preventing the accumulation of oxidative DNA lesions in neurons in AD.
SUPPLEMENTARY DATA
Supplementary Data are available at NAR Online.
Acknowledgments
We thank Dr M. Scheibye-Knudsen and Dr E. Eitan for the critical reading of this manuscript; Mr J. Burril for graphics support; and Ms R. Vergara-Greeno and Dr H. Van Praag (LNS, NIA, NIH) for technical support.
FUNDING
Intramural Research Program of the National Institutes of Health (NIH), National Institute on Aging [Z01-AG00735]; Fundacao de Amparo a Pesquisa do Estado de Sao Paulo-FAPESP [2013/11052-1 to G.L.]. Funding for open access charge: NIH Intramural Program.
Conflict of interest statement. None declared.
REFERENCES
- 1.Cummings J.L., Morstorf T., Zhong K. Alzheimer's disease drug-development pipeline: few candidates, frequent failures. Alzheimers Res. Ther. 2014;6:37–44. doi: 10.1186/alzrt269. [DOI] [PMC free article] [PubMed] [Google Scholar]
- 2.Bradley-Whitman M.A., Timmons M.D., Beckett T.L., Murphy M.P., Lynn B.C., Lovell M.A. Nucleic acid oxidation: an early feature of Alzheimer's disease. J. Neurochem. 2014;128:294–304. doi: 10.1111/jnc.12444. [DOI] [PMC free article] [PubMed] [Google Scholar]
- 3.Bradley M.A., Xiong-Fister S., Markesbery W.R., Lovell M.A. Elevated 4-hydroxyhexenal in Alzheimer's disease (AD) progression. Neurobiol. Aging. 2012;33:1034–1044. doi: 10.1016/j.neurobiolaging.2010.08.016. [DOI] [PMC free article] [PubMed] [Google Scholar]
- 4.Bradley M.A., Markesbery W.R., Lovell M.A. Increased levels of 4-hydroxynonenal and acrolein in the brain in preclinical Alzheimer disease. Free Radic. Biol. Med. 2010;48:1570–1576. doi: 10.1016/j.freeradbiomed.2010.02.016. [DOI] [PMC free article] [PubMed] [Google Scholar]
- 5.Gabbita S.P., Lovell M.A., Markesbery W.R. Increased nuclear DNA oxidation in the brain in Alzheimer's disease. J. Neurochem. 1998;71:2034–2040. doi: 10.1046/j.1471-4159.1998.71052034.x. [DOI] [PubMed] [Google Scholar]
- 6.Lovell M.A., Gabbita S.P., Markesbery W.R. Increased DNA oxidation and decreased levels of repair products in Alzheimer's disease ventricular CSF. J. Neurochem. 1999;72:771–776. doi: 10.1046/j.1471-4159.1999.0720771.x. [DOI] [PubMed] [Google Scholar]
- 7.Lovell M.A., Markesbery W.R. Oxidative damage in mild cognitive impairment and early Alzheimer's disease. J. Neurosci. Res. 2007;85:3036–3040. doi: 10.1002/jnr.21346. [DOI] [PubMed] [Google Scholar]
- 8.Lovell M.A., Markesbery W.R. Oxidative DNA damage in mild cognitive impairment and late-stage Alzheimer's disease. Nucleic Acids Res. 2007;35:7497–7504. doi: 10.1093/nar/gkm821. [DOI] [PMC free article] [PubMed] [Google Scholar]
- 9.Lovell M.A., Soman S., Bradley M.A. Oxidatively modified nucleic acids in preclinical Alzheimer's disease (PCAD) brain. Mech. Ageing Dev. 2011;132:443–448. doi: 10.1016/j.mad.2011.08.003. [DOI] [PMC free article] [PubMed] [Google Scholar]
- 10.Lovell M.A., Markesbery W.R. Oxidatively modified RNA in mild cognitive impairment. Neurobiol. Dis. 2008;29:169–175. doi: 10.1016/j.nbd.2007.07.030. [DOI] [PMC free article] [PubMed] [Google Scholar]
- 11.Lovell M.A., Markesbery W.R. Ratio of 8-hydroxyguanine in intact DNA to free 8-hydroxyguanine is increased in Alzheimer disease ventricular cerebrospinal fluid. Arch. Neurol. 2001;58:392–396. doi: 10.1001/archneur.58.3.392. [DOI] [PubMed] [Google Scholar]
- 12.Mao G., Pan X., Zhu B.B., Zhang Y., Yuan F., Huang J., Lovell M.A., Lee M.P., Markesbery W.R., Li G.M., et al. Identification and characterization of OGG1 mutations in patients with Alzheimer's disease. Nucleic Acids Res. 2007;35:2759–2766. doi: 10.1093/nar/gkm189. [DOI] [PMC free article] [PubMed] [Google Scholar]
- 13.Markesbery W.R., Lovell M.A. Damage to lipids, proteins, DNA, and RNA in mild cognitive impairment. Arch. Neurol. 2007;64:954–956. doi: 10.1001/archneur.64.7.954. [DOI] [PubMed] [Google Scholar]
- 14.Markesbery W.R., Lovell M.A. DNA oxidation in Alzheimer's disease. Antioxid. Redox Signal. 2006;8:2039–2045. doi: 10.1089/ars.2006.8.2039. [DOI] [PubMed] [Google Scholar]
- 15.Shao C., Xiong S., Li G.M., Gu L., Mao G., Markesbery W.R., Lovell M.A. Altered 8-oxoguanine glycosylase in mild cognitive impairment and late-stage Alzheimer's disease brain. Free Radic. Biol. Med. 2008;45:813–819. doi: 10.1016/j.freeradbiomed.2008.06.003. [DOI] [PMC free article] [PubMed] [Google Scholar]
- 16.Wang J., Xiong S., Xie C., Markesbery W.R., Lovell M.A. Increased oxidative damage in nuclear and mitochondrial DNA in Alzheimer's disease. J. Neurochem. 2005;93:953–962. doi: 10.1111/j.1471-4159.2005.03053.x. [DOI] [PubMed] [Google Scholar]
- 17.Wang J., Markesbery W.R., Lovell M.A. Increased oxidative damage in nuclear and mitochondrial DNA in mild cognitive impairment. J. Neurochem. 2006;96:825–832. doi: 10.1111/j.1471-4159.2005.03615.x. [DOI] [PubMed] [Google Scholar]
- 18.Weidner A.M., Bradley M.A., Beckett T.L., Niedowicz D.M., Dowling A.L., Matveev S.V., LeVine H., III, Lovell M.A., Murphy M.P. RNA oxidation adducts 8-OHG and 8-OHA change with Abeta42 levels in late-stage Alzheimer's disease. PLoS One. 2011;6:e24930. doi: 10.1371/journal.pone.0024930. [DOI] [PMC free article] [PubMed] [Google Scholar]
- 19.Weissman L., Jo D.G., Sorensen M.M., de Souza-Pinto N.C., Markesbery W.R., Mattson M.P., Bohr V.A. Defective DNA base excision repair in brain from individuals with Alzheimer's disease and amnestic mild cognitive impairment. Nucleic Acids Res. 2007;35:5545–5555. doi: 10.1093/nar/gkm605. [DOI] [PMC free article] [PubMed] [Google Scholar]
- 20.Wu M.F., Yin J.H., Hwang C.S., Tang C.M., Yang D.I. NAD attenuates oxidative DNA damages induced by amyloid beta-peptide in primary rat cortical neurons. Free Radic. Res. 2014;48:794–805. doi: 10.3109/10715762.2014.907889. [DOI] [PubMed] [Google Scholar]
- 21.Canugovi C., Shamanna R.A., Croteau D.L., Bohr V.A. Base excision DNA repair levels in mitochondrial lysates of Alzheimer's disease. Neurobiol. Aging. 2014;35:1293–1300. doi: 10.1016/j.neurobiolaging.2014.01.004. [DOI] [PMC free article] [PubMed] [Google Scholar]
- 22.Lillenes M.S., Stoen M., Gomez-Munoz M., Torp R., Gunther C.C., Nilsson L.N., Tonjum T. Transient OGG1, APE1, PARP1 and Polbeta expression in an Alzheimer's disease mouse model. Mech. Ageing Dev. 2013;134:467–477. doi: 10.1016/j.mad.2013.09.002. [DOI] [PubMed] [Google Scholar]
- 23.Bradley-Whitman M.A., Timmons M.D., Beckett T.L., Murphy M.P., Lynn B.C., Lovell M.A. Nucleic acid oxidation: an early feature of Alzheimer's disease. J. Neurochem. 2014;128:294–304. doi: 10.1111/jnc.12444. [DOI] [PMC free article] [PubMed] [Google Scholar]
- 24.Bucholtz N., Demuth I. DNA-repair in mild cognitive impairment and Alzheimer's disease. DNA Repair (Amst) 2013;12:811–816. doi: 10.1016/j.dnarep.2013.07.005. [DOI] [PubMed] [Google Scholar]
- 25.Leandro G.S., Lobo R.R., Oliveira D.V., Moriguti J.C., Sakamoto-Hojo E.T. Lymphocytes of patients with Alzheimer's disease display different DNA damage repair kinetics and expression profiles of DNA repair and stress response genes. Int. J. Mol. Sci. 2013;14:12380–12400. doi: 10.3390/ijms140612380. [DOI] [PMC free article] [PubMed] [Google Scholar]
- 26.Pinto M., Pickrell A.M., Fukui H., Moraes C.T. Mitochondrial DNA damage in a mouse model of Alzheimer's disease decreases amyloid beta plaque formation. Neurobiol. Aging. 2013;34:2399–2407. doi: 10.1016/j.neurobiolaging.2013.04.014. [DOI] [PMC free article] [PubMed] [Google Scholar]
- 27.Suberbielle E., Sanchez P.E., Kravitz A.V., Wang X., Ho K., Eilertson K., Devidze N., Kreitzer A.C., Mucke L. Physiologic brain activity causes DNA double-strand breaks in neurons, with exacerbation by amyloid-beta. Nat. Neurosci. 2013;16:613–621. doi: 10.1038/nn.3356. [DOI] [PMC free article] [PubMed] [Google Scholar]
- 28.Forestier A., Douki T., Sauvaigo S., De Rosa V., Demeilliers C., Rachidi W. Alzheimer's disease-associated neurotoxic peptide amyloid-beta impairs base excision repair in human neuroblastoma cells. Int. J. Mol. Sci. 2012;13:14766–14787. doi: 10.3390/ijms131114766. [DOI] [PMC free article] [PubMed] [Google Scholar]
- 29.Butterfield D.A., Drake J., Pocernich C., Castegna A. Evidence of oxidative damage in Alzheimer's disease brain: central role for amyloid beta-peptide. Trends Mol. Med. 2001;7:548–554. doi: 10.1016/s1471-4914(01)02173-6. [DOI] [PubMed] [Google Scholar]
- 30.Reed T.T., Pierce W.M., Markesbery W.R., Butterfield D.A. Proteomic identification of HNE-bound proteins in early Alzheimer disease: Insights into the role of lipid peroxidation in the progression of AD. Brain Res. 1274:66–76. doi: 10.1016/j.brainres.2009.04.009. [DOI] [PubMed] [Google Scholar]
- 31.Williams T.I., Lynn B.C., Markesbery W.R., Lovell M.A. Increased levels of 4-hydroxynonenal and acrolein, neurotoxic markers of lipid peroxidation, in the brain in Mild Cognitive Impairment and early Alzheimer's disease. Neurobiol. Aging. 2006;8:1094–1099. doi: 10.1016/j.neurobiolaging.2005.06.004. [DOI] [PubMed] [Google Scholar]
- 32.Butterfield D.A., Boyd-Kimball D. Amyloid Beta-peptide(1–42) contributes to the oxidative stress and neurodegeneration found in Alzheimer disease brain. Brain Pathol. (2004);4:426–432. doi: 10.1111/j.1750-3639.2004.tb00087.x. [DOI] [PMC free article] [PubMed] [Google Scholar]
- 33.Finkel T., Holbrook N.J. Oxidants, oxidative stress and the biology of ageing. Nature. 2000;408:239–247. doi: 10.1038/35041687. [DOI] [PubMed] [Google Scholar]
- 34.Lu T., Pan Y., Kao S.Y., Li C., Kohane I., Chan J., Yankner B.A. Gene regulation and DNA damage in the ageing human brain. Nature. 2004;429:883–891. doi: 10.1038/nature02661. [DOI] [PubMed] [Google Scholar]
- 35.Madabhushi R., Pan L., Tsai L.H. DNA damage and its links to neurodegeneration. Neuron. 2014;83:266–282. doi: 10.1016/j.neuron.2014.06.034. [DOI] [PMC free article] [PubMed] [Google Scholar]
- 36.Sykora P., Wilson D.M., III, Bohr V.A. Base excision repair in the mammalian brain: implication for age related neurodegeneration. Mech. Ageing Dev. 2013;134:440–448. doi: 10.1016/j.mad.2013.04.005. [DOI] [PMC free article] [PubMed] [Google Scholar]
- 37.Sugo N., Aratani Y., Nagashima Y., Kubota Y., Koyama H. Neonatal lethality with abnormal neurogenesis in mice deficient in DNA polymerase beta. EMBO J. 2000;19:1397–1404. doi: 10.1093/emboj/19.6.1397. [DOI] [PMC free article] [PubMed] [Google Scholar]
- 38.Sykora P., Yang J.L., Ferrarelli L.K., Tian J., Tadokoro T., Kulkarni A., Weissman L., Keijzers G., Wilson D.M., III, Mattson M.P., et al. Modulation of DNA base excision repair during neuronal differentiation. Neurobiol. Aging. 2013;34:1717–1727. doi: 10.1016/j.neurobiolaging.2012.12.016. [DOI] [PMC free article] [PubMed] [Google Scholar]
- 39.Wei W., Englander E.W. DNA polymerase beta-catalyzed-PCNA independent long patch base excision repair synthesis: a mechanism for repair of oxidatively damaged DNA ends in post-mitotic brain. J. Neurochem. 2008;107:734–744. doi: 10.1111/j.1471-4159.2008.05644.x. [DOI] [PMC free article] [PubMed] [Google Scholar]
- 40.Patterson D., Cabelof D.C. Down syndrome as a model of DNA polymerase beta haploinsufficiency and accelerated aging. Mech. Ageing Dev. 2012;133:133–137. doi: 10.1016/j.mad.2011.10.001. [DOI] [PubMed] [Google Scholar]
- 41.Yang Q., Rasmussen S.A., Friedman J.M. Mortality associated with Down's syndrome in the USA from 1983 to 1997: a population-based study. Lancet. 2002;359:1019–1025. doi: 10.1016/s0140-6736(02)08092-3. [DOI] [PubMed] [Google Scholar]
- 42.Mann D.M.A., Yates P.O., Marcyniuk B., Ravindra C.R. The topography of plaques and tangles in down's syndrome patients of different ages. Neuropathology and applied Neurobiology. 1986;12:447–457. doi: 10.1111/j.1365-2990.1986.tb00053.x. [DOI] [PubMed] [Google Scholar]
- 43.Wisniewski K.E., Dalton A.J., McLachlan C., Wen G.Y. Alzheimer's disease in Down's syndrome: clinicopathologic studies. Neurology. 1985;7:957–961. doi: 10.1212/wnl.35.7.957. [DOI] [PubMed] [Google Scholar]
- 44.Hyun D.H., Mughal M.R., Yang H., Lee J.H., Ko E.J., Hunt N.D., de C.R., Mattson M.P. The plasma membrane redox system is impaired by amyloid beta-peptide and in the hippocampus and cerebral cortex of 3xTgAD mice. Exp. Neurol. 2010;225:423–429. doi: 10.1016/j.expneurol.2010.07.020. [DOI] [PMC free article] [PubMed] [Google Scholar]
- 45.Oddo S., Caccamo A., Shepherd J.D., Murphy M.P., Golde T.E., Kayed R., Metherate R., Mattson M.P., Akbari Y., LaFerla F.M. Triple-transgenic model of Alzheimer's disease with plaques and tangles: intracellular Abeta and synaptic dysfunction. Neuron. 2003;39:409–421. doi: 10.1016/s0896-6273(03)00434-3. [DOI] [PubMed] [Google Scholar]
- 46.Liu D., Pitta M., Lee J.H., Ray B., Lahiri D.K., Furukawa K., Mughal M., Jiang H., Villarreal J., Cutler R.G., et al. The KATP channel activator diazoxide ameliorates amyloid-beta and tau pathologies and improves memory in the 3xTgAD mouse model of Alzheimer's disease. J. Alzheimers Dis. 2010;22:443–457. doi: 10.3233/JAD-2010-101017. [DOI] [PMC free article] [PubMed] [Google Scholar]
- 47.Gu H., Marth J.D., Orban P.C., Mossmann H., Rajewsky K. Deletion of a DNA polymerase beta gene segment in T cells using cell type-specific gene targeting. Science. 1994;265:103–106. doi: 10.1126/science.8016642. [DOI] [PubMed] [Google Scholar]
- 48.Cabelof D.C., Guo Z., Raffoul J.J., Sobol R.W., Wilson S.H., Richardson A., Heydari A.R. Base excision repair deficiency caused by polymerase beta haploinsufficiency: accelerated DNA damage and increased mutational response to carcinogens. Cancer Res. 2003;63:5799–5807. [PubMed] [Google Scholar]
- 49.Schurman S.H., Hedayati M., Wang Z., Singh D.K., Speina E., Zhang Y., Becker K., Macris M., Sung P., Wilson D.M., III, et al. Direct and indirect roles of RECQL4 in modulating base excision repair capacity. Hum. Mol. Genet. 2009;18:3470–3483. doi: 10.1093/hmg/ddp291. [DOI] [PMC free article] [PubMed] [Google Scholar]
- 50.Gutzkow K.B., Langleite T.M., Meier S., Graupner A., Collins A.R., Brunborg G. High-throughput comet assay using 96 minigels. Mutagenesis. 2013;28:333–340. doi: 10.1093/mutage/get012. [DOI] [PubMed] [Google Scholar]
- 51.Ghosh S., Narang H., Sarma A., Krishna M. DNA damage response signaling in lung adenocarcinoma A549 cells following gamma and carbon beam irradiation. Mutat. Res. 2011;716:10–19. doi: 10.1016/j.mrfmmm.2011.07.015. [DOI] [PubMed] [Google Scholar]
- 52.Katz M.L., Robison W.G., Jr What is lipofuscin? Defining characteristics and differentiation from other autofluorescent lysosomal storage bodies. Arch. Gerontol. Geriatr. 2002;34:169–184. doi: 10.1016/s0167-4943(02)00005-5. [DOI] [PubMed] [Google Scholar]
- 53.Vorhees C.V., Williams M.T. Morris water maze: procedures for assessing spatial and related forms of learning and memory. Nat. Protoc. 2006;1:848–858. doi: 10.1038/nprot.2006.116. [DOI] [PMC free article] [PubMed] [Google Scholar]
- 54.Pellow S., Chopin P., File S.E., Briley M. Validation of open:closed arm entries in an elevated plus-maze as a measure of anxiety in the rat. J. Neurosci. Methods. 1985;14:149–167. doi: 10.1016/0165-0270(85)90031-7. [DOI] [PubMed] [Google Scholar]
- 55.van P.H., Kempermann G., Gage F.H. Running increases cell proliferation and neurogenesis in the adult mouse dentate gyrus. Nat. Neurosci. 1999;2:266–270. doi: 10.1038/6368. [DOI] [PubMed] [Google Scholar]
- 56.Zhang J., Wang Y., Chi Z., Keuss M.J., Pai Y.M., Kang H.C., Shin J.H., Bugayenko A., Wang H., Xiong Y., et al. The AAA+ ATPase Thorase regulates AMPA receptor-dependent synaptic plasticity and behavior. Cell. 2011;145:284–299. doi: 10.1016/j.cell.2011.03.016. [DOI] [PMC free article] [PubMed] [Google Scholar]
- 57.Hirata-Fukae C., Li H.F., Hoe H.S., Gray A.J., Minami S.S., Hamada K., Niikura T., Hua F., Tsukagoshi-Nagai H., Horikoshi-Sakuraba Y., et al. Females exhibit more extensive amyloid, but not tau, pathology in an Alzheimer transgenic model. Brain Res. 2008;1216:92–103. doi: 10.1016/j.brainres.2008.03.079. [DOI] [PubMed] [Google Scholar]
- 58.Cabelof D.C., Raffoul J.J., Yanamadala S., Ganir C., Guo Z., Heydari A.R. Attenuation of DNA polymerase beta-dependent base excision repair and increased DMS-induced mutagenicity in aged mice. Mutat. Res. 2002;500:135–145. doi: 10.1016/s0027-5107(02)00003-9. [DOI] [PMC free article] [PubMed] [Google Scholar]
- 59.Rao K.S., Annapurna V.V., Raji N.S. DNA polymerase-beta may be the main player for defective DNA repair in aging rat neurons. Ann. N.Y. Acad. Sci. 2001;928:113–120. doi: 10.1111/j.1749-6632.2001.tb05641.x. [DOI] [PubMed] [Google Scholar]
- 60.Akbari M., Visnes T., Krokan H.E., Otterlei M. Mitochondrial base excision repair of uracil and AP sites takes place by single-nucleotide insertion and long-patch DNA synthesis. DNA Repair (Amst) 2008;7:605–616. doi: 10.1016/j.dnarep.2008.01.002. [DOI] [PubMed] [Google Scholar]
- 61.Sykora P., Snow E.T. Modulation of DNA polymerase beta-dependent base excision repair in cultured human cells after low dose exposure to arsenite. Toxicol. Appl. Pharmacol. 2008;228:385–394. doi: 10.1016/j.taap.2007.12.019. [DOI] [PubMed] [Google Scholar]
- 62.Srivastava D.K., Berg B.J., Prasad R., Molina J.T., Beard W.A., Tomkinson A.E., Wilson S.H. Mammalian abasic site base excision repair. Identification of the reaction sequence and rate-determining steps. J. Biol. Chem. 1998;273:21203–21209. doi: 10.1074/jbc.273.33.21203. [DOI] [PubMed] [Google Scholar]
- 63.Ismail I.H., Hendzel M.J. The gamma-H2A.X: is it just a surrogate marker of double-strand breaks or much more. Environ. Mol. Mutagen. 2008;49:73–82. doi: 10.1002/em.20358. [DOI] [PubMed] [Google Scholar]
- 64.D'Amelio M., Cavallucci V., Middei S., Marchetti C., Pacioni S., Ferri A., Diamantini A., De Z.D., Carrara P., Battistini L., et al. Caspase-3 triggers early synaptic dysfunction in a mouse model of Alzheimer's disease. Nat. Neurosci. 2011;14:69–76. doi: 10.1038/nn.2709. [DOI] [PubMed] [Google Scholar]
- 65.Luo M., Lu Z., Sun H., Yuan K., Zhang Q., Meng S., Wang F., Guo H., Ju X., Liu Y., et al. Nuclear entry of active caspase-3 is facilitated by its p3-recognition-based specific cleavage activity. Cell Res. 2010;20:211–222. doi: 10.1038/cr.2010.9. [DOI] [PubMed] [Google Scholar]
- 66.Suberbielle E., Sanchez P.E., Kravitz A.V., Wang X., Ho K., Eilertson K., Devidze N., Kreitzer A.C., Mucke L. Physiologic brain activity causes DNA double-strand breaks in neurons, with exacerbation by amyloid-beta. Nat. Neurosci. 2013;16:613–621. doi: 10.1038/nn.3356. [DOI] [PMC free article] [PubMed] [Google Scholar]
- 67.LaFerla F.M., Tinkle B.T., Bieberich C.J., Haudenschild C.C., Jay G. The Alzheimer's A beta peptide induces neurodegeneration and apoptotic cell death in transgenic mice. Nat. Genet. 1995;9:21–30. doi: 10.1038/ng0195-21. [DOI] [PubMed] [Google Scholar]
- 68.Kienlen-Campard P., Miolet S., Tasiaux B., Octave J.N. Intracellular amyloid-beta 1–42, but not extracellular soluble amyloid-beta peptides, induces neuronal apoptosis. J. Biol. Chem. 2002;277:15666–15670. doi: 10.1074/jbc.M200887200. [DOI] [PubMed] [Google Scholar]
- 69.Djavaheri-Mergny M., Maiuri M.C., Kroemer G. Cross talk between apoptosis and autophagy by caspase-mediated cleavage of Beclin 1. Oncogene. 2010;29:1717–1719. doi: 10.1038/onc.2009.519. [DOI] [PubMed] [Google Scholar]
- 70.Nilsson P., Loganathan K., Sekiguchi M., Matsuba Y., Hui K., Tsubuki S., Tanaka M., Iwata N., Saito T., Saido T.C. Abeta secretion and plaque formation depend on autophagy. Cell Rep. 2013;5:61–69. doi: 10.1016/j.celrep.2013.08.042. [DOI] [PubMed] [Google Scholar]
- 71.Rohn T.T., Wirawan E., Brown R.J., Harris J.R., Masliah E., Vandenabeele P. Depletion of Beclin-1 due to proteolytic cleavage by caspases in the Alzheimer's disease brain. Neurobiol. Dis. 2011;43:68–78. doi: 10.1016/j.nbd.2010.11.003. [DOI] [PMC free article] [PubMed] [Google Scholar]
- 72.Pietropaolo S., Feldon J., Yee B.K. Environmental enrichment eliminates the anxiety phenotypes in a triple transgenic mouse model of Alzheimer's disease. Cogn. Affect. Behav. Neurosci. 2014;3:996–1008. doi: 10.3758/s13415-014-0253-3. [DOI] [PubMed] [Google Scholar]
- 73.Porter V.R., Buxton W.G., Fairbanks L.A., Strickland T., O'Connor S.M., Rosenberg-Thompson S., Cummings J.L. Frequency and characteristics of anxiety among patients with Alzheimer's disease and related dementias. J. Neuropsychiatry Clin. Neurosci. 2003;15:180–186. doi: 10.1176/jnp.15.2.180. [DOI] [PubMed] [Google Scholar]
- 74.Sejersted Y., Hildrestrand G.A., Kunke D., Rolseth V., Krokeide S.Z., Neurauter C.G., Suganthan R., Atneosen-Asegg M., Fleming A.M., Saugstad O.D., et al. Endonuclease VIII-like 3 (Neil3) DNA glycosylase promotes neurogenesis induced by hypoxia-ischemia. Proc. Natl. Acad. Sci. U.S.A. 2011;108:18802–18807. doi: 10.1073/pnas.1106880108. [DOI] [PMC free article] [PubMed] [Google Scholar]
- 75.Rodriguez J.J., Jones V.C., Tabuchi M., Allan S.M., Knight E.M., LaFerla F.M., Oddo S., Verkhratsky A. Impaired adult neurogenesis in the dentate gyrus of a triple transgenic mouse model of Alzheimer's disease. PLoS One. 2008;3:e2935. doi: 10.1371/journal.pone.0002935. [DOI] [PMC free article] [PubMed] [Google Scholar]
- 76.Shruster A., Offen D. Targeting neurogenesis ameliorates danger assessment in a mouse model of Alzheimer's disease. Behav. Brain Res. 2014;261:193–201. doi: 10.1016/j.bbr.2013.12.028. [DOI] [PubMed] [Google Scholar]
- 77.Jack C.R., Jr, Petersen R.C., Xu Y., O'Brien P.C., Smith G.E., Ivnik R.J., Boeve B.F., Tangalos E.G., Kokmen E. Rates of hippocampal atrophy correlate with change in clinical status in aging and AD. Neurology. 2000;55:484–489. doi: 10.1212/wnl.55.4.484. [DOI] [PMC free article] [PubMed] [Google Scholar]
- 78.Vorhees C.V., Williams M.T. Morris water maze: procedures for assessing spatial and related forms of learning and memory. Nat. Protoc. 2006;1:848–858. doi: 10.1038/nprot.2006.116. [DOI] [PMC free article] [PubMed] [Google Scholar]
- 79.Kovtun I.V., Johnson K.O., McMurray C.T. Cockayne syndrome B protein antagonizes OGG1 in modulating CAG repeat length in vivo. Aging (Albany, NY) 2011;3:509–514. doi: 10.18632/aging.100324. [DOI] [PMC free article] [PubMed] [Google Scholar]
- 80.Kovtun I.V., Liu Y., Bjoras M., Klungland A., Wilson S.H., McMurray C.T. OGG1 initiates age-dependent CAG trinucleotide expansion in somatic cells. Nature. 2007;447:447–452. doi: 10.1038/nature05778. [DOI] [PMC free article] [PubMed] [Google Scholar]
- 81.Mullaart E., Boerrigter M.E., Ravid R., Swaab D.F., Vijg J. Increased levels of DNA breaks in cerebral cortex of Alzheimer's disease patients. Neurobiol. Aging. 1990;11:169–173. doi: 10.1016/0197-4580(90)90542-8. [DOI] [PubMed] [Google Scholar]
- 82.Boerrigter M.E., Vijg J. Studies on DNA repair defects in degenerative brain disease. Age Ageing. 1993;22:S44–S52. doi: 10.1093/ageing/22.suppl_1.s44. [DOI] [PubMed] [Google Scholar]
- 83.Liu D., Pitta M., Jiang H., Lee J.H., Zhang G., Chen X., Kawamoto E.M., Mattson M.P. Nicotinamide forestalls pathology and cognitive decline in Alzheimer mice: evidence for improved neuronal bioenergetics and autophagy procession. Neurobiol. Aging. 2013;34:1564–1580. doi: 10.1016/j.neurobiolaging.2012.11.020. [DOI] [PMC free article] [PubMed] [Google Scholar]
- 84.Yao J., Irwin R.W., Zhao L., Nilsen J., Hamilton R.T., Brinton R.D. Mitochondrial bioenergetic deficit precedes Alzheimer's pathology in female mouse model of Alzheimer's disease. Proc. Natl. Acad. Sci. U.S.A. 2009;106:14670–14675. doi: 10.1073/pnas.0903563106. [DOI] [PMC free article] [PubMed] [Google Scholar]
- 85.Yao J., Chen S., Mao Z., Cadenas E., Brinton R.D. 2-Deoxy-D-glucose treatment induces ketogenesis, sustains mitochondrial function, and reduces pathology in female mouse model of Alzheimer's disease. PLoS One. 2011;6:e21788. doi: 10.1371/journal.pone.0021788. [DOI] [PMC free article] [PubMed] [Google Scholar]
- 86.Hokama M., Oka S., Leon J., Ninomiya T., Honda H., Sasaki K., Iwaki T., Ohara T., Sasaki T., LaFerla F.M., et al. Altered expression of diabetes-related genes in Alzheimer's disease brains: the Hisayama study. Cereb. Cortex. 2014;24:2476–2488. doi: 10.1093/cercor/bht101. [DOI] [PMC free article] [PubMed] [Google Scholar]
- 87.Zhang B., Gaiteri C., Bodea L.G., Wang Z., McElwee J., Podtelezhnikov A.A., Zhang C., Xie T., Tran L., Dobrin R., et al. Integrated systems approach identifies genetic nodes and networks in late-onset Alzheimer's disease. Cell. 2013;153:707–720. doi: 10.1016/j.cell.2013.03.030. [DOI] [PMC free article] [PubMed] [Google Scholar]
- 88.Ramamoorthy M., Sykora P., Scheibye-Knudsen M., Dunn C., Kasmer C., Zhang Y., Becker K.G., Croteau D.L., Bohr V.A. Sporadic Alzheimer disease fibroblasts display an oxidative stress phenotype. Free Radic. Biol. Med. 2012;53:1371–1380. doi: 10.1016/j.freeradbiomed.2012.07.018. [DOI] [PMC free article] [PubMed] [Google Scholar]
- 89.Cabelof D.C., Ikeno Y., Nyska A., Busuttil R.A., Anyangwe N., Vijg J., Matherly L.H., Tucker J.D., Wilson S.H., Richardson A., et al. Haploinsufficiency in DNA polymerase beta increases cancer risk with age and alters mortality rate. Cancer Res. 2006;66:7460–7465. doi: 10.1158/0008-5472.CAN-06-1177. [DOI] [PubMed] [Google Scholar]
- 90.Wilson D.M., III, Kim D., Berquist B.R., Sigurdson A.J. Variation in base excision repair capacity. Mutat. Res. 2011;711:100–112. doi: 10.1016/j.mrfmmm.2010.12.004. [DOI] [PMC free article] [PubMed] [Google Scholar]
- 91.Raji N.S., Rao K.S. Trisomy 21 and accelerated aging: DNA-repair parameters in peripheral lymphocytes of Down's syndrome patients. Mech. Ageing Dev. 1998;100:85–101. doi: 10.1016/s0047-6374(97)00121-8. [DOI] [PubMed] [Google Scholar]
- 92.Hoeijmakers J.H. DNA damage, aging, and cancer. N. Engl. J. Med. 2009;361:1475–1485. doi: 10.1056/NEJMra0804615. [DOI] [PubMed] [Google Scholar]
- 93.Wang J., Xiong S., Xie C., Markesbery W.R., Lovell M.A. Increased oxidative damage in nuclear and mitochondrial DNA in Alzheimer's disease. J. Neurochem. 2005;93:953–962. doi: 10.1111/j.1471-4159.2005.03053.x. [DOI] [PubMed] [Google Scholar]
- 94.Wang J., Markesbery W.R., Lovell M.A. Increased oxidative damage in nuclear and mitochondrial DNA in mild cognitive impairment. J. Neurochem. 2006;96:825–832. doi: 10.1111/j.1471-4159.2005.03615.x. [DOI] [PubMed] [Google Scholar]
- 95.Gabbita S.P., Lovell M.A., Markesbery W.R. Increased nuclear DNA oxidation in the brain in Alzheimer's disease. J. Neurochem. 1998;71:2034–2040. doi: 10.1046/j.1471-4159.1998.71052034.x. [DOI] [PubMed] [Google Scholar]
- 96.Nixon R.A. The role of autophagy in neurodegenerative disease. Nat. Med. 2013;19:983–997. doi: 10.1038/nm.3232. [DOI] [PubMed] [Google Scholar]
- 97.Nilsson P., Saido T.C. Dual roles for autophagy: degradation and secretion of Alzheimer's disease Abeta peptide. Bioessays. 2014;36:570–578. doi: 10.1002/bies.201400002. [DOI] [PMC free article] [PubMed] [Google Scholar]
- 98.Driscoll I., Troncoso J. Asymptomatic Alzheimer's disease: a prodrome or a state of resilience. Curr. Alzheimer Res. 2011;8:330–335. doi: 10.2174/156720511795745348. [DOI] [PMC free article] [PubMed] [Google Scholar]
- 99.Halagappa V.K., Guo Z., Pearson M., Matsuoka Y., Cutler R.G., LaFerla F.M., Mattson M.P. Intermittent fasting and caloric restriction ameliorate age-related behavioral deficits in the triple-transgenic mouse model of Alzheimer's disease. Neurobiol. Dis. 2007;26:212–220. doi: 10.1016/j.nbd.2006.12.019. [DOI] [PubMed] [Google Scholar]
- 100.Chadwick W., Mitchell N., Caroll J., Zhou Y., Park S.S., Wang L., Becker K.G., Zhang Y., Lehrmann E., Wood W.H., III, et al. Amitriptyline-mediated cognitive enhancement in aged 3xTg Alzheimer's disease mice is associated with neurogenesis and neurotrophic activity. PLoS One. 2011;6:e21660. doi: 10.1371/journal.pone.0021660. [DOI] [PMC free article] [PubMed] [Google Scholar]
- 101.Borgesius N.Z., de Waard M.C., van der Pluijm I., Omrani A., Zondag G.C., van der Horst G.T., Melton D.W., Hoeijmakers J.H., Jaarsma D., Elgersma Y. Accelerated age-related cognitive decline and neurodegeneration, caused by deficient DNA repair. J. Neurosci. 2011;31:12543–12553. doi: 10.1523/JNEUROSCI.1589-11.2011. [DOI] [PMC free article] [PubMed] [Google Scholar]
- 102.Fang E.F., Scheibye-Knudsen M., Brace L.E., Kassahun H., Sengupta T., Nilsen H., Mitchell J.R., Croteau D.L., Bohr V.A. Defective mitophagy in XPA via PARP-1 hyperactivation and NAD(+)/SIRT1 reduction. Cell. 2014;157:882–896. doi: 10.1016/j.cell.2014.03.026. [DOI] [PMC free article] [PubMed] [Google Scholar]
- 103.Mattson M.P., Gleichmann M., Cheng A. Mitochondria in neuroplasticity and neurological disorders. Neuron. 2008;60:748–766. doi: 10.1016/j.neuron.2008.10.010. [DOI] [PMC free article] [PubMed] [Google Scholar]
- 104.Shoffner J.M. Oxidative phosphorylation defects and Alzheimer's disease. Neurogenetics. 1997;1:13–19. doi: 10.1007/s100480050002. [DOI] [PubMed] [Google Scholar]
- 105.Canugovi C., Yoon J.S., Feldman N.H., Croteau D.L., Mattson M.P., Bohr V.A. Endonuclease VIII-like 1 (NEIL1) promotes short-term spatial memory retention and protects from ischemic stroke-induced brain dysfunction and death in mice. Proc. Natl. Acad. Sci. U.S.A. 2012;109:14948–14953. doi: 10.1073/pnas.1204156109. [DOI] [PMC free article] [PubMed] [Google Scholar]
- 106.Liu D., Croteau D.L., Souza-Pinto N., Pitta M., Tian J., Wu C., Jiang H., Mustafa K., Keijzers G., Bohr V.A., et al. Evidence that OGG1 glycosylase protects neurons against oxidative DNA damage and cell death under ischemic conditions. J. Cereb. Blood Flow Metab. 2011;31:680–692. doi: 10.1038/jcbfm.2010.147. [DOI] [PMC free article] [PubMed] [Google Scholar]
- 107.Mark R.J., Pang Z., Geddes J.W., Uchida K., Mattson M.P. Amyloid beta-peptide impairs glucose transport in hippocampal and cortical neurons: involvement of membrane lipid peroxidation. J. Neurosci. 1997;17:1046–1054. doi: 10.1523/JNEUROSCI.17-03-01046.1997. [DOI] [PMC free article] [PubMed] [Google Scholar]
- 108.Yang J.L., Lin Y.T., Chuang P.C., Bohr V.A., Mattson M.P. BDNF and exercise enhance neuronal DNA repair by stimulating CREB-mediated production of apurinic/apyrimidinic endonuclease 1. Neuromolecular Med. 2014;16:161–174. doi: 10.1007/s12017-013-8270-x. [DOI] [PMC free article] [PubMed] [Google Scholar]
- 109.Voss M.W., Vivar C., Kramer A.F., van P.H. Bridging animal and human models of exercise-induced brain plasticity. Trends Cogn. Sci. 2013;17:525–544. doi: 10.1016/j.tics.2013.08.001. [DOI] [PMC free article] [PubMed] [Google Scholar]
Associated Data
This section collects any data citations, data availability statements, or supplementary materials included in this article.