


Abstract
FOXP3 is a lineage-specific transcription factor that is required for regulatory T cell development and function. In this study, we determined the crystal structure of the FOXP3 forkhead domain bound to DNA. The structure reveals that FOXP3 can form a stable domain-swapped dimer to bridge DNA in the absence of cofactors, suggesting that FOXP3 may play a role in long-range gene interactions. To test this hypothesis, we used circular chromosome conformation capture coupled with high throughput sequencing (4C-seq) to analyze FOXP3-dependent genomic contacts around a known FOXP3-bound locus, Ptpn22. Our studies reveal that FOXP3 induces significant changes in the chromatin contacts between the Ptpn22 locus and other Foxp3-regulated genes, reflecting a mechanism by which FOXP3 reorganizes the genome architecture to coordinate the expression of its target genes. Our results suggest that FOXP3 mediates long-range chromatin interactions as part of its mechanisms to regulate specific gene expression in regulatory T cells.
INTRODUCTION
CD4+CD25+ regulatory T cells (Treg), a specialized subset of CD4+ T cells that suppress immune responses, play important roles in immunological homeostasis and self-tolerance (1). FOXP3, a forkhead transcription factor, is essential for the development and function of CD4+CD25+ Treg cells (2–4). Deletion or mutations of FOXP3 cause lethal autoimmunity in scurfy mice and a severe autoimmune syndrome termed IPEX (immune dysregulation, polyendocrinopathy, enteropathy, X-linked) syndrome in patients (5–8). Targeted deletion of FOXP3 in CD4+ T cells of mice leads to severe autoimmunity (9,10). Ectopic expression of FOXP3 in conventional CD4+ T cells induces a Treg phenotype, and confers the capacity to suppress proliferation of naive T cells in vitro (2,4,11) and to suppress inflammation and autoimmune pathology in vivo (2,12). Therefore, FOXP3 is necessary and sufficient to encode the core immunoregulatory program of regulatory T cells.
An important step toward understanding the mechanisms of Treg function is to decipher the transcriptional program regulated by FOXP3. Genome-wide binding site analyses (ChIP-chip or ChIP-seq) coupled with expression profiling have revealed thousands of transcriptional targets of human and murine FOXP3 and associated epigenetic markers (13–19). While these studies have identified a number of target genes and signaling pathways that are important to Treg function, how these individual signaling and transcription events are coordinated by FOXP3 in Tregs is still not clear. A limitation of most current genome-wide analyses is that they adopt a 1D view of the genetic code without considering the 3D structure of the genome. As such, 3D information is condensed into 1D. For example, genes, epigenetic marks, or other FOXP3-associated functional elements located far away on the linear genome may interact with each other in 3D for coordinated activities. Understanding the long-range chromatin interactions is therefore critical to understanding complex biological questions such as FOXP3-dependent suppression function in Tregs.
The FOXP3 protein contains an N-terminal region required for transcriptional activation and repression, a central zinc finger, a leucine zipper domain implicated in oligomer formation and a conserved forkhead domain (FKH) at the C-terminus that is responsible for DNA binding. The function of FOXP3 protein depends critically on its forkhead domain, demonstrated by the fact that most of the missense mutations in IPEX are located in the forkhead domain. The forkhead domain is necessary and sufficient for FOXP3 to bind its cognate sequence 5′-AAACA-3′ (12,20). Upon DNA binding, FOXP3 regulates the transcription of target genes, including genes that are upregulated (Cd25, Ctla4 and Tnfrsf18) and genes that are repressed (Il2 andPtpn22) (21,22), leading to immune suppression.
Previous structural studies of FOXP2 reveal that its forkhead domain forms a domain-swapped dimer, whereas the conventional forkhead domain is monomeric (23). Structure-based sequence comparison indicates that domain-swapping is caused by the substitution of a key proline residue conserved in classical forkhead domains by an alanine in the FOXP subfamily of forkhead proteins (FOXP1–4), suggesting that domain-swapping is likely a unique property of the FOXP family of transcription factors. Recent structural studies suggest that domain swapping is conserved in the NFAT/FOXP3/DNA complex, and that the domain-swapped FOXP3 dimer can bind two separated DNA molecules to bridge two double-stranded DNA together (24). Consistent with the structure, biochemical analyses indicated that FOXP3 could bind distal sites on a DNA to form a loop in solution. These observations raise the question of whether FOXP3 can mediate long-range chromatin interactions as part of its mechanism of transcriptional regulation in Tregs. The fact that some IPEX-associated mutations in FOXP3 map to the domain-swapping interface suggests that domain-swapping may be functionally relevant. Moreover, structure-guided mutations of FOXP3 that are designed to disrupt domain-swapping without compromising DNA binding diminished dimer formation by the forkhead domain and eliminated T cell-suppressive activity conferred by FOXP3 (24).
To further address the potential function of domain swapping in FOXP3, we solved the crystal structure of the FKH domain of FOXP3 bound to DNA. In this structure, FOXP3 is able to form a domain-swapped dimer and bridge two separate pieces of DNA in the absence of NFAT. To determine whether FOXP3 can facilitate the interactions between distant genes and regulatory elements in the context of the native genome, we used circular chromosome conformation capture-sequencing (4C-seq) technology to characterize the genomic environment around protein tyrosine phosphatase Ptpn22, one of the highest confidence direct targets of FOXP3 (13). Ptpn22 affects the responsiveness of T and B cell receptors, and mutations of PTPN22 are associated with several autoimmune diseases (13). Our chromatin immunoprecipitation, gene expression, and 4C-seq analyses indicate that FOXP3 can induce local chromosome conformational changes around the Ptpn22 enhancer, and can bring other direct FOXP3 target genes into close proximity to the Ptpn22 enhancer. The majority of these Ptpn22-proximal genes are regulated by FOXP3, suggesting that FOXP3 can physically organize sets of genes into a ‘chromatin hub’ (25) to coordinate transcriptional regulation.
MATERIALS AND METHODS
Sample preparation and crystallization
Human FOXP3 (amino acids 336–419) was prepared as previously described (24). The DNA fragments used for crystallization were synthesized by IDT and purified as described previously (26,27). The two strands of DNA are 5′-AACTATGAAACAAATTTTCCT-3′ and 5′-TTAGGAAAA TTTGTTTCATAG-3′. The FOXP3:DNA complex was prepared by mixing purified FOXP3 and DNA at 2:1 molar ratio at ∼15 mg/ml. Crystals were grown by hanging drop at 18°C using a reservoir buffer of 50 mM 4-(2-hydroxyethyl)-1-piperazineethanesulfonic acid (HEPES) (pH 7.0), 20 mM magnesium chloride, 100 mM ammonium acetate, 5% PEG8000.
Data collection and structure determination
Crystals were stabilized in the crystallization buffer with 20% (w/v) glycerol and flash frozen with liquid nitrogen for cryocrystallography. Data were collected at the Advanced Light Source BL5.0.1 beamline at Lawrence Berkeley National Laboratory. Data were reduced using HKL2000 (28). Molecular replacement solution was found using the coordinate of the FOXP3forkhead domain (Protein Data Bank [PDB] ID: 3QRF) as a search model. Refinement was done using CNS refine (29), CCP4 refmac5 (30)and Phenix.refine (31). Model building and analysis were carried out using Coot (32). The statistics of the crystallographic analysis are presented in Table 1. Graphical representation of structure was prepared using Pymol (DeLano Scientific, San Francisco, CA, USA).
Table 1. Statistics of data and structure refinement.
| FOXP3/DNA | |
|---|---|
| Data collection | |
| Space group | P21212 |
| Cell dimensions | |
| a, b, c (Å) | 81.43, 84.84, 68.31 |
| α, β, γ (°) | 90.00, 90.00, 90.00 |
| Resolution (Å) | 50.00–3.40 (3.46–3.40) |
| Rsym or Rmerge | 0.211 (0.312) |
| I / σI | 8.65 (3.12) |
| Completeness (%) | 93.9 (61.4) |
| Redundancy | 5.4 (2.6) |
| Refinement | |
| Resolution (Å) | 44.54–3.40 |
| No. of reflections | 5971 |
| Rwork/Rfree | 0.21/0.26 |
| No. of atoms | |
| Protein | 1388 |
| DNA | 855 |
| B-factors | |
| Protein | 66.60 |
| DNA | 68.45 |
| R.M.S. deviations | |
| Bond lengths (Å) | 0.01 |
| Bond angles (°) | 1.70 |
Cell preparation
CD4+CD25− T cells were isolated from C57BL/6 mice using Miltenyi Treg isolation kit, consistently yielding CD4+ purity above 93% and CD25-purity above 97%. CD4+CD25− cells were transduced as described previously (22) with either empty retroviral vector (MINR1-IRES-NGFR) or vector encoding FOXP3 (MINR1-FOXP3-IRES-NGFR). After 72 h, transduced cells were purified using an NGFR affinity column, yielding >95% pure transduced cells. Transduced cells were then restimulated by plate-bound anti-CD3/anti-CD28 (2 ug/ml anti-CD3, 1 ug/ml anti-CD28) for 4 h before use in ChIP, mRNA and 4C-seq analyses.
Suppression of inflammatory bowel disease
To assess the immunoregulatory function of the FOXP3-transduced CD4+ T cells used in this study, we used an adoptive transfer-based IBD model as described previously (33). Briefly, naïve CD4+CD25− T cells were transferred into immunodeficient RAG1−/− mice together with eitherFOXP3-transduced CD4+ T cells, EV-transduced cells, or phosphate buffered saline (PBS). Animals were weighed and monitored every other day for signs of colitis.
4C library preparation
4C library preparation was performed as described previously (34). In brief, transduced CD4+ T cells were treated with 1% formaldehyde for 10 min to cross-link regions of the genome in physical proximity, and chromatin–DNA complexes were digested with the restriction enzyme HindIII. The digested chromatin was then diluted to 2.5 ng/ul to favor intra-molecular ligation over inter-molecular ligation. After reversal of cross-links, the HindIII-ligated 3C template (∼50 ug) was digested overnight at a concentration of 100 ng/ul with 50 units of the frequent restriction enzyme DpnII. After DpnII digestion, DNA was phenol extracted, ethanol precipitated, then ligated at low concentration (2.5 ng/ul) for 4 h at 16°C. The ligation products were phenol extracted, ethanol precipitated, and referred to as the 4C library. Captured sequences were amplified using Ptpn22-specific primers (5′-GTGGTCGTACATGCCTTTGATC-3′ and 5′- CCAACCTGCTGTGTTCTAAAAGC-3′) immediately adjacent to the HindIII and DpnII sites (Figure 2D). The library was sonicated to an average size of 200 bp, ligated with adapter, and then subjected for Illumina sequencing (36-base read).
Figure 2.
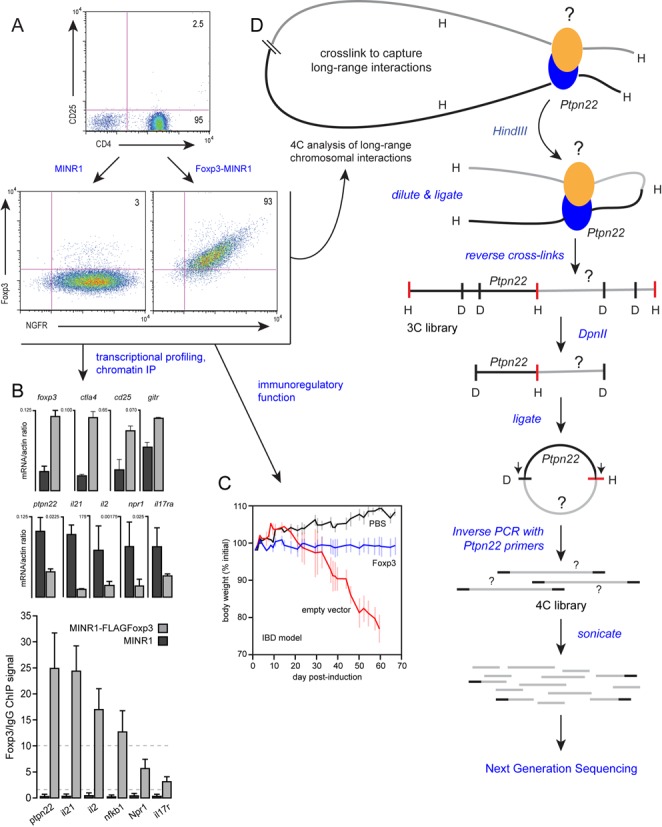
Circular chromosome conformation capture sequencing (4C-seq) analysis of long-range interactions at the Ptpn22 locus in a functional FOXP3 model. (A) Purified CD4+ T cells (top panel) were transduced with MSCV-NGFR (MINR1) empty vector (bottom left panel) or MINR1-FOXP3 (bottom right panel). (B) Transduced cells were subjected to gene expression analyses by qRT-PCR (top panels), and FOXP3 binding to endogenous target genes was measured using ChIP-qPCR (bottom panel). (C) Immunoregulatory function was assessed in an in vivo IBD model in which naive, pathogenic CD4+ T cells are co-transferred into immunodeficient mice together with PBS (black), empty vector-transduced cells (red) or FOXP3-transduced cells (blue). (D) Empty vector- and FOXP3-transduced cells were subjected to 4C analysis to assess genome-wide interactions at the Ptpn22 locus.
4C-seq data processing
A de novo assembly of the 4C-seq sequencing reads was performed on libraries (https://code.google.com/p/standardized-velvet-assembly-report/), generating a total of 8646 contigs with an average read coverage of 17.4. These contigs were assigned to the mouse genome MM9 using the Novoalign alignment program (http://www.novocraft.com). Overlapping contigs from the same or different libraries were merged to obtain 3976 non-overlapping contigs. The boundaries of these contigs were re-defined by searching for HindIII and DpnII sites within them or nearby regions. All possible sub-sequences bookended by a HindIII–DpnII pair were attached with the primer sequences and used as reference sequences to re-align all the sequencing reads. Only perfect and unique alignments were reported. The smallest sub-sequence of each contig containing at least 90% of the total reads aligned to that contig was picked as the location of an interaction. If none of the sub-sequences got 90% of the reads, the one with the largest portion of the reads was picked. There were finally 3296 4C sites bookended by a HindIII-DpnII pair and having an average length of 625 bp and sequencing depth of 2.0. Finally, 4C contigs were mapped to the mm9 mouse reference genome and scanned for the FOXP3 consensus binding sequence (AAACA).
ChIP-qPCR analysis
Chromatin immunoprecipitation (ChIP) was conducted as described previously (22). Briefly, fixed chromatin from EV- or FLAG-FOXP3-transduced cells was sonicated and immunoprecipitated with anti-FLAG antibody. Genomic DNA was probed by qPCR for genomic regions identified by 4C-seq. PCR primers for ChIP test were listed in Supplementary Table S1. PCR primers were designed by Primer Express 3, Real-time PCR was performed using SyberGreen Plus master mix on a StepOne Plus thermal cycler (Applied Biosystem).
qRT-PCR and Affymetrix analysis of mRNA expression
Total RNA from activated transduced cells was isolated using TRIzol reagent (invitrogen), and dissolved in RNase-free H2O. Total RNA treated with RNase-free DNase and cleaned up using Qiagen RNeasy columns. One microgram of total RNA was reverse-transcribed using a BioRadiScript™ Select cDNA Synthesis kit. Gene expression was analyzed with Applied Biosystem Custom Format 32 TaqManAarry 96-Well FAST plate. For array analysis, biotinylated antisense cRNA was prepared by two rounds of amplification using the BioArray RNA Amplification and Labeling system according to the protocol for 10–1000 ng of input RNA. cDNA libraries were amplified and hybridized to AffymetrixGeneChip Mouse Gene 1.0 ST array at the nucleic acid and Protein core facility of the Children's Hospital of Philadelphia Research Institute. Array data were normalized, and differentially expression was estimated using the Packages including Utils, Stats, Samr, RankProd, topGO and in Bioconductor using R. Significant analysis of microarrays (SAM) was used for the statistical analysis. Genes differing in intensity by 1.5-fold (up or down) with a P-value of <0.001 were considered FOXP3 regulated.
Gene ontogeny and pathway analysis
Functional annotation of the top 200 FOXP3-regulated genes and the top 200 genes involved in FOXP3-dependent Ptpn22 interactions was achieved using Database for Annotation, Visualization and Integrated Discovery (DAVID) software (35), and network analyses of the same gene sets were generated using Ingenuity™ software.
RESULTS
Crystal structure of a binary FOXP3:DNA complex
Previous studies of the ternary NFAT1:FOXP3:DNA complex have shown that the FOXP3 forkhead domain forms a domain-swapped dimer that bridges two separate pieces of DNA (24). However, it is not clear if DNA bridging by FOXP3 is induced by interaction with NFAT, and if the structure of FOXP3 observed in the ternary complex is the same as that of FOXP3 when it binds DNA alone. Because FOXP3 can function in different genomic contexts in the absence of NFAT (13), it is important to find out if DNA bridging is an intrinsic property of FOXP3 and if the structure of the bridged protein-DNA complex can be affected by interactions with cooperative partners such as NFAT.
To address these questions, we carried out crystallographic studies of the forkhead domain of the FOXP3protein (amino acid residues 336–420) bound to a double-stranded DNA fragment containing the murine Il2 promoter ARRE2 site. The crystal belongs to space group P21212, and the structure was solved by molecular replacement at 3.4 Å (Table 1). The asymmetric unit contains two copies of FOXP3 protein and one double-stranded DNA molecule. Unlike in the FOXP2/DNA complex structure, where FOXP2 exists both in monomer and domain-swapped dimer forms, FOXP3 only exists as a domain-swapped dimer. This is consistent with our previous finding that FOXP3 forms a stable domain-swapped dimer in solution (24). One FOXP3 FKH domain of the domain-swapped dimer binds to the 5′-ATTTG-3′ site of one DNA molecule, while the other one binds to the 5′-TGTTT-3′ site on a separate, symmetry-related DNA. The two dsDNA molecules are antiparallel to each other in the crystal lattice. The distance from the center of one DNA molecule to the other is 48 Å (Figure 1A).
Figure 1.
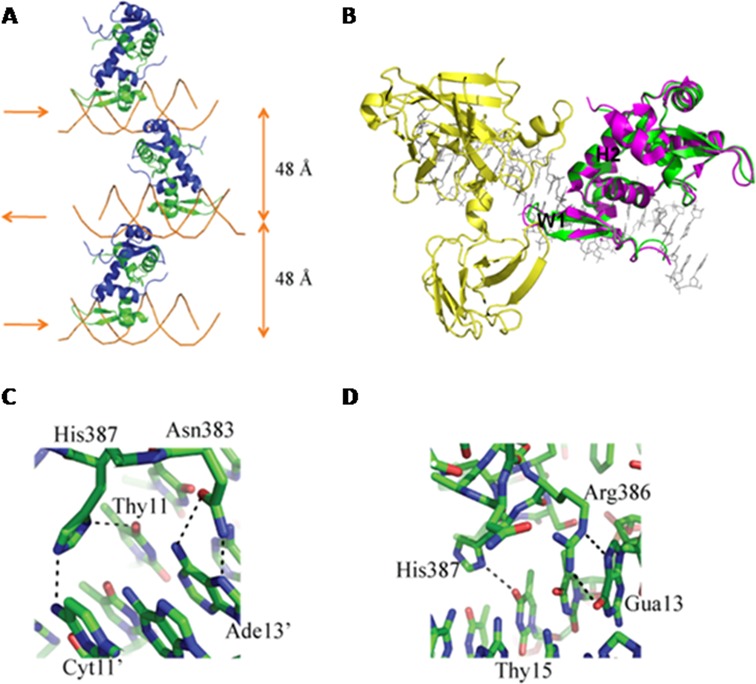
Crystal structure of a binary FOXP3/DNA complex. (A) Overall structure of FOXP3/DNA complex. Complexes of the FOXP3 forkhead domain bound to DNA from neighboring asymmetric units are shown to illustrate DNA bridging by FOXP3. Two FOXP3 molecules form a domain swapped dimer, with one colored in green and the other colored in blue. The DNA is colored in orange. (B) Superposition of the ternary complex of NFAT (yellow), FOXP3 dimer (magenta), and DNA (gray) with the binary complex of FOXP3 dimer (green) and DNA using one FOXP3 monomer as the reference. The structures of the FOXP3 dimer in both complexes are very similar with a RMSD of 0.341 Å for backbone Cα atoms. H2: helix H2. W1: Wing1. (C) Hydrogen-bonding interactions between Asn383 and His387 of FOXP3 and ‘ATTTG’ site. (D) Hydrogen-bonding interactions between Arg386 and His387 of FOXP3 and ‘TGTTT’ site.
The structure of the FOXP3 dimer in the binary FOXP3:DNA complex is very similar to that in the ternary NFAT:FOXP3:DNA complex, except for Wing1 (W1) which locates in the center of the NFAT:FOXP3 interface in the ternary complex (Figure 1B). There are two NFAT-interacting interfaces in FOXP3, one locates at helix H2 and the other at Wing1 (W1). The structures of the helix H2 in both structures are almost identical. In the NFAT/FOXP3 ternary complex, Wing1 moves closer to NFAT, with Glu401 and Lys402 engaging in extensive interactions with NFAT (Figure 1B); while in the absence of NFAT, there is no electron density for the side chains of Glu401 and Lys402 (Supplementary Figure S1).
For the 5′-ATTTG-3′ site, Asn383 of one FOXP3 monomer forms bidentate hydrogen bonds with Ade13′, and His387 of the same monomer forms hydrogen bonds with Thy11 and Cyt11′ (Figure 1C); For the 5′-TGTTT-3′ site, Arg386 of the other FOXP3 monomer forms bidentate hydrogen bonds with Gua13, and its His387 forms a hydrogen bond with Thy15 (Figure 1D). Besides these hydrogen bonds, there are numerous van der Waals contacts between the FOXP3 FKH domain and corresponding sites to stabilize the protein/DNA interaction (Supplementary Figure S2).
The classical FKH domain has a monomeric fold comprised of three α helices (H1, H2 and H3) and three β strands (S1, S2 and S3). The domain swapping of FOXP3 is formed by an extensive exchange of structure elements (helix H3, and strands S2 and S3) between two FOXP3 monomers, as described previously (24). The structure of the domain-swapped FOXP2 dimer is significantly different from that of the domain-swapped FOXP3 dimer, despite the fact that the FKH domains of FOXP3 and FOXP2 share high sequence identity. Compared with the FOXP2 dimer, the FOXP3 dimer is much more arched, such that the two DNA binding surfaces oppose each other (Supplementary Figure S3). Three mutations in this interface, F371C, F373A and R347H, have been described in IPEX patients. Moreover, these mutations have been shown to eliminate T cell-suppressive activity conferred by FOXP3. Therefore, FOXP3 forms a stable domain-swapped dimer, and this domain-swapping is physiologically relevant to FOXP3 function.
Circular chromosome conformation capture sequencing (4C-seq) analysis of long-range interactions at a FOXP3 target gene
In our FOXP3:DNA crystal structures, domain swapping caused the FOXP3 dimer to bridge two DNA molecules that are arranged closely in an anti-parallel orientation (Figure 1A). Because of these structural constraints, it is unlikely that the FOXP3 dimer could bind two closely spaced FOXP3 binding sites, however, it could bind two distant FOXP3 binding sites to cause chromosome looping. Consistent with this hypothesis, most identified FOXP3 binding sites identified in vivo are isolated sites scattered throughout the chromosome. Our previous in-gel FRET studies have provided evidence that the FOXP3 dimer can bring two distal FOXP3 sites into close proximity in solution in vitro (24). To test whether FOXP3 can facilitate long-range interactions between distant loci in vivo, we used circular chromosome conformation capture-sequencing technology (4C-seq) to analyze chromatin contacts around a selected FOXP3 target site. This approach is similar to the 4C method described previously (34,36), except that deep sequencing is used instead of microarrays to detect captured DNA fragments (34,37–39). This method begins with a chosen genomic locus as an anchor (the bait, see Figure 2D), and detects, in an unbiased manner, any genomic region that has been brought close to the bait locus as a result of the local chromosomal conformation of the cell.
We used this approach to characterize FOXP3-dependent changes in the local genomic environment of the Ptpn22 locus, a known in vivo target of FOXP3 (13), by performing Ptpn22-anchored 4C-seq in primary CD4+ T cells engineered to express FOXP3. While ‘natural’ regulatory T cells express FOXP3 and might seem an obvious choice for these 4C-seq analyses, FOXP3 is not involved in the initial Treg lineage choice in the thymus (40), and a significant portion of the Treg lineage-specific gene expression program does not depend upon FOXP3 (41). The purpose of this study is to test the structure-derived hypothesis that FOXP3 may play a particular role in chromosomal conformations by physically linking its distal sites. To ensure the observed effects are specifically mediated by FOXP3, we ectopically expressed FOXP3 in conventional CD4+ T cells by retroviral transduction (Figure 2A). This is a functionally relevant system, as FOXP3-transduced T cells take on a Treg-specific transcriptional profile (Figure 2B), and exhibit immunoregulatory function in experimental models of inflammatory bowel disease (Figure 2C) and type 1 diabetes (12). Cells transduced with FOXP3, or control cells transduced with empty vector (EV), were treated with formaldehyde to cross-link regions of the genome in physical proximity (Figure 2D), and chromatin–DNA complexes were digested with the restriction enzyme HindIII. The digested chromatin was then diluted to favor intra-molecular ligation over intermolecular ligation. Ligation and reversal of the formaldehyde cross-links yielded a mixture of chimeric DNA fragments consisting of the Ptpn22 ‘bait’ sequence fused to captured sequences (the ‘3C’ library). This library was further digested with the frequent cutter DpnII, and ligated to form a mixture of chimeric circular molecules (the ‘4C’ library). Captured sequences were amplified using Ptpn22-specific primers immediately adjacent to the HindIII and DpnII sites (Figure 2D). PCR products were sonicated to an average size of 200 bp, ligated with adapter, and then subjected for sequencing.
Deep sequencing generated a comparable number of reads from EV-transduced cells (8 016 192) and FOXP3-transduced cells (6 740 720). To identify genomic regions specifically interacting with Ptpn22, we assembled overlapping reads into contigs in silico, then mapped the assembled contigs to the mouse genome (mm9). Sets of contigs that mapped between flanking HindIII and DpnII sites were then merged, representing captured HindIII–DpnII genomic fragments that we refer to as Ptpn22-interacting regions. This analysis yielded a total of 3296 interactions across both samples (Supplementary Table S2).
FOXP3 reorganizes the chromosomal ‘interactome’ at the Ptpn22 locus
While some of the chromosomal interactions occurred independently of FOXP3 (∼575, Figure 3A, green), the majority (>70%) were influenced by FOXP3. For instance, 622 interactions were enriched at least 10-fold in FOXP3-expressing cells over control cells (Figure 3A, blue). Although it is not clear what portion of these interactions are directly mediated by FOXP3, our crystal structures suggest DNA bridging by the domain-swapped FOXP3 dimer likely plays a significant role in these long-range chromatin interactions. Interestingly, we also detected 1272 Ptpn22 interactions that were highly enriched (>10-fold) in FOXP3-negative cells, indicating that these interactions are specifically abolished in the presence of FOXP3 (Figure 3A, red), probably due to competition from FOXP3-dependent interactions and indirect effects from FOXP3-induced chromosome conformation changes.
Figure 3.
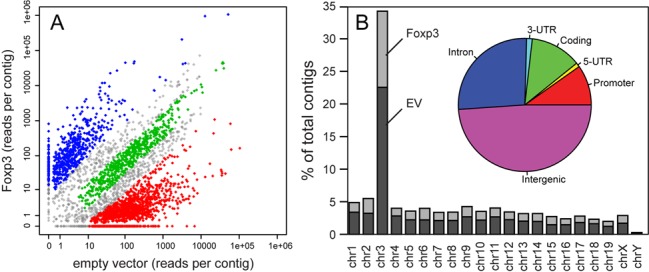
Influence of FOXP3 on the genomic distribution of Ptpn22-interacting regions. The number of deep-sequencing reads per assembled contig (see ‘Materials and Methods’ section) obtained from the 4C libraries from FOXP3-transduced (y-axis) versus empty vector-transduced (x-axis) cells were plotted (A). Contigs with read frequencies that varied <3-fold between each group were considered FOXP3-independent (green), while contings exhibiting a 10-fold or greater difference in read frequency between each group were defined as FOXP3-dependent (blue and red). (B) Frequency of 4C contigs from FOXP3-transduced (light gray) versus empty vector-transduced (dark gray) libraries across chromosomes. The pie chart in the inset depicts the relative distribution of 4C contigs from both groups within annotated regions (intergenic, intronic, 3′-UTR, 5′-UTR, promoter, and coding) of the mouse genome.
We were able to identify Ptpn22-interacting regions from every chromosome of the female mice used in the experiment (Figure 3B and Supplementary Figure S4A). The total number of Ptpn22 interactions in FOXP3 expressing cells was lower than in FOXP3-negative T cells, but the chromosomal distribution was similar (Figure 3B and Supplementary Figure S4A). Approximately 35% of all Ptpn22-interactions were intra-chromosomal (Figure 3B), and the strongest peaks in all groups were found within a 2 Mb region centered around the Ptpn22 locus (Figure 4A and Supplementary Figure S4A). This is expected, as the frequency of both random and specific chromosomal interactions is inversely proportional to the distance between two genomic regions (42). Intra-chromosomal and inter-chromosomal interactions fell into both FOXP3-mediated and FOXP3-abrogated categories (Supplementary Figure S4A). In Foxp3-negative cells, the Ptpn22 locus was 5- to 10-fold more likely to engage in intrachromosomal interactions with genomic regions on chromosome 3 (312 intra- versus 30–60 inter-chromosomal, Supplementary Table S3), but the relative strength of each intra-chromosomal interaction (as measured by the average read density per contig, 660, Supplementary Table S3) was no greater than the average inter-chromosomal interaction. In Foxp3-expressing cells, the diversity of intra-chromosomal Ptpn22 interactions decreased 4-fold, from 312 to 79, but the relative strength of each intra-chromosomal interaction was increased 22-fold compared to intra-chromosomal Ptpn22 interactions in Foxp3-negative cells (14442 versus 661, Supplementary Table S3). These data indicate that the Ptpn22 locus engages in a complex array of both intra- and inter-chromosomal interactions with distal loci in conventional, Foxp3-negative T cells, and that the expression of FOXP3 drastically re-organizes and re-focuses the chromatin interaction patterns at this locus.
Figure 4.
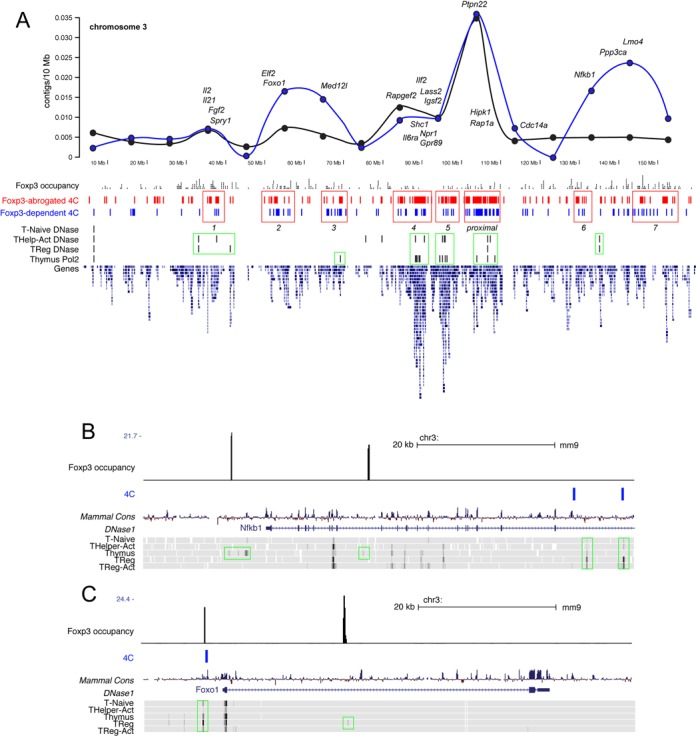
Distribution of intrachromosomal Ptpn22 interactions. (A) Full chromosome 3 contig frequencies are plotted (top panel) with the position of top FOXP3-dependent Ptpn22-interacting genes indicated. The distribution of all interactions (black line) versus the distribution of interactions involving direct Foxp3 target genes (determined by ChIP-seq, blue line) are shown. FOXP3 occupancy (black), and both FOXP3-abrogated (red) and FOXP3-mediated (blue) Ptpn22-interacting regions from this study are shown. DNase I hypersensitivity sites, RNA polymerase II occupancy and gene density from the ENCODE dataset are also depicted. (B) and (C) show examples of Foxp3 binding (black), Foxp3-dependent Ptpn22 interactions (blue) and coincident active chromatin signatures (DNase I HS, green boxes) at the NFκB1 and Foxo1 loci.
Another characteristic of FOXP3-regulated Ptpn22 interactions is that they tended to involve relatively gene-rich regions of chromosomes (Figure 4A), suggesting that FOXP3-driven chromosomal looping may be coupled to processes that regulate chromatin structure and transcription. To test this, we queried the ENCODE database (43) for the incidence of CTCF binding sites and DNase hypersensitivity sites within our defined Ptpn22-interacting regions, and found a strong correlation between FOXP3-dependent looping and active chromatin signatures. Approximately 25% of FOXP3-mediated and FOXP3-abrogated interactions occur within 5 kb of a binding site for CTCF (Supplementary Figure S4B), a factor that acts to tether chromatin loops in cells (44,45). There was also a close association between regions involved in Ptpn22 interactions and open chromatin (Figure 4A), with >40% of 4C peaks in both FOXP3-mediated and FOXP3-abrogated categories located within 500 bp of a T cell DNase hypersensitivity site, and 70% of interactions occurring within 5 kb of a DNase site (Supplementary Figure S4B). Examples of this co-localization can be observed among both intra- and interchromosomal interactions (Supplementary Figures S4 and S5, green and blue boxes). These examples also highlight a strong association between FOXP3-dependent chromosomal looping and histone modifications characteristic of regions poised for transcription—such as H3K4me3, H3K9ac, H3K27ac—as well as RNA pol II occupancy (green boxes in Supplementary Figures S4 and S5).
Indeed, we found that over half (53%) of all the 3296 identified Ptpn22-interactions were located within 10 kb of a gene, and were particularly enriched within exons and introns (Figure 3B, inset). For example, 338 of the 622 FOXP3-dependent interactions occurred at genes, and 731 of the 1272 FOXP3-abrogated interactions occurred nearby a gene. If these interactions were distributed randomly throughout the genome, <10% of PINTs (Ptpn22-interacting regions) would map to within these regions. In addition to being enriched within gene bodies, we found that >80% of looped regions contained at least one minimal consensus sequence for FOXP3 (5′-TGTTT-3′), with the average of four FOXP3 motifs per contacting region. This element density is nearly 3-fold higher than would be expected by random chance (1.6 motifs per region), and is consistent with genome-wide FOXP3 occupancy studies showing that 30–40% of FOXP3 binding sites are located within introns in Treg (14). These observations also suggest that multiple FOXP3-mediated bridges may be involved in the long-range interactions between a given genomic locus and the Ptpn22 target.
To confirm that FOXP3 directly targets the Ptpn22-interacting regions identified in this study, we performed a ChIP-seq analysis of Foxp3 occupancy in this same Foxp3-transduced T cell model and assessed the coincidence of Foxp3 binding sites and intra-chromosomal Ptpn22 interactions (on chromosome 3) in Foxp3 expressing cells. We found ∼450 binding sites across chromosome 3 (using a threshold of 30-fold enrichment over pre-ChIP libraries, and 10-fold over the Foxp3 ChIP signal in Foxp3-negative cells, Figure 4A and Supplementary Table S4). Foxp3 occupancy at over a dozen gene-proximal interacting regions (Ptpn22, Nfkb1, Ilf2, Lef1, Lass2, St3gal1, Eif4b, Rcn1, Usp33, Igsf2, Igsf3, Il21, Npr1, Lmo4, Cetn4, Il17r) from the top 10% 4C peaks enriched in FOXP3-expressing cells was validated by ChIP-qPCR. As expected, FOXP3 bound strongly to the endogenous Ptpn22 locus (Supplementary Figure S6A). In addition, FOXP3 exhibited >10-fold binding to 10 out of 14 Ptpn22-interacting regions, and greater than 3-fold binding to 13 out of 14 regions (Supplementary Figure S6A). We found that over 60% of Ptpn22-interacting contigs were within 100 kb (the relative resolution of this 4C technique) of a Foxp3 binding site (Supplementary Table S5). Examples of this overlap at the Nfkb1 and Foxo1 loci are shown in Figure 4B and C. Interestingly, an analysis of the intra-chromosomal distribution of the 4C contigs nearby a Foxp3 site shows marked clusters ∼30 Mb upstream and downstream of the Ptpn22 locus (Figure 4A, blue line). These data are consistent with a direct role for FOXP3 in the long-range interactions between Ptpn22 and specific genomic regions, which could be mediated by domain-swapping and/or through interactions with other factors.
Coordinated regulation of the expression of Ptpn22-interacting genes by FOXP3
To better understand how FOXP3 may coordinate gene expression through its ability to bridge two distal regions of DNA, we conducted gene ontogeny, pathway, and microarray expression analyses of genes involved in FOXP3-dependent Ptpn22 interactions. Our analyses indicate that interactions occurring specifically in the presence of FOXP3 were enriched for genes involved in epithelial development and differentiation, integrin signaling and actin polymerization, glucose and lipid metabolism, and regulation of the MAPK cascade (Supplementary Figure S7). These genes were more likely to be regulated by FOXP3 at the transcriptional level (Supplementary Table S2), as compared to FOXP3-abrogated genes, or as compared to genes interacting with Ptpn22 in a manner independent of FOXP3 (Supplementary Figure S7). This trend held up at both moderate (40% versus 20%) and stringent (20% versus 10%) differential expression thresholds (Supplementary Figure S7C). Those interactions specifically lost in FOXP3-expressing cells were enriched for genes involved in transcription, signal transduction, actin polymerization, proteolysis, and apoptosis (Figures 5 and 6, Supplementary Figure S8). These genes were also likely to be regulated by FOXP3 in T cells, as compared to those genes that interact with Ptpn22 in a FOXP3-independent manner (Figures 5 and 6). We chose 18 genes from the top Ptpn22-interacting regions enriched in FOXP3-expressing cells (Ptpn22, Nfkb1, Ilf2, Lef1, Lass2, St3gal1, Eif4b, Rcn1, Usp33, Igsf2, Igsf3, Il2, Il21, Npr1, Lmo4, Cetn4, Il17r, Lef1, H2dma) and assessed their expression in FOXP3-positive versus FOXP3-negative T cells by qRT-PCR. Expression of 15 of these 18 genes was significantly regulated either positively or negatively by FOXP3 (Supplementary Figure S6B), validating our microarray expression analysis.
Figure 5.
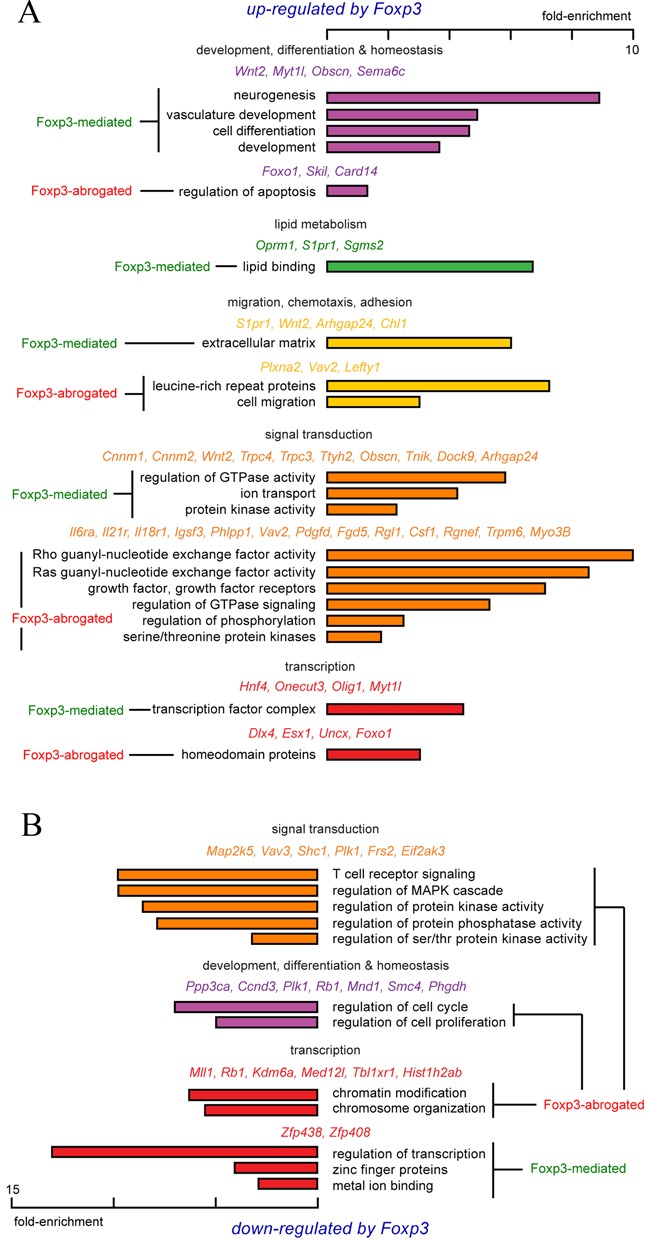
Functional annotation of genes involved in FOXP3-dependent Ptpn22 interactions. Differentially expressed gene were analyzed using the Database for Annotation, Visualization and Integrated Discovery (DAVID) (35). Enrichment scores reflect the increased representation of a given process or pathway within a gene set compared to a random sample. (A) FOXP3-repressed Ptpn22-interacting genes. (B) FOXP3-induced Ptpn22-interacting genes.
Figure 6.
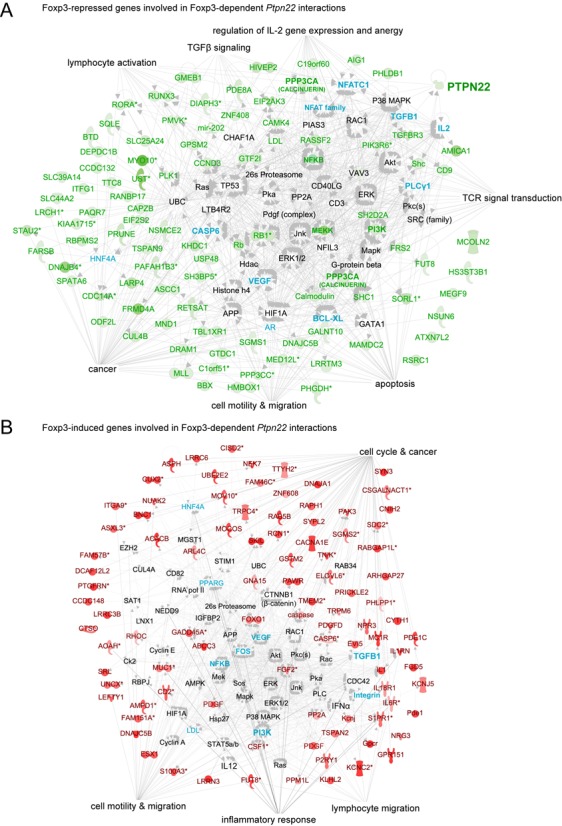
Pathway analysis of genes involved in FOXP3-dependent Ptpn22 interactions. Differentially expressed genes were subjected to Ingenuity pathway analysis. Green text and icons represent FOXP3-repressed Ptpn22-interacting genes, red text and icons represent FOXP3-induced Ptpn22-interacting genes. Genes in aqua are not involved in Ptpn22 interactions, but are regulated by FOXP3. (A) Foxp3-repressed genes involved in Foxp3-dependent Ptpn22 interactions. (B) Foxp3-induced gene involved in Foxp3-dependent Ptpn22 interactions.
A large number of Ptpn22-interacting genes are involved in TCR-coupled MAPK, PKC and PI3K activation, and are down-regulated by FOXP3 (Figures 5 and 6). Pathway analysis showed that these FOXP3-repressed, Ptpn22-interacting genes form a regulatory network surrounding ‘hubs’ consisting of PKA, CAMK/Calcineurin, MAPK, PI3K and Akt cascades. Many of the kinases and phosphatases in these cascades are themselves regulated by FOXP3, and lead to metabolic and transcriptional effectors such as HIF-1α, Caspase 6, Bcl-xL, HNF4A, β-catenin, androgen receptor, p53, NFAT and NFκB. The expression of these effectors also tends to be regulated by FOXP3 (green and aqua in Figure 6), as well as factors involved in cell cycle regulation (e.g. cyclin D3) and chromatin structure, including components of the Mediator complex (Med27), a major histone H3K4 methyltransferase (MLL1), an H3K27 demethylase (Kdm6a), components of transcription co-factor complexes (Ascc1 and Tbl1xr1), and histone H2A.
A separate set of FOXP3-dependent, Ptpn22-interacting genes are up-regulated by FOXP3, This set is highly enriched for genes involved in cellular differentiation (Wnt, Tgfb4 and Tgfbr3), lymphocyte migration (S1pr1, CD103), and cytokine receptor signal transduction (Igsf3, Sema6c, PHLPP1, Tnik, TGFβ4 and its receptor TGFβR3, and the receptors for IL-18, IL-6 and IL-21) (Figure 6 and Supplementary Figure S8). Pathway analysis suggested effects on the MAPK, PKC, PI3K cascades, apoptosis (Akt, FOXO1) and lipid metabolism (Pparγ). These results suggest that FOXP3 physically organizes the genome to promote the coordinated expression of factors involved in FOXP3 induction (FOXO1, PHLPP1, TGFβ4, TGFβR3), Treg homing (S1pr1, CD103), inflammatory sensing (semaphorins, plextrins, IL-18R, IL-6R, IL-21R), and function (Folr4, PPARγ), while also down-regulating factors that antagonize FOXP3 function (e.g. NFAT2, PI3K, HIF-1α) and drive pro-inflammatory pathways (PI3K, Shc, MEKK, NFκB) (Figure 6 and Supplementary Figure S8).
DISCUSSION
The forkhead transcription factor FOXP3 is required for regulatory T cell development and function. In addition, this factor is capable of reprogramming conventional, inflammatory CD4+ T cells into anti-inflammatory Treg. Our results indicate that FOXP3 induces global, large-scale 3D reorganization of the genome to coordinate gene regulation that confers the Treg phenotype. A prominent structural feature of the domain-swapped FOXP3 dimer is that the two DNA-binding surfaces are placed on the opposite faces of a well-folded protein body, and the two bound DNA fragments are arranged in an anti-parallel orientation (Figure 1). Thus, unlike most dimeric transcription factors (e.g. AP-1 and NF-κB) wherein the DNA binding surfaces of two monomers bind adjacent sites (46,47), the FOXP3 dimer cannot bind adjacent sites but instead prefer sites separated from each other. The distance between the two sites may be variable, as long as the intervening sequences could be looped out. This structural feature may explain why FOXP3, despite having a leucine zipper dimerization domain preceding the forkhead domain, does not bind adjacent dimeric sites, as suggested by genome wide analyses of FOXP3-binding sites in vivo (13,14). Our previous in-gel FRET studies have provided further evidence that the FOXP3 dimer can bring two distal FOXP3 sites into close approximation in solution (24). These structural and biochemical analyses suggest that a unique function of FOXP3 in transcription regulation is to mediate long-range interactions of FOXP3-targeted genes and regulatory elements. It has been increasingly recognized that long-range chromatin interactions play important roles in transcription regulation (48–53). However, the molecular bases of these long-range chromatin contacts have not been clear. Our studies here suggest a potential mechanism wherein oligomeric transcription factor complexes with multiple DNA binding domains bind distal sites to mediate long-range chromatin interactions.
Our 4C-seq analyses reveal that FOXP3 expression induces a drastic change in the chromosomal environment around the Ptpn22 locus. This change is characterized by the formation of new intra- and inter-chromosomal contacts as well as the elimination of preexisting contacts. ChIP-qPCR analyses indicate regions that are brought into contact with Ptpn22 locus are bound by FOXP3 in vivo and contain at least one FOXP3 binding site, suggesting that DNA bridging by the domain-swapped FOXP3 may play a direct role in at least some of the observed long-range chromatic interactions. Chromatin contacts that are abrogated upon FOXP3 expression may occur through complex mechanisms. For example, FOXP3-mediated interactions may physically compete with pre-existing interactions by volume exclusion or by the competition of binding sites between FOXP3 and other transcription factors (discussed further below)(54). The preexisting contact regions may also be actively brought to different chromatin regions by other yet unidentified mechanisms.
One functional role of FOXP3-mediated long-range chromatin interactions appears to coordinate the regulation of FOXP3 target genes. Our data are consistent with a model wherein FOXP3 physically organizes the genome to up-regulate the expression of factors that promote Treg function, while also down-regulating factors that antagonize Treg function. The fact that genes brought to Ptpn22 locus by FOXP3 expression can either be activated or repressed suggests that the chromosome environment surrounding the Ptpn22 locus may be further divided into active regions and repressed regions by a global analysis at higher resolution using the Hi-C or TCC approaches (51,55).
FOXP3 occupies thousands of sites in murine and human Tregs. While these data were taken to suggest that FOXP3 define Treg function in an ‘opportunistic’ manner by exploiting a preformed enhancer network (18), it is possible that after enhancer binding FOXP3 may operate through one or more active mechanisms. The fact that FOXP3 seems specialized for bridging long-distance genomic elements suggests that reorganization of the 3D structure of the T cell genome is an important aspect of the capacity of a transcription factor to define or stabilize cellular differentiation programs. For instance, the differentiation of naïve CD4+ T cell precursors into T helper 1 lineage cells is associated with large-scale changes in inter- and intra-chromosomal interactions at the Th1-specific effector cytokine gene Ifnγ, a process dependent upon the Th1 lineage transcription factor STAT4 (56).
Our studies reveal a complex 3D chromosomal architecture at the Ptpn22 locus, involving promiscuous interactions with hundreds of other loci in conventional (FOXP3-negative) CD4+ T cells. Ptpn22 is a known direct target of FOXP3, and we find that its interactome is influenced by FOXP3 in at least two different ways. FOXP3 can recruit intrachromosomal interactions from megabases away, as well as interactions involving sites located on other chromosomes, indicating that this transcription factor functions as a molecular organizer that modulates the 3D structure of the genome (Figure 7A). Recent studies indicate that most FOXP3-bound enhancer elements in Tregs are preoccupied by other factors in precursor FOXP3−CD4+ T cells, which share a similar DNase hypersensitivity map with the fully developed Treg cells (18). This activity raises the question of how such distant FOXP3 target sites find each other within the nuclear compartment. Does FOXP3 actively drive this reorganization? It is possible that FOXP3-driven transcription could recruit or create new transcription factories, which in turn promote looping through a recently described mechanism involving Mediator and cohesin interactions (57). Such a scenario is supported by our finding that over half of the FOXP3-dependent Ptpn22 chromosomal interactions occur at regions of the genome occupied by CTCF. Alternatively, FOXP3 may capture and stabilize otherwise rare interactions that occur at random between distant loci. Both these scenarios, and others, could be operative. Also, many of these long-range, FOXP3-dependent interactions cluster into regions consistent in scale with topologically associated domain (TAD) (53,55) (Figure 4A). In addition to organizing long-range and interchromosomal loops, FOXP3 focuses the associations within these TAD-scale clusters to a smaller number of interactions (Figure 7B & C) that specifically target FOXP3-regulated genes involved in Treg lineage differentiation and function. Consistent with this, we show that the Ptpn22 locus engages in a large number of ‘promiscuous’ interactions with other chromosomal regions in Foxp3-negative cells that are excluded when Foxp3 brings in its own set of interacting regions to the Ptpn22 locus. A similar restriction of promiscuous genomic interactions has also been observed at the Ifnγ gene upon differentiation of naïve CD4+ T cells into Th1 cells (56). Thus, focusing of chromosomal interactions around lineage-specific loci could represent a common mechanism by which lineage-specifying factors like FOXP3 function to program lineage differentiation.
Figure 7.
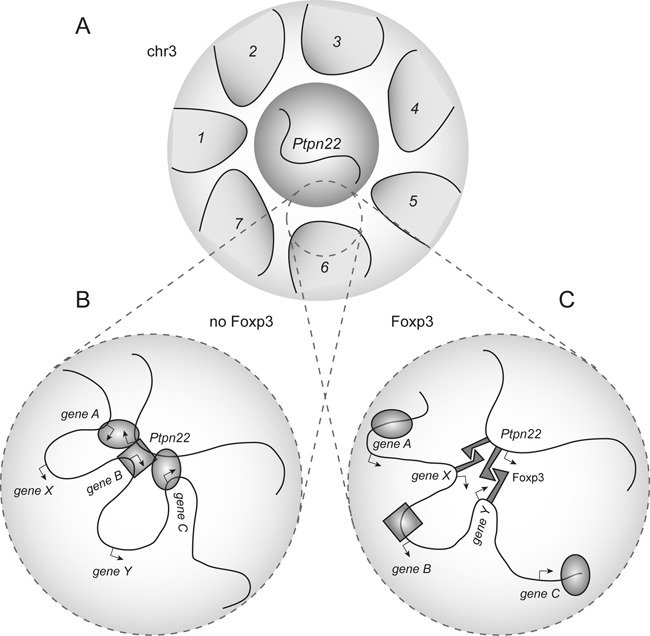
Coordinate regulation of target gene conformation and expression by FOXP3. Loops/domains in (A) represent the intrachromosomal clusters (1–7) of Ptpn22 interactions. In FOXP3-negative T cells (B), unknown factors coordinate a broad array of interactions with the Ptpn22 domain. In FOXP3-expressing cells (C), FOXP3 recruits distinct sets of genes within each domain/cluster to compete for access to the Ptpn22 locus, thereby focusing the interactome in favor of FOXP3 target genes.
ACCESSION NUMBERS
RCSB Protein Data Bank: coordinates and structural factors have been deposited under the accession code 4WK8. The complete dataset of 4C-seq reads has been deposited in SRA under accession numbers SRS794839 and SRS794865.
SUPPLEMENTARY DATA
Supplementary Data are available at NAR Online.
Acknowledgments
The authors thank ALS BCSB staff members Corie Ralston, Peter Zwart and Kevin Royal for help with data collection.
Footnotes
These authors contributed equally to the paper as first authors.
FUNDING
National Institutes of Health (NIH) [AI070807, AI073489 to A.D.W.]; NIH [GM064642 to L.C.]; National Natural Science Foundation of China [81372904, 81272971 to Y.C.]. Funding for open access charge: NIH [AI070807, AI073489 to A.D.W.]; NIH [GM064642 to L.C.].
Conflict of interest statement. None declared.
REFERENCES
- 1.Sakaguchi S., Yamaguchi T., Nomura T., Ono M. Regulatory T cells and immune tolerance. Cell. 2008;133:775–787. doi: 10.1016/j.cell.2008.05.009. [DOI] [PubMed] [Google Scholar]
- 2.Hori S., Nomura T., Sakaguchi S. Control of regulatory T cell development by the transcription factor Foxp3. Science. 2003;299:1057–1061. [PubMed] [Google Scholar]
- 3.Khattri R., Cox T., Yasayko S.A., Ramsdell F. An essential role for Scurfin in CD4+CD25+ T regulatory cells. Nat. Immunol. 2003;4:337–342. doi: 10.1038/ni909. [DOI] [PubMed] [Google Scholar]
- 4.Fontenot J.D., Gavin M.A., Rudensky A.Y. Foxp3 programs the development and function of CD4+CD25+ regulatory T cells. Nat. Immunol. 2003;4:330–336. doi: 10.1038/ni904. [DOI] [PubMed] [Google Scholar]
- 5.Chatila T.A., Blaeser F., Ho N., Lederman H.M., Voulgaropoulos C., Helms C., Bowcock A.M. JM2, encoding a fork head-related protein, is mutated in X-linked autoimmunity-allergic disregulation syndrome. J. Clin. Invest. 2000;106:R75–R81. doi: 10.1172/JCI11679. [DOI] [PMC free article] [PubMed] [Google Scholar]
- 6.Brunkow M.E., Jeffery E.W., Hjerrild K.A., Paeper B., Clark L.B., Yasayko S.A., Wilkinson J.E., Galas D., Ziegler S.F., Ramsdell F. Disruption of a new forkhead/winged-helix protein, scurfin, results in the fatal lymphoproliferative disorder of the scurfy mouse. Nat. Genet. 2001;27:68–73. doi: 10.1038/83784. [DOI] [PubMed] [Google Scholar]
- 7.Bennett C.L., Christie J., Ramsdell F., Brunkow M.E., Ferguson P.J., Whitesell L., Kelly T.E., Saulsbury F.T., Chance P.F., Ochs H.D. The immune dysregulation, polyendocrinopathy, enteropathy, X-linked syndrome (IPEX) is caused by mutations of FOXP3. Nat. Genet. 2001;27:20–21. doi: 10.1038/83713. [DOI] [PubMed] [Google Scholar]
- 8.Wildin R.S., Ramsdell F., Peake J., Faravelli F., Casanova J.L., Buist N., Levy-Lahad E., Mazzella M., Goulet O., Perroni L., et al. X-linked neonatal diabetes mellitus, enteropathy and endocrinopathy syndrome is the human equivalent of mouse scurfy. Nat. Genet. 2001;27:18–20. doi: 10.1038/83707. [DOI] [PubMed] [Google Scholar]
- 9.Williams L.M., Rudensky A.Y. Maintenance of the Foxp3-dependent developmental program in mature regulatory T cells requires continued expression of Foxp3. Nat. Immunol. 2007;8:277–284. doi: 10.1038/ni1437. [DOI] [PubMed] [Google Scholar]
- 10.Fontenot J.D., Rasmussen J.P., Williams L.M., Dooley J.L., Farr A.G., Rudensky A.Y. Regulatory T cell lineage specification by the forkhead transcription factor foxp3. Immunity. 2005;22:329–341. doi: 10.1016/j.immuni.2005.01.016. [DOI] [PubMed] [Google Scholar]
- 11.Allan S.E., Alstad A.N., Merindol N., Crellin N.K., Amendola M., Bacchetta R., Naldini L., Roncarolo M.G., Soudeyns H., Levings M.K. Generation of potent and stable human CD4+ T regulatory cells by activation-independent expression of FOXP3. Mol. Ther. 2008;16:194–202. doi: 10.1038/sj.mt.6300341. [DOI] [PubMed] [Google Scholar]
- 12.Wu Y., Borde M., Heissmeyer V., Feuerer M., Lapan A.D., Stroud J.C., Bates D.L., Guo L., Han A., Ziegler S.F., et al. FOXP3 controls regulatory T cell function through cooperation with NFAT. Cell. 2006;126:375–387. doi: 10.1016/j.cell.2006.05.042. [DOI] [PubMed] [Google Scholar]
- 13.Marson A., Kretschmer K., Frampton G.M., Jacobsen E.S., Polansky J.K., MacIsaac K.D., Levine S.S., Fraenkel E., von Boehmer H., Young R.A. Foxp3 occupancy and regulation of key target genes during T-cell stimulation. Nature. 2007;445:931–935. doi: 10.1038/nature05478. [DOI] [PMC free article] [PubMed] [Google Scholar]
- 14.Zheng Y., Josefowicz S.Z., Kas A., Chu T.T., Gavin M.A., Rudensky A.Y. Genome-wide analysis of Foxp3 target genes in developing and mature regulatory T cells. Nature. 2007;445:936–940. doi: 10.1038/nature05563. [DOI] [PubMed] [Google Scholar]
- 15.Sadlon T.J., Wilkinson B.G., Pederson S., Brown C.Y., Bresatz S., Gargett T., Melville E.L., Peng K., D'Andrea R.J., Glonek G.G., et al. Genome-wide identification of human FOXP3 target genes in natural regulatory T cells. J. Immunol. 2010;185:1071–1081. doi: 10.4049/jimmunol.1000082. [DOI] [PubMed] [Google Scholar]
- 16.Birzele F., Fauti T., Stahl H., Lenter M.C., Simon E., Knebel D., Weith A., Hildebrandt T., Mennerich D. Next-generation insights into regulatory T cells: expression profiling and FoxP3 occupancy in Human. Nucleic Acids Res. 2011;39:7946–7960. doi: 10.1093/nar/gkr444. [DOI] [PMC free article] [PubMed] [Google Scholar]
- 17.Jeron A., Hansen W., Ewert F., Buer J., Geffers R., Bruder D. ChIP-on-chip analysis identifies IL-22 as direct target gene of ectopically expressed FOXP3 transcription factor in human T cells. BMC Genomics. 2012;13:705. doi: 10.1186/1471-2164-13-705. [DOI] [PMC free article] [PubMed] [Google Scholar]
- 18.Samstein R.M., Arvey A., Josefowicz S.Z., Peng X., Reynolds A., Sandstrom R., Neph S., Sabo P., Kim J.M., Liao W., et al. Foxp3 exploits a pre-existent enhancer landscape for regulatory T cell lineage specification. Cell. 2012;151:153–166. doi: 10.1016/j.cell.2012.06.053. [DOI] [PMC free article] [PubMed] [Google Scholar]
- 19.Tian L., Altin J.A., Makaroff L.E., Franckaert D., Cook M.C., Goodnow C.C., Dooley J., Liston A. Foxp3(+) regulatory T cells exert asymmetric control over murine helper responses by inducing Th2 cell apoptosis. Blood. 2011;118:1845–1853. doi: 10.1182/blood-2011-04-346056. [DOI] [PMC free article] [PubMed] [Google Scholar]
- 20.Schubert L.A., Jeffery E., Zhang Y., Ramsdell F., Ziegler S.F. Scurfin (FOXP3) acts as a repressor of transcription and regulates T cell activation. J. Biol. Chem. 2001;276:37672–37679. doi: 10.1074/jbc.M104521200. [DOI] [PubMed] [Google Scholar]
- 21.Sugimoto N., Oida T., Hirota K., Nakamura K., Nomura T., Uchiyama T., Sakaguchi S. Foxp3-dependent and -independent molecules specific for CD25+CD4+ natural regulatory T cells revealed by DNA microarray analysis. Int. Immunol. 2006;18:1197–1209. doi: 10.1093/intimm/dxl060. [DOI] [PubMed] [Google Scholar]
- 22.Chen C., Rowell E.A., Thomas R.M., Hancock W.W., Wells A.D. Transcriptional regulation by Foxp3 is associated with direct promoter occupancy and modulation of histone acetylation. J. Biol. Chem. 2006;281:36828–36834. doi: 10.1074/jbc.M608848200. [DOI] [PubMed] [Google Scholar]
- 23.Stroud J.C., Wu Y., Bates D.L., Han A., Nowick K., Paabo S., Tong H., Chen L. Structure of the forkhead domain of FOXP2 bound to DNA. Structure. 2006;14:159–166. doi: 10.1016/j.str.2005.10.005. [DOI] [PubMed] [Google Scholar]
- 24.Bandukwala H.S., Wu Y., Feuerer M., Chen Y., Barboza B., Ghosh S., Stroud J.C., Benoist C., Mathis D., Rao A., et al. Structure of a domain-swapped FOXP3 dimer on DNA and its function in regulatory T cells. Immunity. 2011;34:479–491. doi: 10.1016/j.immuni.2011.02.017. [DOI] [PMC free article] [PubMed] [Google Scholar]
- 25.Tolhuis B., Palstra R.J., Splinter E., Grosveld F., de Laat W. Looping and interaction between hypersensitive sites in the active beta-globin locus. Mol. Cell. 2002;10:1453–1465. doi: 10.1016/s1097-2765(02)00781-5. [DOI] [PubMed] [Google Scholar]
- 26.Chen Y., Bates D.L., Dey R., Chen P.-H., Machado A.C., Laird-Offringa I.A., Rohs R., Chen L. DNA binding by GATA transcription factor suggests mechanisms of DNA looping and long-range gene regulation. Cell Rep. 2012;2:1197–1206. doi: 10.1016/j.celrep.2012.10.012. [DOI] [PMC free article] [PubMed] [Google Scholar]
- 27.Chen Y., Zhang X., Dantas Machado A.C., Ding Y., Chen Z., Qin P.Z., Rohs R., Chen L. Structure of p53 binding to the BAX response element reveals DNA unwinding and compression to accommodate base-pair insertion. Nucleic Acids Res. 2013;41:8368–8376. doi: 10.1093/nar/gkt584. [DOI] [PMC free article] [PubMed] [Google Scholar]
- 28.Otwinowski Z., Minor W. In: Methods in Enzymology. Carter CWJ, Sweet RM, editors. Vol. 276. NY: Academic Press; 1997. pp. 307–326. [DOI] [PubMed] [Google Scholar]
- 29.Brunger A.T., Adams P.D., Clore G.M., DeLano W.L., Gros P., Grosse-Kunstleve R.W., Jiang J.S., Kuszewski J., Nilges M., Pannu N.S., et al. Crystallography & NMR system: a new software suite for macromolecular structure determination. Acta Crystallogr. D Biol. Crystallogr. 1998;54:905–921. doi: 10.1107/s0907444998003254. [DOI] [PubMed] [Google Scholar]
- 30.CCP4. The CCP4 suite: programs for protein crystallography. Acta Crystallogr. D Biol. Crystallogr. 1994;50:760–763. doi: 10.1107/S0907444994003112. [DOI] [PubMed] [Google Scholar]
- 31.Adams P.D., Grosse-Kunstleve R.W., Hung L.W., Ioerger T.R., McCoy A.J., Moriarty N.W., Read R.J., Sacchettini J.C., Sauter N.K., Terwilliger T.C. PHENIX: building new software for automated crystallographic structure determination. Acta Crystallogr. D Biol. Crystallogr. 2002;58:1948–1954. doi: 10.1107/s0907444902016657. [DOI] [PubMed] [Google Scholar]
- 32.Emsley P., Lohkamp B., Scott W.G., Cowtan K. Features and development of Coot. Acta Crystallogr. D. 2010;66:486–501. doi: 10.1107/S0907444910007493. [DOI] [PMC free article] [PubMed] [Google Scholar]
- 33.Chunder N., Wang L., Chen C., Hancock W.W., Wells A.D. Cyclin-dependent kinase 2 controls peripheral immune tolerance. J. Immunol. 2012;189:5659–5666. doi: 10.4049/jimmunol.1202313. [DOI] [PMC free article] [PubMed] [Google Scholar]
- 34.Simonis M., Klous P., Splinter E., Moshkin Y., Willemsen R., de Wit E., van Steensel B., de Laat W. Nuclear organization of active and inactive chromatin domains uncovered by chromosome conformation capture-on-chip (4C) Nat. Genet. 2006;38:1348–1354. doi: 10.1038/ng1896. [DOI] [PubMed] [Google Scholar]
- 35.Huang da W., Sherman B.T., Lempicki R.A. Systematic and integrative analysis of large gene lists using DAVID bioinformatics resources. Nat. Protoc. 2009;4:44–57. doi: 10.1038/nprot.2008.211. [DOI] [PubMed] [Google Scholar]
- 36.Simonis M., Klous P., Homminga I., Galjaard R.J., Rijkers E.J., Grosveld F., Meijerink J.P., de Laat W. High-resolution identification of balanced and complex chromosomal rearrangements by 4C technology. Nat. Methods. 2009;6:837–842. doi: 10.1038/nmeth.1391. [DOI] [PubMed] [Google Scholar]
- 37.Wei C.L., Wu Q., Vega V.B., Chiu K.P., Ng P., Zhang T., Shahab A., Yong H.C., Fu Y., Weng Z., et al. A global map of p53 transcription-factor binding sites in the human genome. Cell. 2006;124:207–219. doi: 10.1016/j.cell.2005.10.043. [DOI] [PubMed] [Google Scholar]
- 38.Wurtele H., Chartrand P. Genome-wide scanning of HoxB1-associated loci in mouse ES cells using an open-ended Chromosome Conformation Capture methodology. Chromosome Res. 2006;14:477–495. doi: 10.1007/s10577-006-1075-0. [DOI] [PubMed] [Google Scholar]
- 39.Lomvardas S., Barnea G., Pisapia D.J., Mendelsohn M., Kirkland J., Axel R. Interchromosomal interactions and olfactory receptor choice. Cell. 2006;126:403–413. doi: 10.1016/j.cell.2006.06.035. [DOI] [PubMed] [Google Scholar]
- 40.Lio C.W., Hsieh C.S. A two-step process for thymic regulatory T cell development. Immunity. 2008;28:100–111. doi: 10.1016/j.immuni.2007.11.021. [DOI] [PMC free article] [PubMed] [Google Scholar]
- 41.Gavin M.A., Rasmussen J.P., Fontenot J.D., Vasta V., Manganiello V.C., Beavo J.A., Rudensky A.Y. Foxp3-dependent programme of regulatory T-cell differentiation. Nature. 2007;445:771–775. doi: 10.1038/nature05543. [DOI] [PubMed] [Google Scholar]
- 42.Sanyal A., Lajoie B.R., Jain G., Dekker J. The long-range interaction landscape of gene promoters. Nature. 2012;489:109–113. doi: 10.1038/nature11279. [DOI] [PMC free article] [PubMed] [Google Scholar]
- 43.Stamatoyannopoulos J.A., Snyder M., Hardison R., Ren B., Gingeras T., Gilbert D.M., Groudine M., Bender M., Kaul R., Canfield T., et al. An encyclopedia of mouse DNA elements (Mouse ENCODE) Genome Biol. 2012;13:418. doi: 10.1186/gb-2012-13-8-418. [DOI] [PMC free article] [PubMed] [Google Scholar]
- 44.Ling J.Q., Li T., Hu J.F., Vu T.H., Chen H.L., Qiu X.W., Cherry A.M., Hoffman A.R. CTCF mediates interchromosomal colocalization between Igf2/H19 and Wsb1/Nf1. Science. 2006;312:269–272. doi: 10.1126/science.1123191. [DOI] [PubMed] [Google Scholar]
- 45.Splinter E., Heath H., Kooren J., Palstra R.-J., Klous P., Grosveld F., Galjart N., de Laat W. CTCF mediates long-range chromatin looping and local histone modification in the β-globin locus. Genes Dev. 2006;20:2349–2354. doi: 10.1101/gad.399506. [DOI] [PMC free article] [PubMed] [Google Scholar]
- 46.Chen L., Glover J.N., Hogan P.G., Rao A., Harrison S.C. Structure of the DNA-binding domains from NFAT, Fos and Jun bound specifically to DNA. Nature. 1998;392:42–48. doi: 10.1038/32100. [DOI] [PubMed] [Google Scholar]
- 47.Giffin M.J., Stroud J.C., Bates D.L., von Koenig K.D., Hardin J., Chen L. Structure of NFAT1 bound as a dimer to the HIV-1 LTR kappa B element. Nat. Struct. Biol. 2003;10:800–806. doi: 10.1038/nsb981. [DOI] [PubMed] [Google Scholar]
- 48.Cremer M., von Hase J., Volm T., Brero A., Kreth G., Walter J., Fischer C., Solovei I., Cremer C., Cremer T. Non-random radial higher-order chromatin arrangements in nuclei of diploid human cells. Chromosome Res. 2001;9:541–567. doi: 10.1023/a:1012495201697. [DOI] [PubMed] [Google Scholar]
- 49.Jhunjhunwala S., van Zelm M.C., Peak M.M., Cutchin S., Riblet R., van Dongen J.J., Grosveld F.G., Knoch T.A., Murre C. The 3D structure of the immunoglobulin heavy-chain locus: implications for long-range genomic interactions. Cell. 2008;133:265–279. doi: 10.1016/j.cell.2008.03.024. [DOI] [PMC free article] [PubMed] [Google Scholar]
- 50.Dekker J., Rippe K., Dekker M., Kleckner N. Capturing chromosome conformation. Science. 2002;295:1306–1311. doi: 10.1126/science.1067799. [DOI] [PubMed] [Google Scholar]
- 51.Lieberman-Aiden E., van Berkum N.L., Williams L., Imakaev M., Ragoczy T., Telling A., Amit I., Lajoie B.R., Sabo P.J., Dorschner M.O., et al. Comprehensive mapping of long-range interactions reveals folding principles of the human genome. Science. 2009;326:289–293. doi: 10.1126/science.1181369. [DOI] [PMC free article] [PubMed] [Google Scholar]
- 52.Spilianakis C.G., Flavell R.A. Long-range intrachromosomal interactions in the T helper type 2 cytokine locus. Nat. Immunol. 2004;5:1017–1027. doi: 10.1038/ni1115. [DOI] [PubMed] [Google Scholar]
- 53.Dixon J.R., Selvaraj S., Yue F., Kim A., Li Y., Shen Y., Hu M., Liu J.S., Ren B. Topological domains in mammalian genomes identified by analysis of chromatin interactions. Nature. 2012;485:376–380. doi: 10.1038/nature11082. [DOI] [PMC free article] [PubMed] [Google Scholar]
- 54.Tjong H., Gong K., Chen L., Alber F. Physical tethering and volume exclusion determine higher-order genome organization in budding yeast. Genome Res. 2012;22:1295–1305. doi: 10.1101/gr.129437.111. [DOI] [PMC free article] [PubMed] [Google Scholar]
- 55.Kalhor R., Tjong H., Jayathilaka N., Alber F., Chen L. Genome architectures revealed by tethered chromosome conformation capture and population-based modeling. Nat. Biotechnol. 2011;30:90–98. doi: 10.1038/nbt.2057. [DOI] [PMC free article] [PubMed] [Google Scholar]
- 56.Hakim O., Sung M.H., Nakayamada S., Voss T.C., Baek S., Hager G.L. Spatial congregation of STAT binding directs selective nuclear architecture during T-cell functional differentiation. Genome Res. 2013;23:462–472. doi: 10.1101/gr.147652.112. [DOI] [PMC free article] [PubMed] [Google Scholar]
- 57.Kagey M.H., Newman J.J., Bilodeau S., Zhan Y., Orlando D.A., van Berkum N.L., Ebmeier C.C., Goossens J., Rahl P.B., Levine S.S., et al. Mediator and cohesin connect gene expression and chromatin architecture. Nature. 2010;467:430–435. doi: 10.1038/nature09380. [DOI] [PMC free article] [PubMed] [Google Scholar]
Associated Data
This section collects any data citations, data availability statements, or supplementary materials included in this article.