Abstract
Background:
Precise and accurate measurements of body composition are useful in achieving a greater understanding of human energy metabolism in physiology and in different clinical conditions, such as, cardiovascular disease and overall mortality. Dual-energy x-ray absorptiometry (DXA) can be used to measure body composition, but the easiest method to assess body composition is the use of anthropometric indices. This study has been designed to evaluate the accuracy and precision of body composition prediction equations by various anthropometric measures instead of a whole body DXA scan.
Materials and Methods:
We identified 143 adult patients underwent DXA evaluation of the whole body. The anthropometric indices were also measured. Datasets were split randomly into two parts. Multiple regression analysis with a backward stepwise elimination procedure was used as the derivation set and then the estimates were compared with the actual measurements from the whole-body scans for a validation set. The SPSS version 20 for Windows software was used in multiple regression and data analysis.
Results:
Using multiple linear regression analyses, the best equation for predicting the whole-body fat mass (R2 = 0.808) included the body mass index (BMI) and gender; the best equation for predicting whole-body lean mass (R2 = 0.780) included BMI, WC, gender, and age; and the best equation for predicting trunk fat mass (R2 = 0.759) included BMI, WC, and gender.
Conclusions:
Combinations of anthropometric measurements predict whole-body lean mass and trunk fat mass better than any of these single anthropometric indices. Therefore, the findings of the present study may be used to verify the results in patients with various diseases or diets.
Keywords: Anthropometry, body composition, dual-energy x-ray absorptiometry
INTRODUCTION
Overweight and obesity in Iran, like other countries, is epidemic.[1] Excess body fat and obesity are a metabolic disorder characterized by increased whole body fat and are associated with a greater risk of hypertension, diabetes, coronary heart disease, and cancer – all major health concerns in developed and developing countries.[2,3] Obesity is generally defined by using the body mass index (BMI), which does not distinguish between the lean and fat components of body weight.[4] In addition, some anthropometric measures and indices such as waist circumference (WC), waist-to-height ratio (WHtR), hip circumference (HC), and waist-to-hip ratio (WHR) are also suggested as better indicators of obesity, as compared to BMI.[5] These anthropometric measurements have been instrumental in monitoring the obesity epidemic, as well as linking the obesity status with an increased risk for cardiovascular disease, type 2 diabetes, and mortality.[6,7]
Computed tomography (CT) and magnetic resonance imaging (MRI) are considered the gold standards for assessing central fat distribution, but their cost and radiation dose (in case of CT) is high. In contrast, dual-energy x-ray absorptiometry (DXA) is a relatively simple technique for evaluating total and regional adiposity.[8] This expedient technique involves the subjects lying on a scan platform for about five minutes, as an x-ray source and detector move over the body in a rectilinear motion. Although the DXA cannot distinguish between intra-abdominal and subcutaneous fat, research in adults showed strong correlations between trunk fat mass measured with DXA and intra-abdominal fat measured with CT or MRI.[9] There is an increasing interest to specifically estimate the whole-body lean mass, as it may better reflect the body protein reserves and nutritional status in disease and aging. Whole-body lean mass loss is a process associated with aging as well as with several diseases.[10] Furthermore, DXA has been validated against MRI to predict the whole-body lean mass.[11]
Most of the previous studies have concentrated on the prediction of whole-body fat mass with anthropometric indices. In this study we focus on the prediction of whole-body fat mass, whole-body lean mass, and trunk fat mass with anthropometric indices. Additionally, relatively little data on the prediction of whole-body fat mass, whole-body lean mass, and trunk fat mass with anthropometric indices has been investigated in the Iranian population.
Therefore, the present investigation is undertaken to predict the relationship of the various anthropometric measures with the composition variables for the whole body (whole-body fat mass, whole-body lean mass, trunk fat mass).
MATERIALS AND METHODS
Study population
This is a cross-sectional study comprised of 143 men and women, who were referred to the Osteoporosis Diagnosis and Body Composition Center for DXA scans, from April to October 2013. A questionnaire was given to obtain the subject's information on age, gender, medical history, family history, physical activity, alcohol use, dietary habits, and smoking history, under the supervision of clinicians. Men and women who reported chronic medical conditions and smokers were excluded. Also children and athletes were excluded from this study. This study was approved by the Health Research Ethics Board in Isfahan University of Medical Science.
Dual-energy x-ray absorptiometry measurements
Dual-energy x-ray absorptiometry scans of the whole body composition, that is, whole-body fat mass, whole-body lean mass, and trunk fat mass were measured using a Norland Model XR-800 scanner and analyzed with Norland Illuminatus DXA 4.4.0. The instrument was calibrated daily with the manufacturer's calibration standard. DXA provides precise measurements of body composition in humans. With the participant lying in a supine position on a padded table, an X-ray beam passes in a posterior-to-anterior direction through the bone and soft tissue upward to a detector. DXA uses a constant potential x-ray source (100 KV) and a K-edge filter (46.8 KeV) to generate two main energy peaks (40 KeV and 70 KeV). The ratio of the x-ray beam attenuation at the lower energy relative to that at the higher energy is used to distinguish fat from the fat-free mass (minus the bone component). The DXA trunk fat mass was determined from a region extending from the shoulders to the top of the iliac crest with the arms excluded, while using the whole body bone and body composition analysis.[12]
Anthropometry
Body weight (kilograms) was measured with the participants wearing light indoor clothing on an electronic balance accurate to 0.1 kg. Height without shoes was measured to the nearest 0.5 cm with a measuring tape. BMI was calculated as the quotient of weight over height squared (kilograms per meter squared). The WC was measured with a flexible and inelastic tape at the end of a normal expiration, taking care not to compress the tissues. The waist circumference was measured at the smallest circumference between the thorax and the hips. The hip circumference was measured at the largest circumference of the trochanters with a flexible and inelastic tape. The waist-to-height (WHtR) ratio was calculated using the equation: WHtR = WC (cm)/height (cm). Waist-to-hip ratio (WHR) was calculated by the equation: WHR = WC (cm)/HC (cm).
Statistical analysis
The data sets were split randomly into two parts, the derivation set included a sample of 100 subjects, to develop prediction equations, and the validation set including a sample of 43 subjects, to validate these equations. Multiple linear regression analysis was conducted to estimate prediction equations using the derivation set. Each of the dependent variables, whole-body fat mass, whole-body lean mass, and trunk fat mass were regressed on the predictor variables, BMI, WC, HC, gender, and age. The backward stepwise elimination procedure was applied to find a reasonable subset of predictor variables. Prediction models were also developed for BMI, WC, and HC alone, with the gender variable. The adjusted R2 (coefficient of determination) and SSE (error some of squares) criteria were applied to compare the regression models. Using prediction equations, estimates for whole-body fat mass, whole-body lean mass, and trunk fat mass were calculated for the validation set, and the observed and predicted values were compared. SPSS version 20 was used for data analysis.
RESULTS
Table 1 shows the descriptive characteristics of the derivation (n = 100) and validation (n = 43) sets. On the basis of the Independent student's t-test for continuous variables and Chi-square test for categorical variables, there were no significant differences between the variables in the two sets (P > 0.05). Table 2 denotes Pearson correlation coefficients between each of the dependent variables (whole-body fat mass, whole-body lean mass, and trunk fat mass) and continuous predictor variables in all subjects. As shown in Table 2, the highest correlation coefficient was between the whole-body fat mass and trunk fat mass, with BMI, but the linear relationship between BMI and whole-body lean mass was less than the height and weight. There were no evident differences of correlations between height and weight with the whole-body lean mass. Table 3 shows the results of multiple regression models by using the backward stepwise elimination procedure for the derivation set. The prediction equations for the whole-body fat mass, whole-body lean mass, and trunk fat mass are given below:
Table 1.
Characteristics of studied subjects
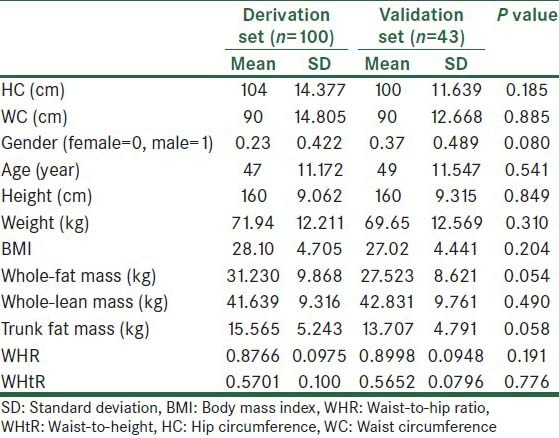
Table 2.
Pearson's correlation coefficients for all subjects
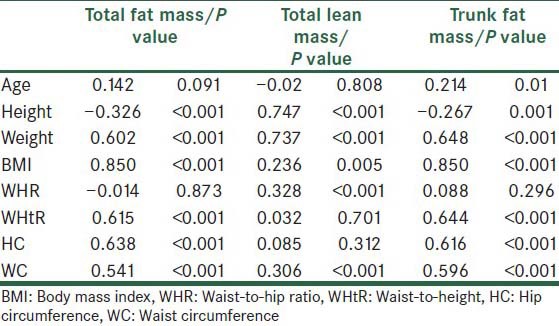
Table 3.
Result of multiple regression analysis with backward stepwise elimination procedure for the derivation set
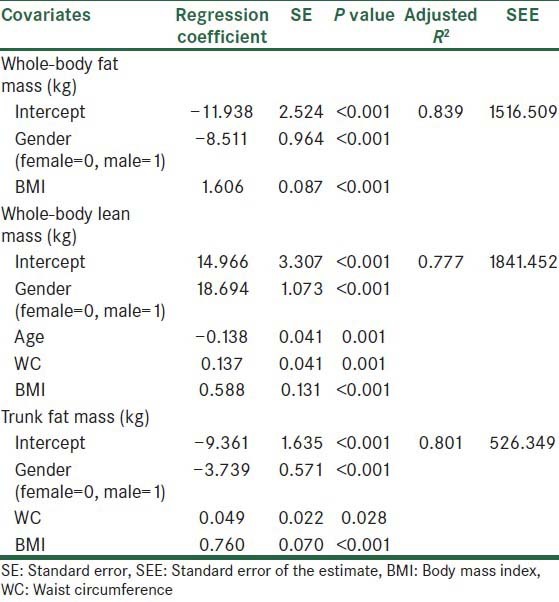
Whole-body fat mass (kg) = – 11.938 + 1.606 *BMI − 8.511*Gender R2 =0.839
Whole-body lean mass (kg) = +14.966 + 0.588 *BMI + 18.694*Gender + 0.137*WC – 0.138*Age R2 =0.777
Trunk fat mass (kg) = – 9.361 + 0.760*BMI - 3.739 *Gender + 0.049*WC R2 =0.801
Stepwise procedures led to the selection of gender and BMI for the whole-body fat mass, four variables (gender, age, WC, and BMI) for whole-body lean mass, and three variables (gender, WC, and BMI) for the trunk fat mass. Hence, several models using each of the anthropometric variables to predict body composition were defined. Table 4 compares prediction models using the adjusted R2 and SSE criteria for the validation set. The best model for predicting the whole-body fat mass is a combination of gender and BMI, with adjusted R2 = 0.808 and SEE = 585.28. The best model for predicting the whole-body lean mass is a combination of gender, BMI, WC, and age, with adjusted R2 = 0.780 and SEE = 818.88, and the best model for predicting trunk fat mass variables is a combination of gender, BMI, and WC, with adjusted R2 = 0.759 and SEE = 226.59. Figure 1 denotes a high agreement between the observed and predicted values for the validation set.
Table 4.
Comparison of model performance in the validation set
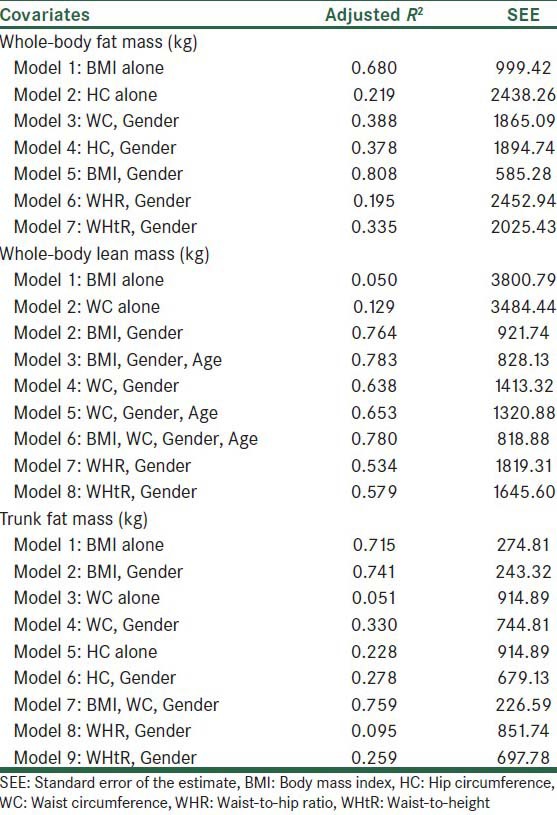
Figure 1.
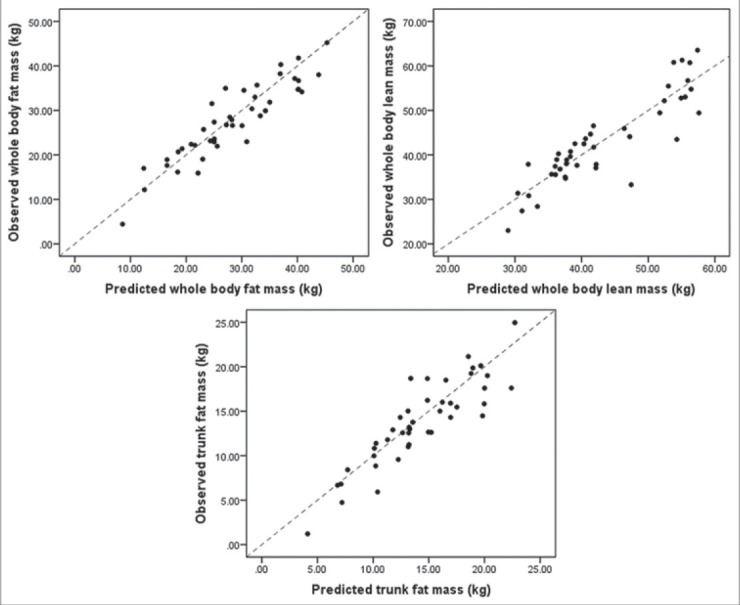
Plots of correlation between the predicted and observed values for the whole-body fat mass, whole-body lean mass, and trunk fat mass for the validation data set
DISCUSSION
Dual-energy x-ray absorptiometry-derived body compositions can in turn be used to predict overall mortality and cardiovascular-related deaths.[13] Precise and accurate measurements of body composition are useful in achieving a greater understanding of human energy metabolism in physiology and in different clinical conditions, as also in evaluating interventions.[14] Direct measures of body composition are currently impractical for widespread use in screening, for general health and fitness standards. The easiest method to assess obesity and risk of cardiovascular heart disease is by using anthropometric indices. Waist and hip circumferences are used to define the pattern of obesity.[9] Mortality risk is increased among those with BMI > 25.0 kg/m2, and is greatly elevated among those with BMI exceeding 30.0 kg/m2.[15] In a recent research, BMI compared to other anthropometric variables was a better single indicator for predicting body composition.[16] In this study we have demonstrated that BMI is the best single anthropometric predictor of whole-body fat mass (adjusted R2 = 0.680 and SEE = 999.42) and trunk fat mass (adjusted R2 = 0.715 and SEE = 274.81), with regard to gender. Recent studies indicate that BMI may incorrectly classify risk in children and athletes (who are excluded in this study).[17] Hence, further research is needed to show the effect of BMI in predicting body composition for these particular groups. Also further research is needed to test the hypothesis that racial/ethnic differences exist in both men and women in the relationship of anthropometric measures of body composition. Even though HC, WC, WHtR, and WHR may be useful to evaluate fat distribution,[18] the prediction equation using these indices is poor in predicting whole-body fat mass and trunk fat mass. Similarly, when the anthropometric indices are used alone, R2 is low. Therefore, the anthropometric indices are combined and a single prediction equation is developed for all subjects.
A decrease in the SEE and/or increase in the R2 is obtained by using more than one index, so the combination of anthropometric measurements can predict body compositions better than any of these single variables. The accuracy of predicting the body composition by using a combination of anthropometric indices is higher than when using BMI alone. Although some investigators have used age as a variable in body composition equations,[13] the present results suggest that age is just a representative indicator for the whole-body lean mass.
In conclusion, this study has been designed to evaluate the accuracy and precision of body composition prediction equations. The results of this study show that the new anthropometric prediction equations, validated against DXA, can be used to predict whole body composition. Thus, we now allow the determination of body composition accurately by an easy, portable, and inexpensive method. Furthermore, the results of this study suggest that gender has an important effect on influencing the correlations of body composition and the studied anthropometric indices. Also a combination of anthropometric measurements can predict the whole-body lean mass and trunk fat mass better than any of these single anthropometric indices. Therefore, further studies using anthropometric indices to predict body composition values in samples from across the country is recommended.
Footnotes
Source of Support: This study was supported by the Isfahan University of Medical Sciences
Conflict of Interest: None declared.
REFERENCES
- 1.Chen ZA, Roy K, Gotway Crawford CA. Obesity prevention: The impact of local health departments. Health Serv Res. 2013;48:603–27. doi: 10.1111/j.1475-6773.2012.01447.x. [DOI] [PMC free article] [PubMed] [Google Scholar]
- 2.Hodge AM, Zimmet PZ. 5 The epidemiology of obesity. Baillieres Clin Endocrinol Metab. 1994;8:577–99. doi: 10.1016/s0950-351x(05)80287-3. [DOI] [PubMed] [Google Scholar]
- 3.Pongchaiyakul C, Kosulwat V, Rojroongwasinkul N, Charoenkiatkul S, Thepsuthammarat K, Laopaiboon M, et al. Prediction of percentage body fat in rural thai population using simple anthropometric measurements. Obes Res. 2005;13:729–38. doi: 10.1038/oby.2005.82. [DOI] [PubMed] [Google Scholar]
- 4.Leslie WD, Weiler HA, Nyomba BL. Ethnic differences in adiposity and body composition: The First Nations bone health study. Appl Physiol Nutr Metab. 2007;32:1065–72. doi: 10.1139/H07-068. [DOI] [PubMed] [Google Scholar]
- 5.Lee CM, Huxley RR, Wildman RP, Woodward M. Indices of abdominal obesity are better discriminators of cardiovascular risk factors than BMI: A meta-analysis. J Clin Epidemiol. 2008;61:646–53. doi: 10.1016/j.jclinepi.2007.08.012. [DOI] [PubMed] [Google Scholar]
- 6.Bajaj HS, Brennan DM, Hoogwerf BJ, Doshi KB, Kashyap SR. Clinical Utility of Waist Circumference in Predicting All-cause Mortality in a Preventive Cardiology Clinic Population: A PreCIS Database Study. Obesity. 2009;17:1615–20. doi: 10.1038/oby.2009.44. [DOI] [PubMed] [Google Scholar]
- 7.Camhi SM, Bray GA, Bouchard C, Greenway FL, Johnson WD, Newton RL, et al. The relationship of waist circumference and BMI to visceral, subcutaneous, and total body fat: Sex and race differences. Obesity (Silver Spring) 2010;19:402–8. doi: 10.1038/oby.2010.248. [DOI] [PMC free article] [PubMed] [Google Scholar]
- 8.Goulding A, Taylor RW, Gold E, Lewis-Barned NJ. Regional body fat distribution in relation to pubertal stage: A dual-energy X-ray absorptiometry study of New Zealand girls and young women. Am J Clin Nutr. 1996;64:546–51. doi: 10.1093/ajcn/64.4.546. [DOI] [PubMed] [Google Scholar]
- 9.Taylor RW, Jones IE, Williams SM, Goulding A. Evaluation of waist circumference, waist-to-hip ratio, and the conicity index as screening tools for high trunk fat mass, as measured by dual-energy X-ray absorptiometry, in children aged 3-19 yr. Am J Clin Nutr. 2000;72:490–5. doi: 10.1093/ajcn/72.2.490. [DOI] [PubMed] [Google Scholar]
- 10.Kyle U, Genton L, Hans D, Pichard C. Validation of a bioelectrical impedance analysis equation to predict appendicular skeletal muscle mass (ASMM) Clin Nutr. 2003;22:537–43. doi: 10.1016/s0261-5614(03)00048-7. [DOI] [PubMed] [Google Scholar]
- 11.Kim J, Heshka S, Gallagher D, Kotler DP, Mayer L, Albu J, et al. Intermuscular adipose tissue-free skeletal muscle mass: Estimation by dual-energy X-ray absorptiometry in adults. J Appl Physiol. 2004;97:655–60. doi: 10.1152/japplphysiol.00260.2004. [DOI] [PubMed] [Google Scholar]
- 12.Clasey JL, Bouchard C, Teates CD, Riblett JE, Thorner MO, Hartman ML, et al. The Use of Anthropometric and Dual-Energy X-ray Absorptiometry (DXA) Measures to Estimate Total Abdominal and Abdominal Visceral Fat in Men and Women. Obes Res. 1999;7:256–64. doi: 10.1002/j.1550-8528.1999.tb00404.x. [DOI] [PubMed] [Google Scholar]
- 13.Leslie WD. Prediction of body composition from spine and hip bone densitometry. J Clin Densitom. 2009;12:428–33. doi: 10.1016/j.jocd.2009.06.002. [DOI] [PubMed] [Google Scholar]
- 14.Albanese CV, Diessel E, Genant HK. Clinical applications of body composition measurements using DXA. J Clin Densitom. 2003;6:75–85. doi: 10.1385/jcd:6:2:75. [DOI] [PubMed] [Google Scholar]
- 15.LaForgia J, Dollman J, Dale MJ, Withers RT, Hill AM. Validation of DXA body composition estimates in obese men and women. Obesity (Silver Spring) 2009;17:821–6. doi: 10.1038/oby.2008.595. [DOI] [PubMed] [Google Scholar]
- 16.Lei S, Liu M, Chen X, Deng F, Lv J, Jian W, et al. Relationship of total body fatness and five anthropometric indices in Chinese aged 20-40 years: Different effects of age and gender. Eur J Clin Nutr. 2005;60:511–8. doi: 10.1038/sj.ejcn.1602345. [DOI] [PubMed] [Google Scholar]
- 17.Litwin SE. Which measures of obesity best predict cardiovascular risk? J Am Coll Cardiol. 2008;52:616–9. doi: 10.1016/j.jacc.2008.05.017. [DOI] [PubMed] [Google Scholar]
- 18.Taylor RW, Brooking L, Williams SM, Manning PJ, Sutherland WH, Coppell KJ, et al. Body mass index and waist circumference cutoffs to define obesity in indigenous New Zealanders. Am J Clin Nutr. 2010;92:390–7. doi: 10.3945/ajcn.2010.29317. [DOI] [PubMed] [Google Scholar]


