

Abstract
Vibrio cholerae O1 is a major cause of acute watery diarrhea in over 50 countries. Evidence suggests that V. cholerae O1 may activate inflammatory pathways, and a recent study of a Bangladeshi population showed that variants in innate immune genes play a role in mediating susceptibility to cholera. We analyzed human proteins present in the small intestine of patients infected with V. cholerae O1 to characterize the host response to this pathogen. We collected duodenal biopsy specimens from patients with acute cholera after stabilization and again 30 days after initial presentation. Peptides extracted from biopsy specimens were sequenced and quantified using label-free mass spectrometry and SEQUEST. Twenty-seven host proteins were differentially abundant between the acute and convalescent stages of infection; the majority of these have known roles in innate defense, cytokine production, and apoptosis. Immunostaining confirmed that two proteins, WARS and S100A8, were more abundant in lamina propria cells during the acute stage of cholera. Analysis of the differentially abundant proteins revealed the activation of key regulators of inflammation by the innate immune system, including Toll-like receptor 4, nuclear factor kappa-light-chain-enhancer of activated B cells, mitogen-activated protein kinases, and caspase-dependent inflammasomes. Interleukin-12β (IL-12β) was a regulator of several proteins that were activated during cholera, and we confirmed that IL-12β was produced by lymphocytes recovered from duodenal biopsy specimens of cholera patients. Our study shows that a broad inflammatory response is generated in the gut early after onset of cholera, which may be critical in the development of long-term mucosal immunity against V. cholerae O1.
INTRODUCTION
Vibrio cholerae O1, which causes 3 to 5 million cases of cholera annually, is a noninvasive pathogen that does not penetrate the intestinal mucosa of human hosts (1, 2). Cholera is considered a prototypical, noninflammatory diarrheal illness, and there are no gross changes in the integrity of mucosal tissue during V. cholerae O1 infection (2, 3). However, there is mounting evidence that V. cholerae O1 triggers inflammatory responses in the gut (2, 4, 5). Studies of duodenal tissue extracted from cholera patients indicate that V. cholerae O1 infection causes upregulation of innate host defenses in the intestinal mucosa, including neutrophil-derived antibacterial proteins, proinflammatory cytokines, and BPIFB1 (also known as LPLUNC1), which is an immune-modifying defense protein that may attenuate the host response to bacterial lipopolysaccharide (LPS) (4–6). A candidate gene study showed that a variant in the promoter region of LPLUNC1 is associated with cholera susceptibility in a population in Bangladesh, an area where cholera is an ancient disease (7).
Genome-wide association studies also underscore the importance of the innate immune system in influencing the clinical manifestations of V. cholerae O1 infection (8). A recent analysis of signals of natural selection in individuals from the Ganges River Delta in Bangladesh revealed strong selection for a network of coexpressed genes linked to inhibitor of nuclear factor kappa-B kinase subunit gamma (IKBKG, also known as NEMO). IKBKG is the regulatory component of the IκB (IKK) kinase complex, which is required for activation of the nuclear factor kappa-light-chain-enhancer of activated B cells (NF-κB) complex (8). The NF-κB complex, in turn, is the major transcriptional regulator of genes involved in the innate immune response, with roles that include cytokine and free radical production, as well as the immune response to stress and bacterial antigens (9, 10). The genomic variants associated with cholera susceptibility were not central mediators of inflammatory pathways but, rather, were found primarily in regulatory genes that modulate these pathways, suggesting that selection acted on peripheral components of fundamental pathways.
Several in vitro studies have identified specific inflammatory pathways and cytokines that are activated by V. cholerae. The bacteria stimulate mouse macrophages via Toll-like receptor 4 (TLR4), which triggers the interferon beta (IFN-β) signaling pathway and cleavage of caspase-11 (11). Caspase-11 (caspase-4 in humans) cleaves caspase-1, which is part of the NOD-like receptor family pyrin domain-containing 3 (NLRP3) inflammasome and is responsible for activating inflammatory cytokines such as interleukin 1β (IL-1β), a potent mediator of cellular apoptosis (11, 12). Intriguingly, cholera toxin (CT) also activates the caspase-1-dependent NLRP3 inflammasome in vitro (8). CT is known as a potent immunoadjuvant that stimulates maturation of mouse dendritic cells; this enhances antigen presentation to CD4+ T cells and induces nuclear translocation of NF-κB (13). CT causes constitutive activation of G-protein-coupled membrane receptors, which induces cyclic AMP (cAMP) production and activates p38 mitogen-activated protein kinase (p38 MAPK), a kinase that controls apoptosis and cellular responses to cytokines (14–16).
The infant mouse model has been utilized to study the inflammatory response induced by V. cholerae infection. Neutrophil recruitment plays a role in controlling the spread of V. cholerae to extraintestinal organs during infection of mice (17, 18). Furthermore, V. cholerae infection induces production of inflammatory cytokines and chemokines in the mouse gut, such as nitric oxide (NO), IL-6, and IL-17A; this response was reduced in V. cholerae strains lacking CT (18). Murine and cell culture models have been useful for determining the role of NLRP3, NF-κB, and proinflammatory cytokines in mediating the inflammatory response to V. cholerae; however, given the disparity between human and mouse inflammasome regulation (19, 20) and the fact that murine models do not fully replicate the clinical manifestation of cholera (21), these models may be insufficient for understanding the human innate immune response in cholera patients.
For this study, we used a discovery-based, label-free proteomic approach to characterize the human innate immune response directly at the mucosal surface during cholera. We collected duodenal biopsy specimens from cholera patients during acute illness and again 28 days later during convalescence. We then examined differentially regulated proteins and pathways to identify key innate immune responses to V. cholerae O1 infection directly in human tissue. Our results confirmed activation of a number of innate immune signaling pathways during acute-phase cholera, including pathways involved in TLR4 signal transduction, NF-κB activation, p38 MAPK signaling, and regulation of the acute-phase defense response. We also identified potentially novel components of the immune response to V. cholerae O1, including regulators of NF-κB and a tryptophanyl tRNA synthetase (WARS) that is activated in response to inflammatory cytokines. These results represent the first direct proteomic analysis of innate responses to V. cholerae O1 in human tissue and may contribute to a more complete understanding of how long-lived mucosal immunity to V. cholerae O1 is generated.
MATERIALS AND METHODS
Participant enrollment and collection of duodenal biopsy specimens.
Study participants were recruited from among adult cholera patients admitted to the International Centre for Diarrhoael Disease Research in Dhaka, Bangladesh (icddr,b). Patients without underlying medical conditions and with a screening history, physical examination, and laboratory studies for diseases other than cholera were eligible for inclusion. All patients were screened for intestinal parasites and were negative. Microbiological tests confirmed that all patients were infected with V. cholerae O1 El Tor Ogawa. Patients were treated with intravenous rehydration and antibiotic therapy (azithromycin or ciprofloxacin) prior to enrollment. Esophagogastroduodenoscopy was performed on study participants on the day after hospital admission and after clinical stabilization (day 2); five to six pinch biopsy specimens were obtained from the second part of the duodenum and ranged in weight from 40 to 120 mg. Of these, one pinch biopsy specimen was snap-frozen in liquid nitrogen immediately following collection and stored at −80°C until the analysis described here was carried out, and one piece was paraffin preserved in sections on microscope slides. Endoscopy was repeated 28 days (day 30) following presentation, and a similar set of samples was obtained. Due to destructive sampling of the biopsy specimens used for proteomic analysis, duodenal pinch biopsy specimens used for lamina propria lymphocyte extraction and cytokine measurement were obtained from adult cholera patients enrolled in a separate study (4); these patients were within a similar age range as those used in the proteomic analysis (22 to 45 years), were from unplanned urban areas of similar socioeconomic status, and were infected with V. cholerae O1 El Tor Ogawa. Specimens obtained from five healthy individuals with asymptomatic Helicobacter pylori infection, who enrolled in a separate study, were included as controls for this analysis. These individuals were healthy volunteers from an unplanned urban area with demographic patterns similar to those observed in cholera patients and with no history of diarrhea during the previous 1 month. We obtained human subject approval for this study from the icddr,b and Massachusetts General Hospital (MGH)-Partners Healthcare.
Sample preparation and LC-MS/MS analysis.
Samples were prepared for liquid chromatography-tandem mass spectrometry (LC-MS/MS) as described previously (22, 23). Briefly, samples (10 μg) were ground in a reducing solution (8 M urea, 2% sodium dodecyl sulfate, 150 mM ammonium bicarbonate, and 10 mM dithiothreitol), alkylated with 40 mM iodoacetamide, and quenched with 10 mM dithiothreitol (DTT) prior to SDS-PAGE. Gels were fixed and stained with SimplyBlue SafeStain (Life Technologies, Grand Island, NY) before fragmentation into equal sections. Proteins were digested in gel with 6.6 μg/ml trypsin (ThermoFisher Scientific, Waltham, MA). Peptides were extracted from each gel section, lyophilized, and dissolved in loading buffer (5% acetonitrile–0.1% formic acid) in preparation for LC-MS/MS analysis on an LTQ Orbitrap Velos mass spectrometer (MS) (ThermoFisher Scientific, Waltham, MA). For liquid chromatography, samples were injected into a Thermo Scientific Easy nano-LC (nLC) system configured with a 10-cm by 100-μm trap column and a 25-cm by 100-μm (inside diameter [i.d.]) resolving column. Samples were loaded at 4 μl/min for 10 min, and a gradient (0 to 45%) of buffer (90% acetonitrile, 0.2% formic acid) was run over 130 min at 375 nl/min, for a total run time of 150 min. The MS was run in a standard top-10 data-dependent configuration to obtain precursor spectra (i.e., the 10 most intense peaks/peptide ions from the MS spectra are selected for a tandem MS analysis, or MS2), except that a stringent trigger threshold (20,000 signal-to-noise ratio) was used to ensure that the MS2 did not interfere with the full-scan MS run. MS2 fragmentation and analysis were performed in an ion trap mass analyzer. Retention time standards (ThermoFisher Scientific, Waltham, MA) were used to assess column performance and control for cross-contamination.
Peptide identification.
Peptide identifications were made using SEQUEST through the Proteome Discoverer, version 1.4 (ThermoFisher Scientific, Waltham, MA). MS precursor spectra were searched with a 10-ppm mass tolerance window and a 0.25-Da tolerance window for the fragmented peptide ions. A reverse database strategy was employed to match peptide sequences to human proteins: human peptide sequences were reversed and concatenated with the forward sequences, which were supplemented with common contaminants and filtered to obtain a false discovery rate less than or equal to 1%.
Comparative proteomics.
To identify differences in protein abundance between acute-phase cholera (day 2 samples) versus late-phase convalescence (day 30 samples), protein spectral count (PSC) data were normalized by dividing the raw PSC for an individual protein by the total PSCs generated from within that sample. Zero values were replaced with 1 to avoid fallacies related to division by zero. Log2 ratios were calculated for individual proteins across all eight patients as follows: log2 ratio = log2 (normalized day 2 PSC/normalized day 30 PSC). To determine differences between day 2 and day 30 PSCs, Student's t tests were performed using mean PSCs over all eight patients (Prism, San Diego, CA). We focused our subsequent analyses on proteins with a P value of <0.05.
IPA.
The proteomic data set, which included NCBI GeneInfo (GI) identifiers, log2 ratios, and P values for each identified protein, was input into Ingenuity Pathway Analysis (IPA) using the core analysis platform (Ingenuity Systems, Redwood City, CA). The core analysis matched proteins in our data set with those in the Ingenuity Knowledge Base, created molecular networks, divided the data into biological functions that were over represented in the data set, and determined overrepresented canonical pathways; unmapped proteins were excluded from further analysis. The core analysis was performed using default settings: direct and indirect relationships between molecules supported by experimentally observed data were considered, networks did not exceed 35 molecules, and all sources of data from human, mouse, and rat studies in the Ingenuity Knowledge Base were considered. A cutoff log2 ratio of >1.0 and <−1.0 (2-fold change in abundance) and a P value cutoff of 0.05 were applied. This generated priority lists for enriched molecular networks, biological functions, canonical pathways, differentially abundant proteins, and predicted upstream regulators. Each network was scored based on the number of mapped proteins in the network, its size, the number of mapped proteins in the data set, and the number of proteins in the Ingenuity Knowledge Base that could be included in the network. Score values were calculated from hypergeometric distribution and right-tailed Fisher's exact test. IPA also predicted potential upstream regulators of the proteins in our data set, which were designated activated or inhibited based on a Z-score, a statistical measurement of differential expression based on the log2 ratio, the P value, and the statistical effect size.
Immunostaining and image analysis.
Serial sections (5 μm) of paraffin-preserved tissue sections were used for immunohistochemical (IHC) and immunofluorescence (IF) analysis. Immunostaining was performed on biopsy specimens taken from three (IHC) or two (IF) patients during acute-phase cholera (day 2) and convalescence (day 30). Briefly, slides were deparaffinized with xylene and graded ethanol and then blocked with dual endogenous enzyme block (DEEB) 5′ (Dako). Slides were incubated with 1:500 diluted rabbit monoclonal anti-WARS antibody (GTX62563; GeneTex) or 1:5,000 diluted rabbit polyclonal anti-S100A8 antibody (HPA024372; Sigma). For IHC, the slides were incubated with the secondary antibody EnVision 1 anti-rabbit/horseradish peroxidase polymer (Dako), and color was developed using 3,3-diaminobenzidine, with hematoxylin used as a counterstain. For IF, the slides were incubated with Alexa Fluor 488-streptavidin (Molecular Probes), rinsed in phosphate-buffered saline (PBS), blocked with rabbit serum, and then incubated with 1:500 dilutions of either goat anti-CD11b antibody (sc-6612; Santa Cruz) (a surface marker expressed on monocytes, granulocytes, macrophages, and natural killer cells), mouse anti-CD15 antibody (NBP2-22179; Novus) (a surface marker expressed on neutrophils), or mouse anti-KRT18 antibody (ab118817; Abcam) (a marker expressed on epithelial cells). Slides were then incubated with biotinylated rabbit anti-goat IgG antibody (Vector Laboratories), rinsed with PBS, and incubated with streptavidin-Cy3 (Molecular Probes). Slides were counterstained with 4′,6′-diamidino-2-phenylindole (DAPI; Life Technologies). For IHC image analysis, slides were examined using an Olympus BX43 microscope at ×100 total magnification, and images were captured with an Olympus DP21 digital RGB camera. To determine differences in target abundance between day 2 and day 30 specimens, the IHC images were processed using ImageJ (NIH Research Services Branch). Colors were deconvoluted into red (protein target), blue (tissue), and white (background) images, which were then inverted to grayscale and converted to binary images. Binary images were subjected to a watershed analysis to better separate individual particles, and the area of each particle was calculated. Ratios of red area (protein target) to blue area (tissue) were calculated for each sample, and a two-way analysis of variance (ANOVA) with Tukey's honest significant difference (HSD) post hoc test was used to determine significant differences in target abundance between day 2 and day 30 images (significance, P < 0.05). For IF image analysis, 12-bit images captured with the TissueFAXS slide scanning system were analyzed using TissueQuest software (TissueGnostics, Vienna, Austria). We quantified both the total number of cells based on the number of DAPI-positive nuclei and the number of cells showing Alexa Fluor 488 (KRT18+, CD11b+, or CD15+) and Cy3 (WARS+ or S100A8+) fluorescence above a particular background threshold. In brief, DAPI-positive nuclei were segmented using an algorithm that quantifies the intensity of pixels over the area of the nuclei and creates a mask distinguishing each nucleus. Then, for Alexa Fluor 488 and Cy3 signals, we defined regions of a particular radius (25 μm) so that the software would address an area beyond the boundary of the nucleus for fluorescence above a certain background intensity level. Fluorescence signals representing the respective markers were plotted against the nuclear DAPI signal and against each other to create two-dimensional (2D) scattergrams. Only positive signals associated with cells defined by DAPI-positive nuclei were included in the quantification. Populations of Alexa Fluor 488 (green fluorescent protein [GFP])- and Cy3 (red fluorescent protein [RFP])-positive cells could be further characterized by first thresholding for known levels of positive fluorescence based on controls and gating for single- or double-stained populations representing the cells of interest.
LPL cultures and cytokine measurement.
Lamina propria lymphocytes (LPLs) were extracted from duodenal biopsy specimens, as described previously (4). Briefly, day 2, day 30, and control specimens were washed in PBS and Hanks' balanced salts solution (HBSS; Gibco), followed by incubation at 37°C in 5% CO2 with EDTA (1 mM) and dithiothreitol (1 mM) with gentle vortexing. To isolate the intraepithelial fraction, supernatants were pooled, filtered through nylon mesh, washed, and cultured in RPMI medium with 100 U/ml of collagenase and 0.1 mg/ml DNase (C0255 and D5025, respectively; Sigma) for 2 h at 37°C. This cell suspension was again filtered through nylon mesh cloth, and the LPL fraction was cultured in 24-well plates (BD Biosciences) in RPMI medium at 37°C in 5% CO2 for 5 days, resulting in 5 × 10⁴ to 5 × 10⁵ cells per culture. The cytokine IL-12β (p40) was measured in the culture supernatant using a Milliplex human cytokine kit according to the manufacturer's instructions (Millipore Corp., Billerica, MA).
RESULTS
Patient characteristics.
Eight patients with cholera were included in this study; five healthy individuals with asymptomatic Helicobacter pylori infection were also included. The median age of the patient cohort and the healthy cohort was 27 years (range, 22 to 44 years) and 30 years (range, 22 to 45 years), respectively; all participants were male. Cholera patients presented to the International Centre for Diarrheal Disease Research Hospital in Dhaka, Bangladesh (icddr,b), 12 to 24 h after the development of acute watery diarrhea with severe dehydration. Microbiological tests confirmed that all patients were infected with V. cholerae O1 El Tor Ogawa.
Proteomic analysis of duodenal biopsy specimens demonstrates activation of innate immune effectors during acute cholera.
A total of 4,612 proteins were identified in the eight paired acute- and convalescent-phase samples based on protein spectral count (PSC) (see Data Set S1 in the supplemental material). The human genome encodes roughly 20,500 proteins (24); therefore, our proteomic data set represented approximately 20% of the predicted human proteome. A heat map representation of proteins showing differential abundance between the acute and convalescent phases suggests that there was substantial variation in the host response to V. cholerae O1 infection (Fig. 1) between the patients enrolled in our study. However, a Spearman correlation with bootstrapping analysis did not identify statistically significant clusters among the patient responses (data not shown). We also measured vibriocidal antibody titers in patient sera collected 2 days (acute stage), 7 days, and 30 days (convalescent stage) after infection (Table 1). We used two-way ANOVA and Tukey’s multiple-comparison test to determine whether there was any significant variation in vibriocidal response between patients; this analysis showed that there was no significant difference in vibriocidal titer between any of the patients for each day that vibriocidal titer was measured (F = 1.87, df = 7, P = 0.1511). Therefore, despite the heterogeneity of responses between patients, all patient proteomes were grouped in subsequent analyses without clustering.
FIG 1.

A heat map representing color-coded log2 ratios of 112 differentially abundant proteins (>2.4-fold change) in biopsy specimens recovered from eight patients (P1 to P8) during acute-phase cholera (day 2) and convalescence (day 30). Specific proteins, represented as gene symbols, were included in the map if the average log2 ratio was greater than 0.6 across all eight patients, with no P value cutoff. Log2 ratios were calculated using normalized protein spectral counts from day 2 and day 30 proteomic data sets. Red hues, log2 ratios of >0; blue hues, log2 ratios <0. Variations in color intensities across the patient samples suggests that there were different patterns of response to V. cholerae O1 infection.
TABLE 1.
Vibriocidal antibody titers in patient sera collected 2 days (acute stage), 7 days, and 30 days (convalescent stage) after infection with V. cholerae O1 El Tor Ogawa
| Vibriocidal titer (Ogawa) on day: |
|||||
|---|---|---|---|---|---|
| Patient no. | Age (yr) | Blood type | 2 | 7 | 30 |
| 1 | 35 | O+ | 5 | 640 | 160 |
| 2 | 25 | O+ | 20 | 5,120 | 1,280 |
| 3 | 27 | O+ | 20 | 5,120 | 2,560 |
| 4 | 44 | O+ | 80 | 1,280 | 640 |
| 5 | 22 | O+ | 5 | 2,560 | 1,280 |
| 6 | 26 | A+ | 5 | 5,120 | 2,560 |
| 7 | 28 | O+ | 40 | 10,240 | 2,560 |
| 8 | 27 | O+ | 320 | 10,240 | 2,560 |
Within this data set, 51 proteins had a log2 ratio that corresponded to a mean ≥2-fold change in abundance between the acute and convalescent phases of cholera (see Data Set S2 in the supplemental material): 24 proteins were more abundant, and 27 were less abundant during acute-phase cholera. Of these 51 proteins, 26 were significantly different (P < 0.05) between acute-phase cholera and convalescence in all eight patients; these are shown in Table 2. Levels of one additional protein, lactotransferrin (LTF), were significantly different (P < 0.05) in six of the eight patients.
TABLE 2.
Differentially abundant proteins identified in comparative proteomic analysisa
| Gene group and GI no. | Gene symbol | Protein description | Avg log2 ratio | P valueb |
|---|---|---|---|---|
| Genes abundant during acute-phase cholera | ||||
| 38455402 | LCN2 | Neutrophil gelatinase-associated lipocalin | 2.19 | 0.0038 |
| 47419918 | WARS | Tryptophanyl-tRNA synthetase, cytoplasmic | 2.18 | 0.0046 |
| 4758146 | DEFA1 | Neutrophil defensin 1 | 1.93 | 0.0017 |
| 21614544 | S100A8 | Protein S100-A8 | 1.82 | 0.0037 |
| 24041029 | NOS2 | Nitric oxide synthase, inducible | 1.51 | 0.0132 |
| 4557759 | MPO | Myeloperoxidase | 1.45 | 0.0152 |
| 110611220 | RRBP1 | Ribosome-binding protein 1 | 1.32 | 0.0219 |
| 4506773 | S100A9 | Protein S100-A9 | 1.30 | 0.0295 |
| 32313593 | OLFM4 | Olfactomedin-4 | 1.30 | 0.0241 |
| 207452735 | EPPK1 | Epiplakin | 1.26 | 0.0377 |
| 19920317 | CKAP4 | Cytoskeleton-associated protein 4 | 1.06 | 0.0328 |
| 47458820 | STAT3 | Signal transducer and activator of transcription 3 | 1.04 | 0.0327 |
| Genes abundant during convalescent-phase cholera | ||||
| 158937236 | NPEPPS | Puromycin-sensitive aminopeptidase | −1.02 | 0.0482 |
| 32130518 | APOC2 | Apolipoprotein C-II | −1.07 | 0.0198 |
| 209862837 | EPHX1 | Epoxide hydrolase 1 | −1.11 | 0.0010 |
| 22091454 | GSTA1 | Glutathione S-transferase A1 | −1.14 | 0.0022 |
| 4502693 | CD9 | CD9 antigen | −1.24 | 0.0059 |
| 4505621 | PEBP1 | Phosphatidylethanolamine-binding protein 1 | −1.28 | 0.0414 |
| 4506147 | PRSS2 | Trypsin-2 | −1.31 | 0.0021 |
| 4557809 | OAT | Ornithine aminotransferase, mitochondrial | −1.42 | 0.0389 |
| 221316699 | MGAM | Maltase-glucoamylase, intestinal | −1.46 | 0.0400 |
| 31542986 | ITLN1 | Intelectin-1 | −1.62 | 0.0258 |
| 4501901 | ACY1 | Aminoacylase-1 | −1.63 | 0.0058 |
| 4557735 | MAOA | Amine oxidase | −1.80 | 0.0558 |
| 157364974 | SI | Sucrase-isomaltase, intestinal | −1.82 | 0.0117 |
| 281485550 | FBN1 | Fibrillin-1 | −2.04 | 0.0580 |
A cutoff of a log2 ratio of >1.0 and <−1.0 was used with a cutoff P value of <0.05.
P values were generated by Student's t test.
We used the Gene Ontology (GO) annotation of biological processes to broadly define the role of each of the 26 differentially abundant proteins. Of these 26 proteins, 14 participate in the innate immune response; 9 of these proteins were increased in abundance during acute-phase cholera, and 5 were decreased (Table 3). Specifically, they are known to be activated in response to lipopolysaccharide (LCN2, S100A8, S100A9, and nitric oxide synthase 2 [NOS2]), toxins (GSTA1, EPHX1, MAOA, LCN2, APOC2, and S100A8), and oxidative stress (CD9, GSTA1, LCN2, NOS2, and myeloperoxidase [MPO]). Many are involved in the inflammatory response (S100A8, S100A9, NOS2, and FBN1) and regulate NF-κB signaling (S100A8, S100A9, and OLFM4). Several enriched proteins are known effectors proteins of innate immunity at the mucosal surface that help to control the spread of infectious agents via leukocyte cell endocytosis (NOS2, APOC2, and OLFM4), chemotaxis (DEFA1, S100A8, and S100A9), or extravasation (OLFM4). Ion transport and iron sequestration proteins were also enriched (LCN2, S100A8, and S100A9). The remaining 12 differentially abundant proteins are involved in gene expression, protein metabolism and translation, cellular organization, and starch metabolism.
TABLE 3.
Predicted biological processes, according to Gene Ontology annotation, for differentially abundant proteins recovered from biopsy specimens taken during acute-phase cholera and convalescence
| Biological process | GO annotation number(s)a | Protein(s) in data set |
|---|---|---|
| Innate immune response and host interactions | GO:0045087, GO:0002227, GO:0052572, GO:0051701, GO:0044130, GO:0019048, GO:0050777 | DEFA1, S100A8, S100A9, NOS2, MPO, OLFM4 |
| Defense response to infectious agents (e.g., bacteria and viruses) | GO:0042742, GO:0009615, GO:0050832, GO:0031640, GO:0050829, GO:0051712, GO:0002679, GO:0006952, GO:0001878, GO:0001912, GO:0002149, GO:0009267 | DEFA1, S100A8, S100A9, NOS2, MPO |
| Cytokine production and regulation | GO:0001816, GO:0001817, GO:0032680, GO:0071347, GO:0071356, GO:0032602, GO:0071346, GO:0001960, GO:0030514, GO:0035582 | S100A8, S100A9, NOS2, FBN1 |
| NF-κB regulation | GO:0043123, GO:0051092, GO:0043124 | S100A8, S100A9, OLFM4 |
| Ion transport and regulation (e.g., iron and calcium) | GO:0006826, GO:0033214, GO:0006811, GO:0015891, GO:0032119, GO:0010043, GO:0055074, GO:0051592, GO:0010524, GO:0051480, GO:0048554, GO:0006874, GO:0006816 | LCN2, S100A8, S100A9 |
| Response to lipopolysaccharide | GO:0031665, GO:0071222, GO:0032496 | LCN2, S100A8, S100A9, NOS2 |
| Regulation of endocytosis and phagocytosis | GO:0090382, GO:0048261, GO:0070836, GO:0050764 | NOS2, APOC2, OLFM4 |
| Posttranslational modification | GO:0071902, GO:0033138, GO:0018119, GO:0031397, GO:0042524, GO:0033137, GO:0001934 | NOS2, ITLN1 |
| Gene expression and regulation | GO:0006351, GO:0010628, GO:0010467, GO:0010629, GO:0000398, GO:0008380, GO:0000122, GO:0006355 | NOS2, STAT3, CKAP4 |
| Apoptosis | GO:0006915, GO:0042981, GO:0006919, GO:2001244, GO:0043066, GO:0097190, GO:2001238 | LCN2, S100A8, S100A9, MPO, OLFM4 |
| Response to oxidative/cellular stress | GO:0070301, GO:0001666, GO:0006801, GO:0006979, GO:0019430, GO:0042744, GO:0071455, GO:0009414, GO:0006749 | LCN2, NOS2, MPO, CD9, GSTA1 |
| Cellular organization | GO:0031346, GO:0051493, GO:0006914, GO:0016050, GO:0030198, GO:0022617, GO:0030198, GO:0031532, GO:0005856 | LCN2, S100A8, S100A9, FBN1, EPPK1 |
| Response to drugs/toxins | GO:0042493, GO:0009635, GO:0009636, GO:0045471, GO:0019439, GO:0014070, GO:0042178, GO:0006805 | LCN2, APOC2, EPHX1, S100A8, S100A9, MAOA, GSTA1 |
| Protein translation, folding, and transport | GO:0070207, GO:0006412, GO:0006436, GO:0006418, GO:0051260, GO:0051289, GO:0034214, GO:0015031 | LCN2, WARS, OAT, RRBP1, OLFM4 |
| Cellular proliferation/differentiation | GO:0008285, GO:0030307, GO:0042127, GO:0030154, GO:0001523, GO:0090090, GO:0030857, GO:2000286, GO:0090263, GO:0051899, GO:0008285, GO:0030307, GO:0030855 | WARS, S100A8, S100A9, NOS2, APOC2, CD9, GSTA1 |
| Blood coagulation and vessel formation/dilation | GO:0045765, GO:0001525, GO:0045909, GO:0045907, GO:0045776, GO:0007596, GO:0001570, GO:0002931, GO:0006940, GO:0042310, GO:0001937, GO:0030193, GO:0002576, GO:0030168 | WARS, NOS2, CD9 |
| Leukocyte chemotaxis and extravasation | GO:0006935, GO:0002523, GO:0070488, GO:0030593, GO:0030595, GO:0050900, GO:2000389 | DEFA1, S100A8, S100A9, OLFM4 |
| Inflammatory response | GO:0002526, GO:0050729, GO:0006954, GO:0002544, GO:0050729 | S100A8, S100A9, NOS2 |
| Protein metabolism/catabolism | GO:0042177, GO:0006527, GO:0006749, GO:0000096, GO:0052547, GO:0030574, GO:0006508, GO:0008652, GO:0055129, GO:0030574, GO:0006576, GO:0010466 | NOS2, OAT, ACY1, MAOA, NPEPPS, PEBP1 |
| G protein activation | GO:0031284, GO:0072584 | NOS2 |
| Nitric oxide biosynthesis and regulation | GO:0007263, GO:0006809, GO:0051001, GO:0046209, GO:0045019, GO:0050999 | NOS2 |
| Cellular metabolism/catabolism | GO:0043457, GO:0044237, GO:0008152, GO:0055114, GO:0034641, GO:0009056 | NOS2, MPO, OAT, OLFM4, GSTA1 |
| Cholesterol metabolism, modification, and transport | GO:0034374, GO:0034372, GO:0034370, GO:0010916, GO:0010902, GO:0051006, GO:0034384, GO:0042953, GO:0042157, GO:0032375, GO:0033344, GO:0043691, GO:0042632, GO:0030301, GO:0034371, GO:0034382 | MPO, APOC2 |
| Lipid biosynthesis and metabolism | GO:0045833, GO:007032, GO:0045723, GO:0010898, GO:0033700, GO:0016042, GO:0060697, GO:0010518, GO:0006641, GO:0019217, GO:0019915 | APOC2 |
| Small-molecule metabolism | GO:0044281 | APOC2, OAT, MGAM, MAOA, SI, GSTA1 |
| Cell adhesion | GO:0007155, GO:0045785 | CD9, OLFM4 |
| Starch metabolism | GO:0005983, GO:0044245, GO:0005975, GO:0046326, GO:0044245 | MGAM, ITLN1, SI |
| Signal transduction | GO:0007165 | S100A9, STAT3 |
| Cell-cell signaling | GO:0007267, GO:0045113 | S100A9 |
| Cell spreading and migration | GO:1900026 | OLFM4 |
Gene Ontology (GO) Consortium (http://www.geneontology.org/).
Immunostaining confirms the increased expression of S100A8 and WARS in lamina propria cells during acute-stage cholera.
We chose to investigate expression of S100A8, a calcium/zinc binding calprotectin protein, because of its role in mediating NF-κB responses, cytokine production, and neutrophil recruitment. The specific role of S100A8 in cholera pathogenesis is unknown, yet it averaged a 3.6-fold higher abundance during acute-phase cholera than convalescence (P = 3.70E-03). We also investigated expression of WARS, a tryptophanyl-tRNA synthetase, in biopsy specimens collected from cholera patients. The involvement of WARS in cholera pathogenesis is also unknown, yet its involvement in the early immune response is implicated by its activation in response to interferon (IFN) and its 4.4-fold-higher abundance in acute-phase cholera biopsy specimens (P = 4.60E-03). We used immunohistochemistry (IHC) to verify the differential expression of these two selected proteins and immunofluorescence (IF) to assess cell-specific expression of each within the lamina propria.
IHC staining for S100A8 in acute-phase cholera biopsy specimens revealed its accumulation in lymphoid cells in the lamina propria (area ratio of S100A8 to whole tissue, 0.04 ± 0.02). As expected, it was relatively absent from the lamina propria cellular population in the convalescent stage (area ratio of S100A8 to whole tissue, 3.80E−0.3 ± 1.91E−04) (n = 3, P = 0.03) (Fig. 2A and B). The IF staining for S100A8 in acute biopsy specimens showed that ∼2.6% of the lamina propria population contained this protein, and additional staining with innate immune cell markers showed localization of S100A8 in CD15+ cells (neutrophils) (Fig. 3A and B), which represented approximately 1% of the lamina propria population in the acute-phase sample and 0.05% in the convalescent-phase sample. S100A8 was also detected in CD11b+ cells (monocytes, granulocytes, macrophages, and/or natural killer cells) (Fig. 3C and D). Additionally, we confirmed that S100A8 and CD15+ cells were significantly absent from the lamina propria cellular population in convalescent biopsy specimens using IF staining (n = 2, P < 0.01).
FIG 2.

Images (magnification, ×100) showing immunohistochemistry (IHC) of target protein expression (red) in paraffin-preserved duodenal biopsy tissue (blue). IHC of S100A8 in acute-phase cholera (A) and convalescent-phase (B) biopsy specimens. S100A8 accumulated in the nuclei of several lymphoid cells in the lamina propria (LP) and was significantly absent from the LP cellular population in the convalescent stage (P = 0.032). IHC of WARS in acute-phase cholera (C) and convalescent-phase (D) biopsy specimens. During acute-phase cholera, WARS accumulated in nearly every cell in the LP except for in epithelial cells, and the presence of WARS was reduced during convalescence (P = 0.023).
FIG 3.

Images (magnification, ×100) showing immunofluorescence (IF) of target protein expression (red) relative to all nuclei (blue) in paraffin-preserved duodenal biopsy tissue extracted during acute-phase cholera (left images) and the convalescence phase (right images). In acute-phase cholera biopsy specimens (A), S100A8 (red) was present in the nuclei of CD15+ cells (green), which were likely neutrophils, whereas in convalescent-phase biopsy specimens (B), the abundances of S100A8-positive and CD15+ cells were significantly reduced (P < 0.05). (C) WARS (red) was detected prominently in nearly every cell in the lamina propria (blue) but was less prominent in KRT18+ cells (green), epithelial cells. (D) WARS abundance was reduced in convalescent-phase biopsy specimens (P < 0.05). S100A8 (red) was also present in the nuclei of CD11b+ cells (green), which were likely macrophages (E), and both cellular populations decreased during convalescence (F).
IHC staining for WARS in acute-phase biopsy specimens revealed accumulation in nearly every cell type in the lamina propria; however, staining of WARS was minimal or absent from epithelial cells (Fig. 2C and D). IF staining showed the presence of WARS in every cell type in the biopsy sample, including KRT18+ cells (epithelia) (Fig. 3E and F). WARS was detected in 50% of the total cellular population (DAPI positive [DAPI+]). KRT18+ cells comprised roughly 4% of this population, the majority of which showed staining for WARS (roughly 85%). Furthermore, IHC image analysis revealed significantly higher abundance in the acute-phase samples (area ratio of WARS to whole tissue, 0.70 ± 0.13) than in convalescent-phase biopsy specimens (P = 0.02); this also was confirmed using IF images (n = 2, P < 0.05).
Molecular network analysis reveals activation of key hubs in innate immunity.
Many of the 26 differentially abundant proteins affected overlapping biological processes (Table 3), which suggests that they were involved in specific pathways activated in response to V. cholerae O1 infection. We used Ingenuity Pathway Analysis (IPA) to identify networks of interacting proteins within the duodenal biopsy specimens and to connect differentially regulated proteins to molecular networks contained within the Ingenuity Knowledge Base, a repository of biological interaction and functional annotations derived from literature reviews and verified models. IPA identified 30 enriched proteins during acute-phase cholera and connected them in three major networks constructed using the Ingenuity Knowledge Base. The top enriched molecular network contained proteins involved in infectious disease, connective tissue disorders, and immunological disease (score, 28; number of focus molecules in network, 12) (Fig. 4). Several protein hubs showed high connectivity among other molecules in the network (>8 direct or indirect connections), which included hubs involved in transcriptional regulation by STAT3 and STAT1, signal transduction by Toll-like receptors (TLR), cytokine-mediated immune responses (IL-1, IL-12, tumor necrosis factor [TNF], and IFN), nitric oxide production (NOS2), antigen presentation to CD4+ T cells via major histocompatibility complex (MHC) class II, and antibody secretion (IgG). In the second (score, 9; focus molecules, 5) and third (score, 14; number of focus molecules, 7) networks, proteins enriched in our data set connected to major regulators of inflammation, such as NF-κB, IL-6, p38 MAPK, and caspase (data not shown).
FIG 4.

The top, enriched network of interacting proteins present during acute-phase cholera, as determined by IPA. Direct connections (solid arrows) and indirect connections (dashed arrows) are shown. This network was defined as infectious disease, cell death and survival, and cell-to-cell signaling and interaction (score, 45; 18 differentially abundant proteins). Proteins represented in green were more abundant during acute-phase cholera, and those represented in red were less abundant. Proteins represented in gray were in our data set but showed no differences in abundance between acute-phase and convalescent-phase cholera. Proteins shown in white were not present in our data set but were added by IPA due to their connection to the enriched proteins. Scores were calculated from hypergeometric distribution and right-tailed Fisher's exact test (see Materials and Methods). ERK1/2, extracellular signal-regulated kinase 1 and 2.
IPA also predicted the potential regulators that activated the enriched proteins and networks in our data set (Table 4). The upstream regulators with the two most significant Z-scores were IL-6 and IL-12β, with scores of 2.46 (P = 4.74E−10) and 2.19 (P = 7.89E−09), respectively. IFN-α/β was another regulator of proteins in our data set (Z = 2.18, P = 6.36E−05). We confirmed the production of IL-12β ex vivo in response to V. cholerae O1 using five additional duodenal biopsy specimens recovered from cholera patients enrolled in a separate study (4); this cohort was similar in age range and socioeconomic status to the cohort used for the proteomic analysis and was also infected with V. cholerae O1 El Tor Ogawa. We detected overall higher levels of IL-12β in lamina propria lymphocytes (LPL) isolated from acute-stage cholera biopsy specimens than in LPLs taken from convalescence-stage biopsy specimens (Fig. 5). LPLs isolated from acute-stage cholera biopsy specimens also produced high levels of IL-6, as has been reported previously (4).
TABLE 4.
Predicted upstream regulators of differentially abundant proteins, as determined by Ingenuity's IPA software
| Upstream regulator | Molecule type | Function | Activation Z-scorea | P valueb | Target molecules in data set |
|---|---|---|---|---|---|
| IL-6 | Cytokine | Inducer of the acute-phase response; differentiation of monocytes and lymphocytes; differentiates B cells into Ig-secreting cells | 2.456 | 4.74E−10 | CES2, ELANE, GSTA1, ITLN1, LCN2, MPO, NOS2, S100A9, STAT1, STAT3, WARS |
| IL-12β | Cytokine | Expressed by macrophages, which induce Th1 cell development; helps sustain a sufficient number of memory Th1 cells for long-term protection | 2.191 | 7.89E−09 | NOS2, S100A8, S100A9, STAT1, STAT3 |
| IL-17A | Cytokine | Produced by activated T cells, regulates NF-κB and mitogen-activated protein kinases, stimulates IL-6 expression, enhances nitric oxide production | 2.13 | 3.17E−06 | LCN2, MPO, NOS2, S100A8, S100A9, STAT3 |
| OSM | Cytokine | Member of the IL-6 cytokine family; regulator of IL-6, G-CSF, and GM-CSF from endothelial cellsc | 2.5 | 4.06E−06 | LCN2, MAOA, NOS2, S100A8, S100A9, STAT1, STAT3 |
| CEBPA | Transcription regulator | A bZIP transcription factor; binds to CCAAT motifs in promoters/enhancers, modulates gene expression, interacts with some kinases, and arrests growth | 2.386 | 1.34E−05 | LCN2, MPO, S100A8, S100A9, CKAP4, ELANE |
| IFN-α/β | Cytokine | Produced in macrophages in response to infection | 2.184 | 6.36E−05 | NOS2, S100A9, STAT1, STAT3, WARS |
| IFN-γ | Cytokine | Produced by antigen-activated lymphocytes; immunoregulatory activities, activator of macrophages, potentiates IFN effects | 2.751 | 1.48E−04 | LCN2, NOS2, S100A8, S100A9, STAT1, STAT3, WARS, CAV1 |
| IL-1β | Cytokine | Produced by activated macrophages via caspase-1; mediates the inflammatory response, B-cell maturation, and apoptosis | 2.37 | 5.13E−04 | LCN2, NOS2, S100A8, S100A9, STAT1, GSTA1 |
Based on the log2 ratio, P value, and the statistical effect size. All regulators were predicted to be activated.
P values were generated by Fisher's exact t test.
G-CSF, granulocyte colony-stimulating factor; GM-CSF, granulocyte-macrophage colony-stimulating factor.
FIG 5.
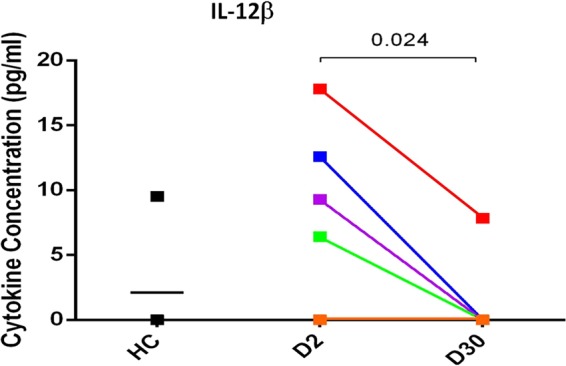
IL-12β cytokine response to in vivo stimulation of lamina propria lymphocytes (LPLs) by V. cholerae. LPLs were cultured from duodenal biopsy specimens taken from cholera patients in the acute (day 2, D2) and convalescent (day 30, D30) stages and from healthy control (HC) patients. IL-12β was measured in cell culture supernatants (pg/ml). LPLs isolated from acute-stage biopsy specimens produced significantly more IL-12β than those taken from convalescent-stage biopsy specimens, as determined by Student's t test (P < 0.05). LPLs isolated from four of the five healthy biopsy specimens did not produce any detectable IL-12β.
DISCUSSION
This study represents the first whole-proteome analysis that directly captures the early host response to V. cholerae O1 in vivo during active cholera. Using a comparative proteomic analysis of human duodenal biopsy samples, we observed upregulation of innate immune proteins that are involved in the early host response to V. cholerae O1 infection in the intestinal mucosa and extrapolated from this information to postulate the canonical hubs of innate immune activation that act as upstream regulators controlling activation of the enriched proteins and pathways within our data set. We were able to confirm the abundance of selected proteins that appeared enriched in our data set using immunostaining techniques, and we also confirmed that IL-12β, an upstream regulator predicted to be active by our IPA pathway analysis, was produced by lamina propria lymphocytes during cholera ex vivo. Our findings are consistent with results of other gene expression and immunological studies of duodenal biopsy specimens from acute-phase cholera patients, which similarly indicate that innate defense proteins and proinflammatory cytokines accumulate in the gut during cholera (4, 6).
We identified two novel proteins that are part of the host response during acute-phase cholera: WARS, a cytoplasmic tryptophanyl-tRNA synthetase that catalyzes the aminoacylation of tRNA to its cognate amino acid tryptophan, and S100A8, a calcium/zinc binding calprotectin protein that binds to TLR4 and acts as a danger-associated molecular pattern, activating NF-κB, cytokine production, and apoptosis (25, 26). Both proteins were significantly abundant in the lamina propria of acute-phase cholera duodenal biopsy specimens. S100A8 is as an antimicrobial peptide that chelates ions to limit bacterial growth in the intestinal mucosa (25, 27) and is present in the circulation during inflammatory diseases such as inflammatory bowel disease (28). The specific role of WARS in the immune response is not well characterized, but it is known to be activated by IFN-γ and IL-6 in stimulated CD4+ T cells (29–31). Functional analyses of WARS and S100A8 in an appropriate model system are needed to clarify their role in mediating the host response to cholera, which remains an area of future investigation.
Interestingly, our proteomic analysis revealed a decreased relative abundance of a small set of proteins during acute-phase cholera that are involved in processes that specifically affect sugar metabolism in the mucosal epithelia. Two enzymes expressed in the intestinal brush border, sucrase-isomaltase (SI) and maltase-glucoamylase (MGAM), were more abundant during the convalescence phase than during the acute phase of cholera. These proteins are essential for the digestion of dietary carbohydrates including sucrose and maltose (33). Acute dehydrating disease caused by V. cholerae O1 infection may affect sugar metabolism in the gut in two possible ways. In vitro, some pathogens can alter the cytoskeleton of epithelial cells, which blocks transport of disaccharidases without affecting their biosynthesis or disrupting the epithelial cell barrier (34). Alternatively, disruption of the intestinal microbiota due to V. cholerae O1 infection or antibiotic treatment may have contributed to reduced disaccharidase expression. In a Drosophila model of host-microbiota interactions, gut commensal bacteria dramatically impacted the midgut transcriptome by promoting the expression of genes involved in host digestive function and sugar metabolism, including disaccharidases (35). Therefore, we are currently exploring the hypothesis that disruption of the intestinal microbiota by V. cholerae O1 infection or antibiotics may decrease host expression of SI and MGAM.
A suite of innate defense proteins is consistently activated during acute-phase cholera, and these proteins could serve as markers for a robust immune response to V. cholerae O1. Lactotransferrin (LTF) and neutrophil gelatinase-associated lipocalin (LCN2) are major iron-binding proteins that limit bacterial growth by iron sequestration and production of antibacterial peroxide species during the inflammatory response (36, 37). Myeloperoxidase (MPO) and nitric oxide synthase 2 (NOS2) also limit bacterial growth by production of hypochlorous acid and NO, respectively (38–40). In a whole-genome microarray screen of duodenal biopsy specimens taken from cholera patients, genes for these four proteins consistently displayed the same regulatory patterns (2, 6). We observed differential abundance of these proteins in acute-phase cholera biopsy specimens, and their known activity in neutrophils (41–43) suggests the possible importance of activated neutrophils in controlling the growth of V. cholerae O1 in the gut. In fact, during cholera, neutrophils are present in high numbers in the lamina propria, and in mouse models of cholera, both neutrophil recruitment and expression of innate defense proteins are reported during the acute phase (2, 18, 44). In addition, there is also an increase of neutrophils in the systemic circulation at the acute phase in cholera (2). LTF and MPO are also elevated in stool samples obtained from adults and children actively infected with V. cholerae O1, while NOS2 is elevated in plasma (45). Given the ease of sampling LTF, LCN2, MPO, and NOS2 products from accessible body fluids, these proteins could serve as markers for immune activation by V. cholerae O1 and may be useful in evaluating early immune responses to V. cholerae O1 following infection or vaccination.
Several proinflammatory cytokines were predicted upstream regulators of host proteins activated during acute-phase cholera, including IL-12β, a cytokine that drives differentiation of naive T cells into CD4+ T helper cells (Th1) (46, 47), and IL-17A, a cytokine produced by T helper 17 (Th17) cells that augments the inflammatory response via NF-κB (48–50). We confirmed that IL-12β is produced by LPLs isolated from acute-stage cholera biopsy specimens, and a previous analysis confirmed the same pattern for IL-17A (4). These findings support a key role for IL-12β and IL-17A in mediating the inflammatory response to V. cholerae O1. Th1 cells are essential for generating a memory T cell response, facilitating antigen presentation, and maximizing the bactericidal activity of macrophages (51, 52). Several bacterial pathogens trigger a strong Th17 response, which is critical for recruitment of neutrophils and generation of a protective memory response (50, 53). IL-17A also amplifies the production of LTF, LCN2, and NOS2 in epithelial cells (41, 54, 55). Investigations into the protective role of Th17 cells against V. cholerae O1 showed that infection, but not vaccination with Dukoral, induced an IL-17A response. It is possible that vaccination with inactivated strains of V. cholerae O1 is unable to trigger responses similar to those triggered by live bacteria although the mechanism for this is unknown (4).
We hypothesize a model of innate immune activation by V. cholerae O1 which incorporates pathways and regulators highlighted by our IPA analysis, immune proteins that we observed to be significantly abundant during the acute stage of cholera, and pathways previously found to be associated with cholera (8, 11, 12) (Fig. 6). Our proposed model is also supported by gene expression studies of biopsy specimens in acute-phase cholera (2, 4, 6), in vitro studies of immune sensing of Gram-negative bacteria (11, 12), and in vitro stimulation of immune cells with V. cholerae antigens (5, 13, 17, 18). In this model, LPS in the cell membrane of V. cholerae O1 binds to TLR4, which activates NF-κB and leads to production of inflammatory cytokines (IL-6, IL-12β, IL-18, and IL-1β). These cytokines amplify their own expression via autocrine systems, as well as activate innate defense proteins and regulators of NF-κB. Concurrently, CT stimulates formation of cAMP and activates p38 MAPK, which results in amplification of inflammatory cytokines, including IFN-β and IL-12β. This model is supported by results of a genome-wide association study of a Bangladeshi population, which showed that genes regulating NF-κB and the caspase-1 inflammasome are associated with cholera susceptibility (8). This study also showed that, by an unknown mechanism, CT activates the inflammasome after priming with LPS in vitro (8). We suggest that the mechanism of inflammasome activation by CT may be via activation of p38 MAPK and production of IFN-β, which then stimulates IFN-β receptors and the downstream NLRP3 inflammasome (Fig. 6). The enzymatically inactive B subunit of cholera toxin (CTB) also activates the NLRP3 inflammasome (11, 56) and acts as an immunoadjuvant when coupled to antigens in mouse vaccination studies (57, 58). However, CTB suppresses p38 MAPK, which attenuates proinflammatory cytokine production in LPS-stimulated mouse macrophages (59), and in animal models, CTB is used to suppress autoimmune diseases (60, 61). CTB, which is a component of the Dukoral vaccine, has been shown to inhibit IL-12β release and T cell activation in vitro (62). This model posits that CT, but not CTB, may amplify production of IL-12β and IL-17A, which are essential cytokines that activate Th1 and Th17 cell responses to infection.
FIG 6.

Proposed human innate immune signaling pathways activated during V. cholerae O1 infection of the duodenum. We developed this model by combining our proteomic results and the results of the pathway analyses using Ingenuity's IPA software. Our model draws connections between differentially abundant proteins in our data set (red boxes), predicted upstream regulators (blue boxes and circles), enriched canonical pathways (blue lines), and proteins/pathways known to respond to V. cholerae and cholera toxin (CT) in vitro (black boxes, circles, and lines). Dashed lines represent binding interactions, whereas solid lines with arrowheads indicate activation or regulation of a downstream protein. Solid lines with blunt ends indicate repression of a downstream protein. Upon exposure to V. cholerae, TLR4 is stimulated, which leads to activation of NF-κB and the NLRP3 inflammasome; concurrently, CT stimulates G-protein-coupled receptors (GM1), which activate p38 MAPK. These inflammatory mediators drive production of the cytokines IL-1β, IL-18, IL-6, IL-12β, and IFN-β; NOS2 is also activated, leading to nitric oxide (NO) production. IL-6, IFN-β, and IL-18 function in autocrine loops to further amplify their own production, the inflammatory response via NF-κB and NLRP3, and cell death by apoptosis. IL-17A produced by activated T cells aids in regulating innate defense protein production, such as that of S100A8 and S100A9. Interactions found using Ingenuity's Knowledge Base are labeled with actions, and references are given in parentheses (42, 63–81). IFNR, IFN receptor.
There are some important limitations of our study. First, our study was performed with a relatively small sample of patients (n = 8), and there was notable heterogeneity between patients. Although no discernible clusters of patients could be identified based on the patterns of protein abundance at day 2 relative to day 30, it is unlikely that such clusters could be easily identified in such a small sample size. In addition, our small sample size of eight patients further compounds reproducibility; however, congruence between our data set and others that characterized gene expression in duodenal biopsy specimens from acute-phase cholera patients lends support to the validity of our findings (6). Second, standards of care required each cholera patient to be treated with antibiotic therapy prior to collection of duodenal biopsy specimens. Based on our study design, it is impossible to discern whether antibiotic treatment may have altered the host inflammatory response induced by V. cholerae O1 alone. Third, many proteins may only function when bound to other proteins or RNA molecules, and many experience posttranslational modifications that profoundly affect their activities. Our mass spectrometry method did not capture these types of modifications, which limited our ability to apply a definite activation state or biological relevance to specific proteins or enriched pathways. Furthermore, protein quantification using label-free mass spectrometry generates relative measurements of protein abundance using spectral counts, not absolute measurements. We used immunostaining of duodenal biopsy specimens to confirm the presence and abundance of at least two proteins from our data set, but it is not feasible to conduct this analysis for every protein identified in our proteomics study. Therefore, we developed our aforementioned model of innate immune activation by V. cholerae O1 (Fig. 6) as a testable hypothesis that must be supported by additional in vitro experimentation, which remains an area for future study.
Our investigation supports the validity of discovery-based omics studies for characterizing the early host responses to V. cholerae O1, which may be critical for understanding downstream adaptive immune responses and long-term immunoprotection. We used comparative proteomics to show that V. cholerae O1 consistently activates neutrophil-associated defense proteins (LTF, LCN2, MPO, and NOS2), proinflammatory cytokines (IL-12β, IL-17A, and IL-6), and key regulators of inflammation such as NF-κB, STAT3, and p38 MAPK, all of which are critical for activating protective neutrophils, recruiting antigen-presenting cells to the site of infection, and regulating antigen presentation to T cells (15, 16, 41−43, 46−53, 78). The importance of MHC class II presentation is highlighted by its connection to several proteins differentially regulated in our data set and to inflammatory pathways in our network analysis. This robust inflammatory response early during infection may be critical for eliciting the long-term protective immune response against V. cholerae O1 that occurs after natural infection (2, 45).
Supplementary Material
ACKNOWLEDGMENTS
This work was supported by grants from the International Centre for Diarrhoeal Disease Research, Dhaka, Bangladesh (icddr,b), and the National Institutes of Health, including the National Institute of Allergy and Infectious Diseases (AI058935 and AI106878 to E.T.R.; R01 AI099243 and R01 AI103055 to J.B.H.) and a training grant in Vaccine Development and Public Health (TW005572 to T.U. and T.R.B.).
We thank Brian M. Schuster and Meagan K. Bufano for technical support, as well as Lynda Stewart and Christine E. Becker for helpful discussions.
Footnotes
Supplemental material for this article may be found at http://dx.doi.org/10.1128/IAI.02765-14.
REFERENCES
- 1.Ali M, Lopez AL, You YA, Kim YE, Sah B, Maskery B, Clemens J. 2012. The global burden of cholera. Bull World Health Organ 90:209–218A. doi: 10.2471/BLT.11.093427. [DOI] [PMC free article] [PubMed] [Google Scholar]
- 2.Qadri F, Bhuiyan TR, Dutta KK, Raqib R, Alam NH, Svennerholm AM, Mathan MM. 2004. Acute dehydrating disease caused by Vibrio cholerae serogroups O1 and O139 induce increases in innate cells and inflammatory mediators at the mucosal surface of the gut. Gut 53:62–69. doi: 10.1136/gut.53.1.62. [DOI] [PMC free article] [PubMed] [Google Scholar]
- 3.Holmgren J, Czerkinsky C. 1992. Cholera as a model for research on mucosal immunity and development of oral vaccines. Curr Opin Immunol 4:387–391. doi: 10.1016/S0952-7915(06)80027-0. [DOI] [PubMed] [Google Scholar]
- 4.Kuchta A, Rahman T, Sennot EL, Bhuyian TR, Uddin T, Rashu R, Chowdhury F, Kahn AI, Arifuzzaman M, Weil AA, Podolsky M, LaRocque RC, Ryan ET, Calderwood SB, Qadri F, Harris JB. 2011. Vibrio cholerae O1 infection induces proinflammatory CD4+ T cell responses in blood and intestinal mucosa of infected humans. Clin Vaccine Immunol 18:1371–1377. doi: 10.1128/CVI.05088-11. [DOI] [PMC free article] [PubMed] [Google Scholar]
- 5.Shin OS, Uddin T, Citorik R, Wang JP, Della Pelle P, Kradin RL, Bingle CD, Bingle L, Camilli A, Bhuiyan TR, Shirin T, Ryan ET, Calderwood SB, Finberg RW, Qadri F, LaRocque RC, Harris JB. 2011. LPLUNC1 modulates innate immune responses to Vibrio cholerae. J Infect Dis 204:1349–1357. doi: 10.1093/infdis/jir544. [DOI] [PMC free article] [PubMed] [Google Scholar]
- 6.Flach CF, Qadri F, Bhuiyan TR, Alam NH, Jennische E, Lonnroth I, Holgren J. 2007. Broad up-regulation of innate defense factors during acute cholera. Infect Immun 75:2343–2350. doi: 10.1128/IAI.01900-06. [DOI] [PMC free article] [PubMed] [Google Scholar]
- 7.LaRocque RC, Sabeti P, Duggal P, Chowdhury F, Khan AI, Lebrun LM, Harris JB, Ryan ET, Qadri F, Calderwood SB. 2009. A variant in long palate, lung and nasal epithelium clone 1 is associated with cholera in a Bangladeshi population. Genes Immun 10:267–272. doi: 10.1038/gene.2009.2. [DOI] [PMC free article] [PubMed] [Google Scholar]
- 8.Karlsson EK, Harris JB, Tabrizi S, Rahman A, Shlyakhter I, Patterson N, O'Dushlaine C, Schaffner SF, Gupta S, Chowdhury F, Sheikh A, Shin OK, Ellis CN, Becker CE, Stuart LM, Calderwood SB, Ryan ET, Qadri F, Sabeti PC, LaRocque RC. 2013. Natural selection in a Bangladeshi population from the cholera-endemic Ganges River Delta. Sci Transl Med 5:192ra86. doi: 10.1126/scitranslmed.3006338. [DOI] [PMC free article] [PubMed] [Google Scholar]
- 9.Gilmore TD. 2006. Introduction to NF-κB: players, pathways, perspectives. Oncogene 25:6680–6684. doi: 10.1038/sj.onc.1209954. [DOI] [PubMed] [Google Scholar]
- 10.Hayden MS, Ghosh S. 2012. NF-κB, the first quarter-century: remarkable progress and outstanding questions. Genes Dev 26:203–234. doi: 10.1101/gad.183434.111. [DOI] [PMC free article] [PubMed] [Google Scholar]
- 11.Rathinam VAK, Vanaja SK, Waggoner L, Sokolovska A, Becker C, Stuart LM, Leong JM, Fitzgerald KA. 2012. TRIF licenses caspase-11-dependent NLRP3 inflammasome activation by gram-negative bacteria. Cell 150:606–619. doi: 10.1016/j.cell.2012.07.007. [DOI] [PMC free article] [PubMed] [Google Scholar]
- 12.Sander LE, Davis MJ, Boekschoten MV, Amsen D, Dascher CC, Ryffel B, Swanson JA, Muller M, Blander JM. 2011. Sensing prokaryotic mRNA signifies microbial viability and promotes immunity. Nature 474:385–389. doi: 10.1038/nature10072. [DOI] [PMC free article] [PubMed] [Google Scholar]
- 13.Kawamura YI, Kawashima R, Shirai Y, Kato R, Hamabata T, Yamamoto M, Furukawa K, Fujihashi K, McGhee JR, Hayashi H, Dohi T. 2003. Cholera toxin activates dendritic cells through dependence on GM1-ganglioside which is mediated by NF-κB translocation. Eur J Immunol 33:3205–3212. doi: 10.1002/eji.200324135. [DOI] [PubMed] [Google Scholar]
- 14.Lubran MM. 1998. Bacterial toxins. Ann Clin Lab Sci 18:58–71. [PubMed] [Google Scholar]
- 15.Cao W, Daniel KW, Robidoux J, Puigserver P, Medvedev AV, Bai X, Floering LM, Spiegelman NM, Collins S. 2004. p38 mitogen-activated protein kinase is the central regulator of cyclic AMP-dependent transcription of the brown fat uncoupling protein 1 gene. Mol Cell Biol 24:3057–3067. doi: 10.1128/MCB.24.7.3057-3067.2004. [DOI] [PMC free article] [PubMed] [Google Scholar]
- 16.Han J, Lee JD, Bibbs L, Ulevitch RJ. 1994. A MAP kinase targeted by endotoxin and hyperosmolarity in mammalian cells. Science 265:808–811. doi: 10.1126/science.7914033. [DOI] [PubMed] [Google Scholar]
- 17.Queen J, Fullner Satchell KJ. 2012. Neutrophils are essential for containment of Vibrio cholerae to the intestine during the proinflammatory phase of induction. Infect Immun 80:2905–2913. doi: 10.1128/IAI.00356-12. [DOI] [PMC free article] [PubMed] [Google Scholar]
- 18.Bishop AL, Patimalla B, Camilli A. 2014. Vibrio cholerae-induced inflammation in the neonatal mouse cholera model. Infect Immun 82:2434–2447. doi: 10.1128/IAI.00054-14. [DOI] [PMC free article] [PubMed] [Google Scholar]
- 19.Atianand MK, Duffy EB, Shah A, Kar S, Malik M, Harton JA. 2011. Francisella tularensis reveals a disparity between human and mouse NLRP3 inflammasome activation. J Biol Chem 286:39033–39042. doi: 10.1074/jbc.M111.244079. [DOI] [PMC free article] [PubMed] [Google Scholar]
- 20.von Moltke J, Ayres JS, Kofoed EM, Chavarris-Smith J, Vance RE. 2013. Recognition of bacteria by inflammasomes. Annu Rev Immunol 31:73–106. doi: 10.1146/annurev-immunol-032712-095944. [DOI] [PubMed] [Google Scholar]
- 21.Klose KE. 2000. The suckling mouse model of cholera. Trends Microbiol 8:189–191. doi: 10.1016/S0966-842X(00)01721-2. [DOI] [PubMed] [Google Scholar]
- 22.Brown JN, Wallet MA, Krasins B, Sarracino D, Goodenow MM. 2010. Proteome bioprofiles distinguish between M1 priming and activation states in human macrophages. J Leukoc Biol 87:655–662. doi: 10.1189/jlb.0809570. [DOI] [PMC free article] [PubMed] [Google Scholar]
- 23.Lopez MF, Kuppusamy R, Sarracino DA, Prakash A, Athanas M, Krastins B, Rezai T, Sutton JN, Peterman S, Nicolaides K. 2011. Mass spectrometric discovery and selective reaction monitoring (SRM) of putative protein biomarker candidates in first trimester trisomy 21 maternal serum. J Proteome Res 10:133–142. doi: 10.1021/pr100153j. [DOI] [PubMed] [Google Scholar]
- 24.Clamp M, Fry B, Kamal M, Xie X, Cuff J, Lin MF, Kellis M, Lindblad-Toh K, Lander ES. 2007. Distinguishing protein-coding and noncoding genes in the human genome. Proc Natl Acad Sci U S A 104:19428–19433. doi: 10.1073/pnas.0709013104. [DOI] [PMC free article] [PubMed] [Google Scholar]
- 25.Kwon CH, Moon HJ, Park HJ, Choi JH, Park DY. 2013. S100A8 and S100A9 promotes invasion and migration through p38 mitogen-activated protein kinase-dependent NF-κB activation in gastric cancer cells. Mol Cells 35:226–234. doi: 10.1007/s10059-013-2269-x. [DOI] [PMC free article] [PubMed] [Google Scholar]
- 26.Ehrchen JM, Sunderkotter C, Foell D, Vogl T, Roth J. 2009. The endogenous toll-like receptor 4 agonist S100A8/S100A9 (calprotectin) as innate amplifier of infection, autoimmunity, and cancer. J Leukoc Biol 86:557–566. doi: 10.1189/jlb.1008647. [DOI] [PubMed] [Google Scholar]
- 27.Passey RJ, Xu K, Hume DA, Geczy CL. 1999. S100A8: Emerging functions and regulation. J Leukoc Biol 66:549–556. [DOI] [PubMed] [Google Scholar]
- 28.Leach ST, Yang Z, Messina I, Song C, Geczy CL, Cunningham AM, Day AS. 2007. Serum and mucosal S100 proteins, calprotectin (S100A8/S100A9) and S100A12, are elevated at diagnosis in children with inflammatory bowel disease. Scand J Gastroenterol 42:1321–1331. doi: 10.1080/00365520701416709. [DOI] [PubMed] [Google Scholar]
- 29.Boasso A, Herbeuval J-P, Hardy AW, Winkler C, Shearer GM. 2005. Regulation of indoleamine 2,3-dioxygenase and tryptophanyl-tRNA-synthetase by CTLA-4-fc in human CD4+ T cells. Blood 105:1574–1581. doi: 10.1182/blood-2004-06-2089. [DOI] [PubMed] [Google Scholar]
- 30.Fleckner J, Martensen PM, Tolstrup AB, Kjeldgaard NO, Justesen J. 1995. Differential regulation of the human, interferon inducible tryptophanyl-tRNA synthetase by various cytokines in cell lines. Cytokine 7:70–77. doi: 10.1006/cyto.1995.1009. [DOI] [PubMed] [Google Scholar]
- 31.Dienz O, Rincon M. 2009. The effects of IL-6 on CD4 T cell responses. Clin Immunol 130:27–33. doi: 10.1016/j.clim.2008.08.018. [DOI] [PMC free article] [PubMed] [Google Scholar]
- 32.Reference deleted.
- 33.Sim L, Willemsma C, Mohan S, Naim HY, Pinto BM, Rose DR. 2010. Structural basis for substrate selectivity in human maltase-glucoamylase and sucrase-isomaltase N-terminal domains. J Biol Chem 285:17763–17770. doi: 10.1074/jbc.M109.078980. [DOI] [PMC free article] [PubMed] [Google Scholar]
- 34.Jourdan N, Brunet JP, Sapin C, Blais A, Cotte-Laffitte J, Forestier F, Quero AM, Trugnan G, Servin AL. 1998. Rotavirus infection reduces sucrase-isomaltase expression in human intestinal epithelial cells by perturbing protein targeting and organization of microvillar cytoskeleton. J Virol 72:7228–7236. [DOI] [PMC free article] [PubMed] [Google Scholar]
- 35.Combe BE, Defaye A, Bozonnet N, Puthier D, Royet J, Leulier F. 2014. Drosophila microbiota modulates host metabolic gene expression via IMD/NF-κB signaling. PLoS One 9:e94729. doi: 10.1371/journal.pone.0094729. [DOI] [PMC free article] [PubMed] [Google Scholar]
- 36.Sanchez L, Calvo M, Brock JH. 1992. Biological role of lactoferrin. Arch Dis Child 67:657–661. doi: 10.1136/adc.67.5.657. [DOI] [PMC free article] [PubMed] [Google Scholar]
- 37.Mollinedo F, Martin-Martin B, Calafat J, Nabokina SM, Lazo PA. 2003. Role of vesicle-associated membrane protein-2, through Q-soluble N-ethylmaleimide-sensitive factor attachment protein receptor/R-soluble N-ethylmaleimide-sensitive factor attachment protein receptor interaction, in the exocytosis of specific and tertiary granules of human neutrophils. J Immunol 170:1034–1042. doi: 10.4049/jimmunol.170.2.1034. [DOI] [PubMed] [Google Scholar]
- 38.Mathy-Hartert M, Deby-Dupont G, Melin P, Lamy M, Deby C. 1996. Bactericidal activity against Pseudomonas aeruginosa is acquired by cultured human monocyte-derived macrophages after uptake of myeloperoxidase. Experientia 52:167–174. doi: 10.1007/BF01923364. [DOI] [PubMed] [Google Scholar]
- 39.Kim JM, Kim JS, Jung HC, Song IS, Kim CY. 2002. Up-regulation of inducible nitric oxide synthase and nitric oxide in Helicobacter pylori-infected human gastric epithelial cells: possible role of interferon-gamma in polarized nitric oxide secretion. Helicobacter 7:116–128. doi: 10.1046/j.1083-4389.2002.00068.x. [DOI] [PubMed] [Google Scholar]
- 40.MacMicking J, Xie QW, Nathan C. 1997. Nitric oxide and macrophage function. Annu Rev Immunol 15:323–350. doi: 10.1146/annurev.immunol.15.1.323. [DOI] [PubMed] [Google Scholar]
- 41.Cowland JB, Sorensen OE, Sehested M, Borregaard N. 2003. Neutrophil gelatinase-associated lipocalin is up-regulated in human epithelial cells by IL-1β, but not by TNF-α. J Immunol 171:6630–6639. doi: 10.4049/jimmunol.171.12.6630. [DOI] [PubMed] [Google Scholar]
- 42.Gasse P, Mary C, Guenon I, Noulin N, Charron S, Schnyder-Candrian S, Schnyder B, Akira S, Quesniaux VF, Lagente V, Ryffel B, Couillin I. 2007. IL-1R1/MyD88 signaling and the inflammasome are essential in pulmonary inflammation and fibrosis in mice. J Clin Invest 117:3786–3799. doi: 10.1172/JCI32285. [DOI] [PMC free article] [PubMed] [Google Scholar]
- 43.Jaiswal M, LaRusso NF, Burgart LJ, Gores GJ. 2000. Inflammatory cytokines induce DNA damage and inhibit DNA repair in cholangiocarcinoma cells by a nitric oxide-dependent mechanism. Cancer Res 60:184–190. [PubMed] [Google Scholar]
- 44.Mathan MM, Chandy G, Mathan VI. 1995. Ultrastructural changes in the upper small intestinal mucosa in patients with cholera. Gastroenterology 109:422–430. doi: 10.1016/0016-5085(95)90329-1. [DOI] [PubMed] [Google Scholar]
- 45.Qadri F, Raqib R, Ahmed F, Rahman T, Wenneras C, Das SK, Alam NH, Mathan MM, Svennerholm AM. 2002. Increased levels of inflammatory mediators in children and adults infected with Vibrio cholerae O1 and O139. Clin Diagn Lab Immunol 9:221–229. doi: 10.1128/CDLI.9.2.221-229.2002. [DOI] [PMC free article] [PubMed] [Google Scholar]
- 46.Kalinski P, Hilkens CM, Snijders A, Snijdewint FG, Kapsenberg ML. 1997. IL-12-deficient dendritic cells, generated in the presence of prostaglandin E2, promote type 2 cytokine production in maturing human naive T helper cells. J Immunol 159:28–35. [PubMed] [Google Scholar]
- 47.Hsieh CS, Macatonia SE, Tripp CS, Wolf SF, O'Garra A, Murphy KM. 1993. Development of Th1 CD4+ T cells through IL-12 produced by Listeria-induced macrophages. Science 260:547–549. doi: 10.1126/science.8097338. [DOI] [PubMed] [Google Scholar]
- 48.Mills KH. 2008. Induction, function and regulation of IL-17-producing T cells. Eur J Immunol 38:2636–2649. doi: 10.1002/eji.200838535. [DOI] [PubMed] [Google Scholar]
- 49.Pappu R, Ramirez-Carrozzi V, Sambandam A. 2011. The interleukin-17 cytokine family: critical players in host defense and inflammatory diseases. Immunology 134:8–16. doi: 10.1111/j.1365-2567.2011.03465.x. [DOI] [PMC free article] [PubMed] [Google Scholar]
- 50.Korn T, Bettelli E, Oukka M, Kuchroo VK. 2009. IL-17 and Th17 cells. Annu Rev Immunol 27:485–517. doi: 10.1146/annurev.immunol.021908.132710. [DOI] [PubMed] [Google Scholar]
- 51.Nakayamada S, Takahashi H, Kanno Y, O'Shea JJ. 2012. Helper T cell diversity and plasticity. Curr Opin Immunol 24:297–302. doi: 10.1016/j.coi.2012.01.014. [DOI] [PMC free article] [PubMed] [Google Scholar]
- 52.McHeyzer-Williams M, Okitsu S, Wang N, McHeyzer-Williams L. 2012. Molecular programming of B cell memory. Nat Rev Immunol 12:24–34. doi: 10.1038/nri3128. [DOI] [PMC free article] [PubMed] [Google Scholar]
- 53.Khader SA, Bell GK, Pearl JE, Fountain JJ, Rangel-Moreno J, Cilley GE, Shen F, Eaton SM, Gaffen SL, Swain SL, Locksley RM, Haynes L, Randall TD, Cooper AM. 2007. IL-23 and IL-17 in the establishment of protective pulmonary CD4+ T cell responses after vaccination and during Mycobacterium tuberculosis challenge. Nat Immunol 8:369–377. doi: 10.1038/ni1449. [DOI] [PubMed] [Google Scholar]
- 54.Pelletier M, Maggi L, Micheletti A, Lazzeri E, Tamassia N, Costantini C, Cosmi L, Lunardi C, Annunziato F, Romagnani S, Cassatella MA. 2010. Evidence for a cross-talk between human neutrophils and Th17 cells. Blood 115:335–343. doi: 10.1182/blood-2009-04-216085. [DOI] [PubMed] [Google Scholar]
- 55.Cianchi F, Cortesini C, Fantappie O, Messerini L, Schiavone N, Vannacci A, Nistri S, Sardi I, Baroni G, Marzocca C, Perna F, Mazzanti R, Bechi P, Masini E. 2003. Inducible nitric oxide synthase expression in human colorectal cancer: correlation with tumor angiogenesis. Am J Pathol 162:793–801. doi: 10.1016/S0002-9440(10)63876-X. [DOI] [PMC free article] [PubMed] [Google Scholar]
- 56.Kayagaki N, Warming S, Lamkanfi M, Vande Walle L, Louie S, Song J, Newton K, Qu Y, Liu J, Heldens S, Zhang J, Lee WP, Roose-Girma M, Dixit VM. 2011. Non-canonical inflammasome activation targets caspase-11. Nature 479:117–121. doi: 10.1038/nature10558. [DOI] [PubMed] [Google Scholar]
- 57.Ryan ET, Butterton JR, Zhang T, Baker MA, Stanley SL Jr, Calderwood SB. 1997. Oral immunization with attenuated vaccine strains of Vibrio cholerae expressing a dodecapeptide repeat of the serine-rich Entamoeba histolytica protein fused to the cholera toxin B subunit induces systemic and mucosal antiamebic and anti-V. cholerae antibody responses in mice. Infect Immun 65:3118–3125. [DOI] [PMC free article] [PubMed] [Google Scholar]
- 58.Backstrom M, Lebens M, Schodel F, Holmgren J. 1994. Insertion of a HIV-1-neutralizing epitope in a surface-exposed internal region of the cholera toxin B-subunit. Gene 149:211–217. doi: 10.1016/0378-1119(94)90152-X. [DOI] [PubMed] [Google Scholar]
- 59.Chen P, Li J, Barnes J, Kokkonen GC, Lee JC, Liu Y. 2002. Restraint of proinflammatory cytokine biosynthesis by mitogen-activated protein kinase phosphatase-1 in lipopolysaccharide-stimulated macrophages. J Immunol 169:6408–6416. doi: 10.4049/jimmunol.169.11.6408. [DOI] [PubMed] [Google Scholar]
- 60.Sobel DO, Yankelevich B, Goyal D, Nelson D, Mazumder A. 1998. The B-subunit of cholera toxin induces immunoregulatory cells ad prevents diabetes in the NOD mouse. Diabetes 47:186–191. doi: 10.2337/diab.47.2.186. [DOI] [PubMed] [Google Scholar]
- 61.Sun JB, Rask C, Olsson T, Holmgren J, Czerkinsky C. 1996. Treatment of experimental autoimmune encephalomyelitis by feeding myelin basic protein conjugated to cholera toxin B subunit. Proc Natl Acad Sci U S A 93:7196–7201. doi: 10.1073/pnas.93.14.7196. [DOI] [PMC free article] [PubMed] [Google Scholar]
- 62.Coccia EM, Remoli ME, Di Giacinto C, Del Zotto B, Giacomini E, Monteleone G, Boirivant M. 2005. Cholera toxin B subunit inhibits IL-12 and IFN-γ production and signaling in experimental colitis and Crohn's disease. Gut 54:1558–1564. doi: 10.1136/gut.2004.062174. [DOI] [PMC free article] [PubMed] [Google Scholar]
- 63.Lin PW, Simon PO, Gewirtz AT, Neish AS, Ouellette AJ, Madara JL, Lencer WI. 2004. Paneth cell cryptdins act in vitro as apical paracrine regulators of the innate inflammatory response. J Biol Chem 279:19902–19907. doi: 10.1074/jbc.M311821200. [DOI] [PubMed] [Google Scholar]
- 64.McDonald V, Pollok RC, Dhaliwal W, Naik S, Farthing MJ, Bajaj-Elliott M. 2006. A potential role for interleukin-18 in inhibition of the development of Cryptosporidium parvum. Clin Exp Immunol 145:555–562. doi: 10.1111/j.1365-2249.2006.03159.x. [DOI] [PMC free article] [PubMed] [Google Scholar]
- 65.Kanayama A, Inoue J, Sugita-Konishi Y, Shimizu M, Miyamoto Y. 2002. Oxidation of IκBα at methionine 45 is one cause of taurine chloramine-induced inhibition of NF-κB activation. J Biol Chem 277:24049–24056. doi: 10.1074/jbc.M110832200. [DOI] [PubMed] [Google Scholar]
- 66.Liu W, Yan M, Liu Y, Wang R, Li C, Deng C, Singh A, Coleman WG, Rodgers GP. 2010. Olfactomedin 4 down-regulates innate immunity against Helicobacter pylori infection. Proc Natl Acad Sci U S A 107:11056–11061. doi: 10.1073/pnas.1001269107. [DOI] [PMC free article] [PubMed] [Google Scholar]
- 67.Liang SC, Tan XY, Luxenberg DP, Karim R, Dunussi-Joannopoulos K, Collins M, Fouser LA. 2006. Interleukin (IL)-22 and IL-17 are coexpressed by Th17 cells and cooperatively enhance expression of antimicrobial peptides. J Exp Med 203:2271–2279. doi: 10.1084/jem.20061308. [DOI] [PMC free article] [PubMed] [Google Scholar]
- 68.Liu C, Qian W, Qian Y, Giltiay NV, Lu Y, Swaidani S, Misra S, Deng L, Chen ZJ, Li X. 2009. Act1, a U-box E3 ubiquitin ligase for IL-17 signaling. Sci Signal 2:ra63. doi: 10.1126/scisignal.2000382. [DOI] [PMC free article] [PubMed] [Google Scholar]
- 69.Bouwmeester T, Bauch A, Ruffner H, Angrand PO, Bergamini G, Croughton K, Cruciat C, Eberhard D, Gagneur J, Ghidelli S, Hopf C, Huhse B, Mangano R, Michon AM, Schirle M, Schlegl J, Schwab M, Stein MA, Bauer A, Casari G, Drewes G, Gavin AC, Jackson DB, Joberty G, Neubauer G, Rick J, Kuster B, Superti-Furga G. 2004. A physical and functional map of the human TNF-alpha/NF-κB signal transduction pathway. Nat Cell Biol 6:97–105. doi: 10.1038/ncb1086. [DOI] [PubMed] [Google Scholar]
- 70.Alblas J, Honing H, de Lavalette CR, Brown MH, Dijkstra CD, van den Berg TK. 2005. Signal regulatory protein alpha ligation induces macrophage nitric oxide production through JAK/STAT-and phosphatidylinositol 3-kinase/Rac1/NAPDH oxidase/H2O2-dependent pathways. Mol Cell Biol 25:7181–7192. doi: 10.1128/MCB.25.16.7181-7192.2005. [DOI] [PMC free article] [PubMed] [Google Scholar]
- 71.Auguet T, Terra X, Quintero Y, Martinez S, Manresa N, Porras JA, Aguilar C, Orellana-Gavalda JM, Hernandez M, Sabench F, Lucas A, Pellitero S, Del Castillo D, Richart C. 2013. Liver lipocalin 2 expression in severely obese women with non alcoholic fatty liver disease. Exp Clin Endocrinol Diabetes 121:119–124. doi: 10.1055/s-0032-1331696. [DOI] [PubMed] [Google Scholar]
- 72.Hanada T, Kobayashi T, Chinen T, Saeki K, Takaki H, Koga K, Minoda Y, Sanada T, Yoshioka T, Mimata H, Kato S, Yoshimura A. 2006. IFNγ-dependent, spontaneous development of colorectal carcinomas in SOCS1-deficient mice. J Exp Med 203:1391–1397. doi: 10.1084/jem.20060436. [DOI] [PMC free article] [PubMed] [Google Scholar]
- 73.Leng X, Ding T, Lin H, Wang Y, Hu L, Hu J, Feig B, Zhang W, Pusztai L, Symmans WF, Wu Y, Arlinghaus RB. 2009. Inhibition of lipocalin 2 impairs breast tumorigenesis and metastasis. Cancer Res 69:8579–8584. doi: 10.1158/0008-5472.CAN-09-1934. [DOI] [PubMed] [Google Scholar]
- 74.Gomez R, Scotece M, Conde J, Lopez V, Pino J, Lago F, Gomez-Reino JJ, Gualillo O. 2013. Nitric oxide boosts TLR-4 mediated lipocalin 2 expression in chondrocytes. J Orthop Res 31:1046–1052. doi: 10.1002/jor.22331. [DOI] [PubMed] [Google Scholar]
- 75.Costa-Pereira AP, Tininini S, Strobl B, Alonzi T, Schlaak JF, Is'harc H, Gesualdo I, Newman SJ, Kerr IM, Poli V. 2002. Mutational switch of an IL-6 response to an interferon-gamma-like response. Proc Natl Acad Sci U S A 99:8043–8047. doi: 10.1073/pnas.122236099. [DOI] [PMC free article] [PubMed] [Google Scholar]
- 76.Schick N, Oakeley EJ, Hynes NE, Badache A. 2004. TEL/ETV6 is a signal transducer and activator of transcription 3 (Stat3)-induced repressor of Stat3 activity. J Biol Chem 279:38787–38796. doi: 10.1074/jbc.M312581200. [DOI] [PubMed] [Google Scholar]
- 77.Schroder K, Spille M, Pilz A, Lattin J, Bode KA, Irvine KM, Burrows AD, Ravasi T, Weighardt H, Stacey KJ, Decker T, Hume DA, Dalpke AH, Sweet MJ. 2007. Differential effects of CpG DNA on IFN-beta induction and STAT1 activation in murine macrophages versus dendritic cells: alternatively activated STAT1 negatively regulates TLR signaling in macrophages. J Immunol 179:3495–3503. doi: 10.4049/jimmunol.179.6.3495. [DOI] [PubMed] [Google Scholar]
- 78.Hoentjen F, Sartor RB, Ozaki M, Jobin C. 2005. STAT3 regulates NF-κB recruitment to the IL-12p40 promoter in dendritic cells. Blood 105:689–696. doi: 10.1182/blood-2004-04-1309. [DOI] [PubMed] [Google Scholar]
- 79.Rosenberger S, Thorey IS, Werner S, Boukamp P. 2007. A novel regulator of telomerase. S100A8 mediates differentiation-dependent and calcium-induced inhibition of telomerase activity in the human epidermal keratinocyte line HaCaT. J Biol Chem 282:6126–6135. doi: 10.1074/jbc.M610529200. [DOI] [PubMed] [Google Scholar]
- 80.Geller DA, Lowenstein CJ, Shapiro RA, Nussler AK, Di Silvio M, Wang SC, Nakayama DK, Simmons RL, Snyder SH, Billiar TR. 1993. Molecular cloning and expression of inducible nitric oxide synthase from human hepatocytes. Proc Natl Acad Sci U S A 90:3491–3495. doi: 10.1073/pnas.90.8.3491. [DOI] [PMC free article] [PubMed] [Google Scholar]
- 81.Heinrich PC, Behrmann I, Muller-Newen G, Schaper F, Graeve L. 1998. Interleukin-6-type cytokine signaling through the gp130/Jak/STAT pathway. Biochem J 334:297–314. [DOI] [PMC free article] [PubMed] [Google Scholar]
Associated Data
This section collects any data citations, data availability statements, or supplementary materials included in this article.