

Abstract
Two-component gene regulatory systems (TCSs) are a major mechanism by which bacteria respond to environmental stimuli and thus are critical to infectivity. For example, the control of virulence regulator/sensor kinase (CovRS) TCS is central to the virulence of the major human pathogen group A Streptococcus (GAS). Here, we used a combination of quantitative in vivo phosphorylation assays, isoallelic strains that varied by only a single amino acid in CovS, and transcriptome analyses to characterize the impact of CovS on CovR phosphorylation and GAS global gene expression. We discovered that CovS primarily serves to phosphorylate CovR, thereby resulting in the repression of virulence factor-encoding genes. However, a GAS strain selectively deficient in CovS phosphatase activity had a distinct transcriptome relative to that of its parental strain, indicating that both CovS kinase and phosphatase activities influence the CovR phosphorylation status. Surprisingly, compared to a serotype M3 strain, serotype M1 GAS strains had high levels of phosphorylated CovR, low transcript levels of CovR-repressed genes, and strikingly different responses to environmental cues. Moreover, the inactivation of CovS in the serotype M1 background resulted in a greater decrease in phosphorylated CovR levels and a greater increase in the transcript levels of CovR-repressed genes than did CovS inactivation in a serotype M3 strain. These data clarify the influence of CovS on the CovR phosphorylation status and provide insight into why serotype M1 GAS strains have high rates of spontaneous mutations in covS during invasive GAS infection, thus providing a link between TCS molecular function and the epidemiology of deadly bacterial infections.
INTRODUCTION
Two-component gene regulatory systems (TCSs) are a major mechanism by which bacteria detect and respond to external stimuli (1, 2). Although there is a diverse array of TCS types, in the canonical TCS, a membrane-embedded histidine kinase reacts to an extracellular signal by altering the phosphorylation status of an aspartate (Asp) residue on a cognate response regulator (3). Alteration of the phosphorylation status of the response regulator Asp in turn modulates gene expression (3). Although TCSs have been extensively studied over the past 25 years, much remains to be learned about how these systems influence bacterial pathogenesis (4, 5). An increased understanding of the molecular mechanisms underlying how TCSs affect bacterial host-pathogen interactions is important inasmuch as TCSs have been identified as potential targets for novel antimicrobials (6, 7).
Among the most extensively studied TCSs in terms of contributions to bacterial infectivity is the control of virulence regulator/sensor kinase (CovRS; also known as CsrRS) of group A Streptococcus (GAS) (2, 8, 9). GAS, also called Streptococcus pyogenes, is a Gram-positive bacterium that causes a diverse array of human infections ranging from uncomplicated pharyngitis (i.e., strep throat) to the highly lethal necrotizing fasciitis (i.e., flesh-eating disease) (10). GAS is classified into >140 M serotypes based on sequencing of the emm gene, which encodes the antiphagocytic cell surface M protein (11). The expression of ∼15% of the GAS genome is influenced by CovRS, including genes encoding key virulence factors such as the antiphagocytic hyaluronic acid capsule (of which hasA is the initial gene), the interleukin-8 (IL-8)-cleaving enzyme PrtS (also called Streptococcus pyogenes cell envelope protease [SpyCEP]), and the plasminogen-activating enzyme streptokinase (Ska) (12, 13). Large-scale, whole-genome analyses have established that the covRS genes are among those most often mutated in clinical GAS isolates and that GAS strains with covRS mutations are preferentially recovered from invasive (e.g., bloodstream) rather than mucosal (e.g., oropharynx) sites (14–16). In concert with these clinical observations, under laboratory conditions, the CovRS system mainly serves to repress virulence factor production, and in mice, GAS strains with covRS mutations are generally hypervirulent (17, 18). In addition to being central to GAS pathogenesis, CovRS homologs are also critical for the infectivity of group B Streptococcus (19), the leading cause of invasive disease in human neonates.
Despite numerous investigations, a comprehension of fundamental aspects of the CovRS system remains elusive. For example, it has been established that Asp53 is a key site of CovR phosphorylation resulting in CovR-mediated repression of virulence factor-encoding genes (20, 21). However, whether CovS actually influences the CovR phosphorylation status is unknown, as the phenotypes of CovS- and CovR-inactivated strains are distinct (22). Similarly, although CovR inactivation consistently results in hypervirulent GAS strains, the effect of CovS on GAS virulence varies depending on the parental strain (23–26). Finally, although it is known that hypervirulent strains with covRS mutations emerge from distinct parental GAS strains at different frequencies, a mechanism explaining this observation is lacking (27, 28).
Recently, our laboratory used Phos-Tag technology (29) to provide the first qualitative evidence that GAS CovR is phosphorylated in vivo (20). Here, we extend our study of CovR phosphorylation by using quantitative assays to address key knowledge gaps regarding how CovS influences the CovR phosphorylation status, which in turn determines global GAS expression and infectivity. We demonstrate that CovS affects CovR phosphorylation and does so primarily by phosphorylating rather than dephosphorylating CovR. Using isoallelic strains with specific mutations in CovS, we defined clusters of GAS virulence factor-encoding genes that have a differential response to changes in CovR phosphorylation levels. Finally, we discovered that, compared to serotype M3 strains, CovR phosphorylation levels are increased in serotype M1 strains that have a particular predisposition to develop covS mutations during invasive GAS infection and that CovS activity in response to external signals differs significantly between these two serotypes. Taken together, these data provide a new platform for understanding how the TCS regulator phosphorylation status affects life-threatening bacterial infections.
MATERIALS AND METHODS
Bacterial strains and culture media.
The strains used in this work are presented in Table 1, and primers used for strain creation are listed in Table S3 in the supplemental material. Strains were grown in a nutrient-rich standard laboratory medium (Todd-Hewitt broth with 0.2% yeast extract [THY]) at 37°C in 5% CO2 with 15 mM MgCl2 or 100 nM LL-37 added when noted to create high-Mg2+ or LL-37-supplemented conditions, respectively (2). THY without supplemental MgCl2 was previously determined to have an Mg2+ concentration of ∼1 mM (30). When appropriate, chloramphenicol was added at 10 μg/ml. Strains MGAS10870, MGAS9937 (both serotype M3), and MGAS2221 (serotype M1) were previously described and are known to contain a wild-type covRS operon (14, 17). SGAS0004 is a serotype M1 strain that caused a case of bacteremia in Houston, TX, in 2012, and Sanger sequencing was used to determine that SGAS0004 contains a wild-type covRS operon. Strains 10870ΔcovS, 2221ΔcovS, GAS-SC-1 (covRS wild-type progenitor of GAS-LC-1), and GAS-LC-1 were previously described (17, 20, 24). Derivatives of strain MGAS10870 that differed only by the presence of a single-amino-acid replacement in CovS were created by using chloramphenicol-resistant, temperature-sensitive plasmid pJL1055 (gift of D. Kasper), as described previously (31).
TABLE 1.
Strains used in this study
| Strain | Description (serotype) | Reference |
|---|---|---|
| MGAS10870 | Clinical isolate (M3); CovRS wild type | 14 |
| 10870ΔcovS | MGAS10870 ΔcovS::aphA3 | 20 |
| CovS-H280V | MGAS10870 with covS encoding Val at position 280 | This study |
| CovS-E281A | MGAS10870 with covS encoding Ala at position 281 | This study |
| CovS-T284A | MGAS10870 with covS encoding Ala at position 284 | This study |
| CovS-I332V | MGAS10870 with covS encoding Val at position 332 | This study |
| CovS-G457V | MGAS10870 with covS encoding Val at position 457 | This study; 17 |
| MGAS2221 | Clinical isolate (M1); CovRS wild type | |
| 2221ΔcovS | MGAS2221 with 7-bp insert in covS | 43 |
| SGAS0004 | Clinical isolate (M1); CovRS wild type | This study |
| MGAS9937 | Clinical isolate (M3); CovRS wild type | 14 |
| GAS-SC-1 | Mucosal isolate (M1); CovRS wild type | 24 |
| GAS-LC-1 | Invasive isolate; SC-1 with 12-bp insert in covS | 24 |
Whole-genome sequencing.
Strain MGAS10870 was previously sequenced and compared to the fully sequenced M3 strain MGAS315 by using a short-read approach (14). To facilitate the assembly of the MGAS10870 genome, we used a large-insert PacBio library preparation according to guidelines for preparing 20-kb SMRTbell templates (version 2) and the procedure and checklist for 20-kb template preparation using BluePippin size selection (version 3) (Pacific Biosciences). SMRTbell templates were subjected to standard single-molecule real-time (SMRT) sequencing by using an engineered phi29 DNA polymerase on the PacBio RS system according to the manufacturer's protocol. Following the assembly of the MGAS10870 genome into a single contig, the previously characterized short-read data were used to correct base-calling errors generated by the PacBio approach (32). Annotation of the closed MGAS10870 genome was performed by using RAST (33), and the transfer of homologous annotations from the previously sequenced MGAS315 genome (GenBank accession number NC_004070) was performed by using CLCBio Genomics Workbench v 7.0.3 (Qiagen). Whole-genome characterization of the CovS-isoallelic strains was performed by using the Ion Torrent PGM 400 sequencing kit (Life Technologies) on an Ion 318 V2 chip. Reads were assembled onto the MGAS10870 genome with an average sequencing depth of 136-fold, and polymorphisms were called by using Geneious version 6.1. The only identified polymorphisms for each isoallelic strain were the intended mutations.
Detection of CovR phosphorylation status in vivo.
Recombinant CovR was produced and phosphorylated as described previously (34). GAS lysates were prepared and separated on 10% Phos-Tag SDS-polyacrylamide gels, and unphosphorylated/phosphorylated CovR proteins were detected by using a polyclonal anti-CovR antibody as described previously (20), with the following modifications: (i) 20 μg total protein (as determined by a Bradford assay [35]) was loaded per sample, (ii) Odyssey blocking buffer (Li-Cor Biosciences) was used for blocking, and (iii) IRDye800CW goat anti-rabbit secondary antibody (Li-Cor Biosciences) was used at a 1:60,000 dilution. Blots were scanned by an infrared fluorescence technique using the Odyssey Classic imaging system, and phosphorylated CovR (CovR∼P) levels were quantified by using Image Studio software version 2.1 (Li-Cor Biosciences). Independent Western blots were repeated at least twice (see Table S1 in the supplemental material for phosphorylation rates and numbers of independent assays for each strain and condition). Comparison of CovR∼P levels under various conditions or among various strains was performed by using a two-sample t test (unequal variance), with a P value of <0.05 being considered statistically significant. We previously showed the specificity of the anti-CovR antibody for CovR as well as the ability of Phos-Tag/Western immunoblotting to distinguish between phosphorylated and unphosphorylated CovR (20). The total CovR level was determined by using anti-CovR antibody for Western immunoblotting after standard SDS-PAGE, with the cytosolic HPr protein being used as a loading control.
Transcript level analysis.
RNA was purified from various GAS strains grown to the indicated growth phase by using an RNeasy minikit (Qiagen). One microgram of RNA per sample was converted to cDNA by using a high-capacity reverse transcription kit (Applied Biosystems). TaqMan quantitative real-time PCR (qRT-PCR) (primers and probes are listed in Table S3 in the supplemental material) was performed on an Applied Biosystems Step-One Plus system as described previously (20). All samples were tested at least in duplicate on two separate occasions and analyzed in duplicate. To compare gene transcript levels between the wild type and the various derivative strains, a two-sample t test (unequal variance) was applied, with a P value of <0.05 and a mean transcript level of at least a 2.0-fold change being considered statistically significant.
For RNA sequencing (RNA-Seq) analysis, strains were grown in quadruplicate to mid-exponential (ME) phase in THY supplemented with 15 mM MgCl2, and RNA was isolated as described above for TaqMan qRT-PCR. RNA-Seq data analysis was performed as described previously, using the MGAS10870 genome as the template (20). A total of 79 of 1,853 (4.3%) genes were excluded from the analysis because of low expression levels. Transcript levels were considered significantly different if the mean transcript level difference was ≥2.0-fold and the final, adjusted P value was <0.05.
Microarray data accession number.
Microarray data have been deposited in the GEO database under accession number GSE65226.
RESULTS
Genetic inactivation of covS decreases but does not eliminate CovR phosphorylation.
Since the identification of the covRS operon some 16 years ago (36), the question has been whether CovS influences CovR phosphorylation and, if so, whether CovS mainly phosphorylates or dephosphorylates CovR. To address this crucial issue, we measured phosphorylated CovR levels (CovR∼P/total CovR) in cell lysates of the serotype M3 GAS strain MGAS10870 and its isogenic covS deletion derivative using a combination of Phos-Tag gels and a near-infrared fluorescence Western blot technique that allows improved sensitivity and a broad quantifiable linear range of signal compared to the conventional enzyme-based assay that we previously employed (37). Phos-Tag gels selectively retard the migration of phosphorylated proteins through the gel matrix, thereby allowing distinction between phosphorylated and unphosphorylated protein isoforms (29). A comparison of representative Western blots using both techniques is presented in Fig. 1A and B. CovR phosphorylation followed a highly similar profile in the wild-type and covS-deficient strains, with CovR∼P levels being slightly elevated during late exponential phase compared to those during mid-exponential (ME) and stationary phases. Importantly, however, at all growth phases, CovR∼P levels were significantly lower in strain 10870ΔcovS than in strain MGAS10870 (Fig. 1; see also Table S1 in the supplemental material, which provides details on how often each experiment was performed, the measured CovR∼P levels, and the standard deviations of CovR∼P measurements). Interestingly, CovS inactivation did not completely eliminate CovR phosphorylation, which made up ∼20% of the total CovR in strain 10870ΔcovS (Fig. 1). These data provide the first evidence that CovS influences CovR∼P levels in vivo and that, under the conditions studied, the CovR∼P level is increased in the presence of CovS, indicating that CovS mainly serves to phosphorylate CovR. However, these data also reveal that CovR∼P production is not completely dependent on CovS, in concert with the idea that CovS is not the only factor contributing to CovR phosphorylation in vivo (22).
FIG 1.
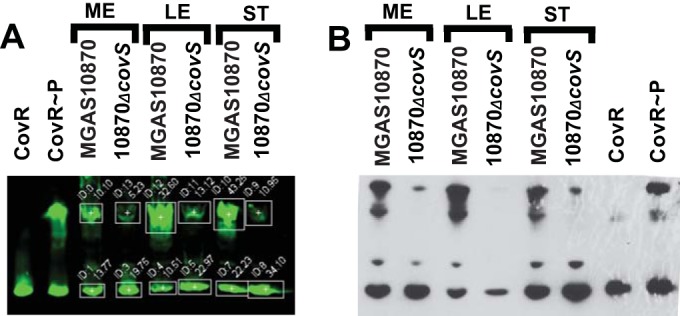
Comparison of near-infrared fluorescence (A) and conventional enzyme-based (B) Western blots depicting the role of CovS in CovR phosphorylation in vivo. Cell lysates equivalent to 20 μg (A) or 70 μg (B) total protein were separated by Phos-Tag SDS-PAGE, with unphosphorylated/phosphorylated recombinant CovR protein as a control. CovR species were detected by using anti-CovR antibody. Box settings used for determinations of CovR∼P levels via photon quantification are shown in panel A. ME, mid-exponential growth phase (OD = 0.6); LE, late exponential growth phase (OD = 1.2); ST, stationary growth phase (OD = 1.5).
High-magnesium growth conditions increase CovR∼P levels in a CovS-dependent manner.
Previously, Gryllos et al. observed increased CovR-mediated repression of key GAS virulence factor-encoding genes during growth in THY supplemented with 15 mM MgCl2 (high-Mg2+ conditions) compared to that during growth in THY (low-Mg2+ conditions) (13, 30). Thus, we next tested the hypothesis that this increased repression is due to elevated CovR∼P levels imparted by a functional CovS protein. To this end, cells of strains MGAS10870 and 10870ΔcovS were grown under low- and high-Mg2+ conditions, and their CovR∼P levels were assayed. Given that the observed effects of the covS deletion on CovR phosphorylation were similar in all growth phases (Fig. 1), we focused our analysis on the ME phase (optical density [OD] of ∼0.6). As predicted, CovR∼P levels in MGAS10870 were considerably higher in cells grown under high-Mg2+ than under low-Mg2+ conditions (Fig. 2A). In contrast, a change of the Mg2+ concentration in the growth medium had no effect on CovR∼P levels in strain 10870ΔcovS (Fig. 2A). Hence, the greatest difference in CovR∼P levels between the wild-type and covS-inactivated derivative strains was observed under high-Mg2+ conditions.
FIG 2.

High-Mg2+ conditions increase CovR∼P levels dependent on the presence of an intact CovS protein without influencing CovR production. (A) Representative Western blot (top) and bar representation (bottom) showing in vivo CovR∼P levels (means ± standard deviations; n ≥ 2), as determined by near-infrared fluorescence measurements, in the indicated strains grown to ME phase under either low- or high-Mg2+ conditions. Strain 10870ΔcovR served as a control for the specificity of the anti-CovR antibody. Twenty micrograms of protein from the indicated cell lysates was separated by Phos-Tag SDS-PAGE, and CovR species were detected by using anti-CovR antibody. * indicates a P value of <0.05 for comparison of CovR∼P levels under the two conditions. (B) Western blot of cell lysates of MGAS10870 and 10870ΔcovR following SDS-PAGE using anti-CovR antibody as well as anti-HPr antibody as an internal loading control. (C) TaqMan qRT-PCR measurements (means ± standard deviations; n = 8) of covR and covS transcript levels relative to the level of the endogenous control gene tufA in strain MGAS10870 grown to the indicated growth phases and under the conditions noted in the legend of Fig. 1.
Growth phase- and medium-dependent variations in CovR∼P levels are not due to differences in CovR/S levels.
In addition to observing high CovR∼P levels during the transition from low- to high-Mg2+ conditions, we also noted a small, but consistent, increase in CovR∼P levels in both strains MGAS10870 and 10870ΔcovS in the late exponential compared to the mid-exponential or stationary growth phase (Fig. 1). One possible explanation for the growth phase- and medium-dependent variations in the CovR∼P level is an alteration of the total CovR level, as was recently demonstrated for PhoB of Escherichia coli (38). However, we found no significant differences in covR transcript or CovR protein levels, as determined by SDS-PAGE, between any of the growth phases or growth conditions tested for strain MGAS10870 (Fig. 2B and C). Additionally, we also measured the covS transcript levels in the same three growth stages and under low- and high-Mg2+ conditions. As observed for covR, the covS transcript level was not significantly different depending upon the growth phase or the different media (Fig. 2C). Thus, altered levels of the CovRS system are unlikely to be responsible for the observed changes in CovR∼P levels.
CovS has both kinase and phosphatase activities.
CovS is a member of the HisKA family of histidine kinase proteins, which includes the well-studied EnvZ protein of E. coli (39). HisKA family proteins typically possess both kinase and phosphatase activities, which can be studied in isolation by targeted mutations of distinct amino acid residues specifically critical to either kinase or phosphatase function (39). Thus, we next created isoallelic derivative strains of MGAS10870 with defined covS mutations to further investigate how CovS affects CovR phosphorylation. The mutated CovS residues were chosen on the basis of amino acid sequence alignments of CovS with EnvZ (the most thoroughly characterized HisKA family member) and CpxA (the closest CovS homolog with a reported structure based on I-Tasser prediction) (40) (see Fig. S1 in the supplemental material). His280, the predicted site of CovS autophosphorylation and subsequent phosphotransfer to CovR Asp53 (2), and Gly457, which is part of the G2 box important for kinase function (41), were mutated to valine to create the CovS-H280V and CovS-G457V strains, respectively (Fig. 3A and Table 1). Glu281 and Thr284, which are predicted to be critical to kinase and phosphatase activities, respectively (39), were each changed to alanine (CovS-E281A and CovS-T284A strains, respectively) (Fig. 3A and Table 1). To confirm that our strain creation approach did not result in the introduction of spurious mutations, we completed the genome of strain MGAS10870, which previously had been sequenced in comparison to the fully sequenced serotype M3 strain MGAS315, using a short-read approach (14). We then sequenced the isoallelic strains via a short-read approach using the MGAS10870 genome as a template and confirmed that only the mutations of interest had been created.
FIG 3.

Impact of distinct amino acid substitutions in CovS on CovR∼P levels. (A) Structural model of the CovS cytosolic domain dimer predicted by I-Tasser. The HAMP (present in histidine kinases, adenylate cyclases, methyl-accepting proteins, and phosphatases) linker, dimerization and histidine phosphorylation (DHp), and catalytic (CA) domains are labeled and shown in blue, cyan, and light blue (and in black, gray, and light gray for the other monomer), respectively. Amino acid residues that were mutated in this study and that are predicted to be involved in CovS kinase and phosphatase activities are mapped on the structural model as magenta and yellow spheres, respectively, and labeled. (B and C, top) Representative Western blots of 20 μg of protein from cell lysates of the indicated strains grown to ME phase under high-Mg2+ conditions (B) or as indicated (C) and separated by Phos-Tag SDS-PAGE. CovR species were detected by using anti-CovR antibody. (Bottom) Bar representations show CovR∼P levels (means ± standard deviations; n ≥ 2) determined by near-infrared fluorescence measurements. * indicates a P value of <0.05 for CovR∼P levels of the labeled strain relative to those of parental strain MGAS10870 (B) or of the indicated strain under high- versus low-Mg2+ conditions (C).
By qRT-PCR analysis, we detected no significant difference in covS transcript levels between the wild type and the isoallelic CovS variants (data not shown).
During growth under high-Mg2+ conditions, CovR∼P levels in the CovS-H280V, CovS-E281A, and CovS-G457V strains were significantly lower than those in strain MGAS10870 and similar to those observed for strain 10870ΔcovS (Fig. 3B). Interestingly, the CovS-T284A strain, which is predicted to lack phosphatase activity, had reproducibly higher CovR∼P levels than those of the parental strain, which was particularly apparent during growth in THY (i.e., low-Mg2+ conditions) (Fig. 3C). Unlike the situation for the wild type, CovR∼P levels were identical in CovS-T284A cells grown under low- and high-Mg2+ conditions, suggesting that a high Mg2+ concentration increases CovR∼P levels primarily by impairing CovS phosphatase activity rather than stimulating kinase activity (Fig. 3C). Mathematical modeling predicted that CovS phosphatase activity is not a major contributor to CovR∼P levels (42), but the experimental data indicate that CovS possesses significant phosphatase activity, which is T284 dependent.
CovS kinase- and phosphatase-deficient isoallelic strains have distinct transcriptomes.
We used RNA-Seq analysis of growth under high-Mg2+ conditions to gain insight into the consequences of the altered CovR∼P levels observed for our isoallelic strains on GAS global gene expression. By principal component analysis, biological replicates of strain 10870ΔcovS and the CovS-H280V, CovS-E281A, and CovS-G457A strains (referred to as kinase-deficient strains) clustered together, while biological replicates of the phosphatase-deficient CovS-T284A strain were most distant from this four-strain cluster, and replicates of wild-type strain MGAS10870 grouped in the middle (Fig. 4A). For each of the five MGAS10870 derivative strains, there were a minimum of 103 genes that had significantly different transcript levels compared to those in the parental strain, with the least number of differentially transcribed genes being observed for the CovS-T284A strain, whereas strain 10870ΔcovS had the most (147 genes) (see Table S2 in the supplemental material). CovS-influenced genes grouped into two main categories, which were largely concordant with those previously identified as being repressed and activated by CovS, respectively, in a serotype M1 strain (43). Group I comprised genes whose transcript levels were increased in the kinase-deficient strains compared to those in parental strain MGAS10870 and included known CovR-repressed genes such as hasA, prtS, and slo, which encodes the pore-forming cytotoxin streptolysin O (Fig. 4B). In contrast, transcript levels for group II, which included the protein G-related α2-macroglobulin-binding-encoding gene grab, were decreased in the kinase-deficient strains relative to those in strain MGAS10870 (Fig. 4B). This group also included the newly identified CovS-influenced genes mf2 and speC, which are colocated on a prophage in strain MGAS10870 and encode an actively secreted DNase and a pyrogenic exotoxin, respectively (44). Each group could be subdivided by transcript levels into two additional gene clusters in the CovS-T284A strain relative to MGAS10870, presumably based on the differential response to the increasing CovR∼P levels resulting from decreased CovS phosphatase activity. For the majority of CovS-influenced genes, transcript levels were either significantly lower (group I) or higher (group II) in the CovS-T284A strain than in MGAS10870. Conversely, the transcript levels of CovS-influenced genes such as the superantigen-encoding gene speA3 and mf2 did not differ significantly between the two strains (Fig. 4B; see also Table S2 in the supplemental material). qRT-PCR confirmed the transcript level pattern observed for selected CovR∼P-repressed (i.e., group I) (Fig. 4C) and -activated (i.e., group II) (Fig. 4D) genes. These data demonstrate the key role that differential CovR∼P levels play in GAS global gene expression and show that even under high-Mg2+ conditions, CovS retains sufficient phosphatase activity to significantly affect the GAS transcriptome.
FIG 4.

Effects of single-amino-acid substitutions in CovS on GAS gene expression. (A) Principal component analysis of RNA-Seq data derived from the indicated strains grown in quadruplicate to ME phase under high-Mg2+ conditions. (B) Heat map of log2 transcript levels of selected genes for the indicated strains relative to those for strain MGAS10870. The color value scheme is shown at the bottom. I and II refer to gene groupings delineated in the text. (C and D) Transcript levels (means ± standard deviations; n = 8) of selected genes from group I (C) and group II (D) in the indicated strains relative to those in strain MGAS10870, as measured by TaqMan qRT-PCR.
CovR∼P levels and changes in CovR∼P levels in response to environmental stimuli differ between serotype M1 and M3 strains.
Serotype M3 strains, such as MGAS10870, produce large amounts of hyaluronic acid capsule and have been associated with higher mortality rates (45, 46), whereas serotype M1 strains are generally the most common cause of both noninvasive and invasive GAS infections (16, 47). Thus, we sought to determine whether serotype M1 and M3 strains differ in their CovR∼P levels under distinct conditions. To this end, the CovRS wild-type strains MGAS10870 (serotype M3) and MGAS2221 (serotype M1) were grown in THY, high-Mg2+ THY, or THY with a sublethal dose of the human antimicrobial peptide LL-37. This dose of LL-37 was previously shown to relieve CovR-mediated gene repression in a CovS-dependent manner (2). Surprisingly, CovR∼P levels as well as the impacts of distinct growth media differed between the strains of the two GAS serotypes (Fig. 5A). For MGAS10870, we observed the expected increase in CovR∼P levels with Mg2+ supplementation, but no significant difference in CovR∼P levels occurred in LL-37-supplemented medium compared to standard THY (Fig. 5A). Conversely, Mg2+ supplementation did not alter CovR∼P levels in strain MGAS2221, whereas LL-37 resulted in a significant decrease in CovR∼P levels (Fig. 5A). Moreover, we detected a substantially higher level of CovR∼P in MGAS2221 than in MGAS10870, particularly under low-Mg2+ conditions (∼70% versus ∼40%) (Fig. 5A). The same pattern was also observed for the serotype M3 strain MGAS9937 and the serotype M1 strain SGAS0004 (Fig. 5B), indicating a serotype-specific variance in CovR∼P levels and the response to environmental stimuli.
FIG 5.

Comparison of CovR∼P and gene expression levels in serotype M3 and M1 strains. Strains were grown to ME phase in THY and THY supplemented with either 15 mM MgCl2 (Mg2+) or 100 mM LL-37 (LL-37). (A and B, top) Representative Western blots of 20 μg protein from cell lysates of the indicated strains separated by Phos-Tag SDS PAGE and probed with anti-CovR antibody. (Bottom) Bar representation of CovR∼P levels (means ± standard deviations; n ≥ 2) determined by near-infrared fluorescence measurements. (C and D) Gene transcript levels (means ± standard deviations; n = 8) of selected genes in the indicated strains relative to those of the endogenous control gene tufA, as measured by TaqMan qRT-PCR. * denotes a significant difference in CovR∼P (A and B) or gene transcript (C and D) levels under a particular growth condition compared to growth in THY for that same strain. ** denotes a significant difference in CovR∼P (A and B) or gene transcript (C and D) levels for the indicated strain during growth in THY compared to those for strain MGAS10870.
The differences in CovR∼P levels between the serotype M3 and M1 strains correlated with gene expression levels. Specifically, in unsupplemented THY, transcript levels of hasA and prtS were significantly higher in strain MGAS10870 than in strain MGAS2221 (Fig. 5C and D). Moreover, hasA and prtS levels decreased with Mg2+ supplementation in strain MGAS10870 but not in strain MGAS2221 (Fig. 5C and D), whereas hasA and prtS levels increased with the addition of LL-37 in strain MGAS2221, but no change was observed for strain MGAS10870 (Fig. 5C and D). Although the CovR amino acid sequences of serotype M1 and M3 GAS strains are identical, the CovS sequences differ by a single amino acid at position 332 (I in serotype M3 strains and V in serotype M1 strains) (14, 16). However, consistent with the conservative nature of an I-to-V substitution, we observed no significant difference in CovR∼P (data not shown) or hasA or prtS transcript levels between strain MGAS10870 and its CovS-I332V derivative strain (i.e., MGAS10870 with a serotype M1 CovS sequence) under any of the conditions tested (Fig. 5C and D). Thus, for the strains tested here, serotype M1 strains have high CovR∼P levels in unsupplemented THY and have a different CovR∼P response to CovS-sensed environmental stimuli compared to those of serotype M3 strains, but this difference is not due to variation in the CovR/S amino acid sequence.
covS inactivation results in greater changes in CovR∼P and gene transcript levels in serotype M1 than in serotype M3 strains.
Invasive GAS strains often have inactivating mutations in covS (23), which are thought to impart a selective survival advantage against the host immune system due to the increased production of key CovR-repressed virulence factors (48). The currently dominating type of serotype M1 GAS, the so-called M1T1 GAS, is particularly predisposed to develop inactivating covS mutations during invasive infection (49). We found that covS inactivation significantly decreased CovR∼P levels in both strains MGAS2221 (M1T1) and MGAS10870 (serotype M3) cells grown in THY (Fig. 6A). However, the inactivation of covS in strain MGAS2221 resulted in a proportionally greater decrease in CovR∼P levels (∼41% versus ∼20%) (Fig. 6A; see also Table S1 in the supplemental material) and a significantly greater increase in transcript levels of the CovR-repressed genes hasA, prtS, and slo than did covS inactivation in strain MGAS10870 (Fig. 6B). To confirm that our observations are also applicable to covS mutations that arise in M1T1 GAS during human infection, we analyzed a pair of serotype M1 GAS clinical isolates from the mucosal surface and bloodstream samples from the same patient, which differ only by a covS-inactivating mutation (24). Indeed, the changes in CovR∼P levels and the gene expression profile of the M1T1 covS-inactivated strain that arose during human infection (GAS-LC-1) closely mirrored those observed for strain 2221ΔcovS (Fig. 6A and B). Taken together, the large drop in CovR∼P levels and therefore the significantly greater increases in the levels of CovR-repressed virulence factor-encoding genes observed following covS inactivation in the M1 strains provide a mechanistic explanation for the particular propensity of M1T1 GAS to develop covS mutations during invasive infection (27).
FIG 6.

Comparison of the effects of CovS inactivation on CovR∼P levels and gene expression in serotype M3 and M1 strains. (A, top) Representative Western blot of 20 μg protein from cell lysates of the indicated strains grown to ME phase in THY, separated by Phos-Tag SDS-PAGE, and probed by using anti-CovR antibody. (Bottom) Bar representation of CovR∼P levels (means ± standard deviations; n ≥ 2) determined by near-infrared fluorescence measurements. * indicates a P value of <0.05 for the difference in CovR∼P levels of the wild type and CovS-inactivated derivatives of MGAS2221 and GAS-SC-1 compared to those of strain MGAS10870 (outlined by brackets). (B) Transcript levels (means ± standard deviations; n = 8) of the indicated genes in the CovS-inactivated strains relative to those of the respective wild-type strains, as measured by TaqMan qRT-PCR. Strains were grown in THY to ME phase. * indicates a significant difference in the transcript level of the indicated gene for the labeled serotype M1 strain following CovS inactivation relative to the level for the serotype M3 strain MGAS10870.
DISCUSSION
The data presented here extend the understanding of the GAS CovRS system, which serves as a paradigm for understanding how TCSs influence bacterial pathogenesis (8). Our elucidation of the effect of CovS on CovR phosphorylation provides mechanistic explanations for a variety of key laboratory-based findings regarding the function and impact of the CovRS TCS that have accumulated over the past 16 years. First, our finding that covS inactivation decreases CovR∼P levels combined with previous observations regarding the critical role of CovR∼P in virulence factor repression (21) explain the hypervirulence of laboratory-generated CovS-deficient strains (17, 49). Second, our discovery that strains lacking an active CovS protein still contain detectable amounts of CovR∼P clarifies the longstanding observation of distinct phenotypes for CovR- and CovS-inactivated strains (18, 22, 50). Our data raise the question of which non-CovS factors contribute to CovR phosphorylation in vivo. There are several possibilities, including noncognate histidine kinases, the recently described serine-threonine kinase Stk (20, 51), and small molecular phosphodonors, such as acetyl phosphate. In light of our finding that CovR∼P levels vary throughout the growth cycle, acetyl phosphate is a particularly intriguing possibility given that it is a product of central metabolic processes, many of which are influenced by CovR (34), and because acetyl phosphate levels are known to vary over the course of the growth cycle of E. coli (34, 52). Given that we did not study the effect of purified CovS on CovR∼P, we cannot definitely state that CovS and the isoforms studied here influence CovR∼P levels only through direct phosphorylation or dephosphorylation. It remains possible that CovS could influence CovR∼P through cross talk with other phosphorylating proteins or by sequestration of CovR under certain conditions. Thus, further investigation into both CovS- and non-CovS-mediated aspects of CovR phosphorylation may extend the understanding of key mechanisms of response regulator phosphorylation control (53).
In addition to providing mechanisms for laboratory-based insights regarding the CovRS system, our study also augments the understanding of GAS molecular epidemiologic data. For example, serotype M3 GAS strains are particularly prone to causing severe invasive infections with high mortality rates in humans (46, 54), and a broad survey recently showed that serotype M3 strains produce higher levels of hyaluronic acid capsule than do serotype M1 strains (45). We found that the tested serotype M3 strains had low CovR∼P levels compared to those of the tested serotype M1 strains and had high expression levels of CovR-regulated virulence factors, such as hasA, which likely contributes to the high capsule levels and observed virulence of serotype M3 strains. Similarly, our data help explain the propensity of the currently dominating type of serotype M1 GAS, the so-called M1T1 GAS, to develop inactivating mutations in the covS gene leading to hypervirulence during invasive infection, which has been an area of active investigation for more than a decade (27, 28, 49, 55–59). As serotype M1 strains have higher CovR∼P levels than do serotype M3 strains, inactivation of CovS results in a proportionally greater decrease in CovR∼P levels (Fig. 6A). Thus, in the serotype M1 background, the inactivation of CovS produces a greater effect on alleviating CovR-mediated repression of GAS virulence factor-encoding genes, meaning that CovS inactivation would likely generate a greater selective advantage during invasive infection. Although there are certainly other differences between serotype M1 and M3 strains besides CovR∼P levels that are critical to the above-mentioned clinical observations (e.g., phage content), the key role of the CovRS system in GAS pathogenesis suggests that the alteration of CovR∼P levels is likely to play an important role in determining strain virulence and the magnitude of the selective pressure to inactivate CovS. These data establish a link between bacterial regulator phosphorylation levels and genetic polymorphisms induced by host-pathogen interactions, which may well apply to numerous prokaryotes, as signaling systems are often identified as being “hot spots” for mutations in pathogenic bacteria (16, 60, 61).
In summary, we have identified that the main role of CovS is to phosphorylate CovR, and thus, CovS-inactivated GAS strains have decreased CovR∼P levels. Our data also reveal that the phosphorylation baseline of bacterial response regulators can vary independently of the cognate histidine kinase and that such variation may provide insight into the molecular epidemiology of invasive bacterial infections in humans. Similar approaches could be used to more fully elucidate the pathogenic contributions of a wide variety of bacterial signaling systems.
Supplementary Material
ACKNOWLEDGMENTS
This work was supported by the National Institute of Allergy and Infectious Diseases at the National Institutes of Health (grant R01AI089891 to Samuel A. Shelburne and grant R01AI087747 to Paul Sumby), the Chapman Foundation, and MD Anderson Cancer Center support grant P30 CA016672 (Bioinformatics Shared Resource).
Footnotes
Supplemental material for this article may be found at http://dx.doi.org/10.1128/IAI.02659-14.
REFERENCES
- 1.Dalebroux ZD, Matamouros S, Whittington D, Bishop RE, Miller SI. 2014. PhoPQ regulates acidic glycerophospholipid content of the Salmonella Typhimurium outer membrane. Proc Natl Acad Sci U S A 111:1963–1968. doi: 10.1073/pnas.1316901111. [DOI] [PMC free article] [PubMed] [Google Scholar]
- 2.Tran-Winkler HJ, Love JF, Gryllos I, Wessels MR. 2011. Signal transduction through CsrRS confers an invasive phenotype in group A Streptococcus. PLoS Pathog 7:e1002361. doi: 10.1371/journal.ppat.1002361. [DOI] [PMC free article] [PubMed] [Google Scholar]
- 3.Stock AM, Robinson VL, Goudreau PN. 2000. Two-component signal transduction. Annu Rev Biochem 69:183–215. doi: 10.1146/annurev.biochem.69.1.183. [DOI] [PubMed] [Google Scholar]
- 4.Baruch M, Belotserkovsky I, Hertzog BB, Ravins M, Dov E, McIver KS, Le Breton YS, Zhou Y, Cheng CY, Hanski E. 2014. An extracellular bacterial pathogen modulates host metabolism to regulate its own sensing and proliferation. Cell 156:97–108. doi: 10.1016/j.cell.2013.12.007. [DOI] [PMC free article] [PubMed] [Google Scholar]
- 5.Wang B, Zhao A, Novick RP, Muir TW. 2014. Activation and inhibition of the receptor histidine kinase AgrC occurs through opposite helical transduction motions. Mol Cell 53:929–940. doi: 10.1016/j.molcel.2014.02.029. [DOI] [PMC free article] [PubMed] [Google Scholar]
- 6.Tang YT, Gao R, Havranek JJ, Groisman EA, Stock AM, Marshall GR. 2012. Inhibition of bacterial virulence: drug-like molecules targeting the Salmonella enterica PhoP response regulator. Chem Biol Drug Des 79:1007–1017. doi: 10.1111/j.1747-0285.2012.01362.x. [DOI] [PMC free article] [PubMed] [Google Scholar]
- 7.Rasko DA, Moreira CG, Li DR, Reading NC, Ritchie JM, Waldor MK, Williams N, Taussig R, Wei S, Roth M, Hughes DT, Huntley JF, Fina MW, Falck JR, Sperandio V. 2008. Targeting QseC signaling and virulence for antibiotic development. Science 321:1078–1080. doi: 10.1126/science.1160354. [DOI] [PMC free article] [PubMed] [Google Scholar]
- 8.Churchward G. 2007. The two faces of Janus: virulence gene regulation by CovR/S in group A streptococci. Mol Microbiol 64:34–41. doi: 10.1111/j.1365-2958.2007.05649.x. [DOI] [PubMed] [Google Scholar]
- 9.Horstmann N, Sahasrabhojane P, Suber B, Kumaraswami M, Olsen RJ, Flores A, Musser JM, Brennan RG, Shelburne SA III. 2011. Distinct single amino acid replacements in the control of virulence regulator protein differentially impact streptococcal pathogenesis. PLoS Pathog 7:e1002311. doi: 10.1371/journal.ppat.1002311. [DOI] [PMC free article] [PubMed] [Google Scholar]
- 10.Carapetis JR, Steer AC, Mulholland EK, Weber M. 2005. The global burden of group A streptococcal diseases. Lancet Infect Dis 5:685–694. doi: 10.1016/S1473-3099(05)70267-X. [DOI] [PubMed] [Google Scholar]
- 11.Sanderson-Smith M, De Oliveira DM, Guglielmini J, McMillan DJ, Vu T, Holien JK, Henningham A, Steer AC, Bessen DE, Dale JB, Curtis N, Beall BW, Walker MJ, Parker MW, Carapetis JR, Van Melderen L, Sriprakash KS, Smeesters PR, M Protein Study Group . 2014. A systematic and functional classification of Streptococcus pyogenes that serves as a new tool for molecular typing and vaccine development. J Infect Dis 210:1325–1338. doi: 10.1093/infdis/jiu260. [DOI] [PMC free article] [PubMed] [Google Scholar]
- 12.Graham MR, Smoot LM, Migliaccio CA, Virtaneva K, Sturdevant DE, Porcella SF, Federle MJ, Adams GJ, Scott JR, Musser JM. 2002. Virulence control in group A Streptococcus by a two-component gene regulatory system: global expression profiling and in vivo infection modeling. Proc Natl Acad Sci U S A 99:13855–13860. doi: 10.1073/pnas.202353699. [DOI] [PMC free article] [PubMed] [Google Scholar]
- 13.Gryllos I, Grifantini R, Colaprico A, Jiang S, Deforce E, Hakansson A, Telford JL, Grandi G, Wessels MR. 2007. Mg(2+) signalling defines the group A streptococcal CsrRS (CovRS) regulon. Mol Microbiol 65:671–683. doi: 10.1111/j.1365-2958.2007.05818.x. [DOI] [PubMed] [Google Scholar]
- 14.Beres SB, Carroll RK, Shea PR, Sitkiewicz I, Martinez-Gutierrez JC, Low DE, McGeer A, Willey BM, Green K, Tyrrell GJ, Goldman TD, Feldgarden M, Birren BW, Fofanov Y, Boos J, Wheaton WD, Honisch C, Musser JM. 2010. Molecular complexity of successive bacterial epidemics deconvoluted by comparative pathogenomics. Proc Natl Acad Sci U S A 107:4371–4376. doi: 10.1073/pnas.0911295107. [DOI] [PMC free article] [PubMed] [Google Scholar]
- 15.Shea PR, Beres SB, Flores AR, Ewbank AL, Gonzalez-Lugo JH, Martagon-Rosado AJ, Martinez-Gutierrez JC, Rehman HA, Serrano-Gonzalez M, Fittipaldi N, Ayers SD, Webb P, Willey BM, Low DE, Musser JM. 2011. Distinct signatures of diversifying selection revealed by genome analysis of respiratory tract and invasive bacterial populations. Proc Natl Acad Sci U S A 108:5039–5044. doi: 10.1073/pnas.1016282108. [DOI] [PMC free article] [PubMed] [Google Scholar]
- 16.Nasser W, Beres SB, Olsen RJ, Dean MA, Rice KA, Long SW, Kristinsson KG, Gottfredsson M, Vuopio J, Raisanen K, Caugant DA, Steinbakk M, Low DE, McGeer A, Darenberg J, Henriques-Normark B, Van Beneden CA, Hoffmann S, Musser JM. 2014. Evolutionary pathway to increased virulence and epidemic group A Streptococcus disease derived from 3,615 genome sequences. Proc Natl Acad Sci U S A 111:E1768–E1776. doi: 10.1073/pnas.1403138111. [DOI] [PMC free article] [PubMed] [Google Scholar]
- 17.Sumby P, Whitney AR, Graviss EA, DeLeo FR, Musser JM. 2006. Genome-wide analysis of group A streptococci reveals a mutation that modulates global phenotype and disease specificity. PLoS Pathog 2:e5. doi: 10.1371/journal.ppat.0020005. [DOI] [PMC free article] [PubMed] [Google Scholar]
- 18.Engleberg NC, Heath A, Miller A, Rivera C, DiRita VJ. 2001. Spontaneous mutations in the CsrRS two-component regulatory system of Streptococcus pyogenes result in enhanced virulence in a murine model of skin and soft tissue infection. J Infect Dis 183:1043–1054. doi: 10.1086/319291. [DOI] [PubMed] [Google Scholar]
- 19.Whidbey C, Harrell MI, Burnside K, Ngo L, Becraft AK, Iyer LM, Aravind L, Hitti J, Waldorf KM, Rajagopal L. 2013. A hemolytic pigment of group B Streptococcus allows bacterial penetration of human placenta. J Exp Med 210:1265–1281. doi: 10.1084/jem.20122753. [DOI] [PMC free article] [PubMed] [Google Scholar]
- 20.Horstmann N, Saldana M, Sahasrabhojane P, Yao H, Su X, Thompson E, Koller A, Shelburne SA III. 2014. Dual-site phosphorylation of the control of virulence regulator impacts group A streptococcal global gene expression and pathogenesis. PLoS Pathog 10:e1004088. doi: 10.1371/journal.ppat.1004088. [DOI] [PMC free article] [PubMed] [Google Scholar]
- 21.Gusa AA, Gao J, Stringer V, Churchward G, Scott JR. 2006. Phosphorylation of the group A streptococcal CovR response regulator causes dimerization and promoter-specific recruitment by RNA polymerase. J Bacteriol 188:4620–4626. doi: 10.1128/JB.00198-06. [DOI] [PMC free article] [PubMed] [Google Scholar]
- 22.Dalton TL, Scott JR. 2004. CovS inactivates CovR and is required for growth under conditions of general stress in Streptococcus pyogenes. J Bacteriol 186:3928–3937. doi: 10.1128/JB.186.12.3928-3937.2004. [DOI] [PMC free article] [PubMed] [Google Scholar]
- 23.Ikebe T, Ato M, Matsumura T, Hasegawa H, Sata T, Kobayashi K, Watanabe H. 2010. Highly frequent mutations in negative regulators of multiple virulence genes in group A streptococcal toxic shock syndrome isolates. PLoS Pathog 6:e1000832. doi: 10.1371/journal.ppat.1000832. [DOI] [PMC free article] [PubMed] [Google Scholar]
- 24.Flores AR, Sahasrabhojane P, Saldana M, Galloway-Pena J, Olsen RJ, Musser JM, Shelburne SA. 2014. Molecular characterization of an invasive phenotype of group A streptococcus arising during human infection using whole genome sequencing of multiple isolates from the same patient. J Infect Dis 209:1520–1523. doi: 10.1093/infdis/jit674. [DOI] [PMC free article] [PubMed] [Google Scholar]
- 25.Tatsuno I, Okada R, Zhang Y, Isaka M, Hasegawa T. 2013. Partial loss of CovS function in Streptococcus pyogenes causes severe invasive disease. BMC Res Notes 6:126. doi: 10.1186/1756-0500-6-126. [DOI] [PMC free article] [PubMed] [Google Scholar]
- 26.Sugareva V, Arlt R, Fiedler T, Riani C, Podbielski A, Kreikemeyer B. 2010. Serotype- and strain-dependent contribution of the sensor kinase CovS of the CovRS two-component system to Streptococcus pyogenes pathogenesis. BMC Microbiol 10:34. doi: 10.1186/1471-2180-10-34. [DOI] [PMC free article] [PubMed] [Google Scholar]
- 27.Maamary PG, Sanderson-Smith ML, Aziz RK, Hollands A, Cole JN, McKay FC, McArthur JD, Kirk JK, Cork AJ, Keefe RJ, Kansal RG, Sun H, Taylor WL, Chhatwal GS, Ginsburg D, Nizet V, Kotb M, Walker MJ. 2010. Parameters governing invasive disease propensity of non-M1 serotype group A streptococci. J Innate Immun 2:596–606. doi: 10.1159/000317640. [DOI] [PMC free article] [PubMed] [Google Scholar]
- 28.Cole JN, Pence MA, von Kockritz-Blickwede M, Hollands A, Gallo RL, Walker MJ, Nizet V. 2010. M protein and hyaluronic acid capsule are essential for in vivo selection of covRS mutations characteristic of invasive serotype M1T1 group A Streptococcus. mBio 1(4):e00191-10. doi: 10.1128/mBio.00191-10. [DOI] [PMC free article] [PubMed] [Google Scholar]
- 29.Barbieri CM, Stock AM. 2008. Universally applicable methods for monitoring response regulator aspartate phosphorylation both in vitro and in vivo using Phos-tag-based reagents. Anal Biochem 376:73–82. doi: 10.1016/j.ab.2008.02.004. [DOI] [PMC free article] [PubMed] [Google Scholar]
- 30.Gryllos I, Levin JC, Wessels MR. 2003. The CsrR/CsrS two-component system of group A Streptococcus responds to environmental Mg2+. Proc Natl Acad Sci U S A 100:4227–4232. doi: 10.1073/pnas.0636231100. [DOI] [PMC free article] [PubMed] [Google Scholar]
- 31.Carroll RK, Shelburne SA III, Olsen RJ, Suber B, Sahasrabhojane P, Kumaraswami M, Beres SB, Shea PR, Flores AR, Musser JM. 2011. Naturally occurring single amino acid replacements in a regulatory protein alter streptococcal gene expression and virulence in mice. J Clin Invest 121:1956–1968. doi: 10.1172/JCI45169. [DOI] [PMC free article] [PubMed] [Google Scholar]
- 32.Koren S, Harhay GP, Smith TP, Bono JL, Harhay DM, McVey SD, Radune D, Bergman NH, Phillippy AM. 2013. Reducing assembly complexity of microbial genomes with single-molecule sequencing. Genome Biol 14:R101. doi: 10.1186/gb-2013-14-9-r101. [DOI] [PMC free article] [PubMed] [Google Scholar]
- 33.Aziz RK, Bartels D, Best AA, DeJongh M, Disz T, Edwards RA, Formsma K, Gerdes S, Glass EM, Kubal M, Meyer F, Olsen GJ, Olson R, Osterman AL, Overbeek RA, McNeil LK, Paarmann D, Paczian T, Parrello B, Pusch GD, Reich C, Stevens R, Vassieva O, Vonstein V, Wilke A, Zagnitko O. 2008. The RAST server: rapid annotations using subsystems technology. BMC Genomics 9:75. doi: 10.1186/1471-2164-9-75. [DOI] [PMC free article] [PubMed] [Google Scholar]
- 34.Shelburne SA, Olsen RJ, Suber B, Sahasrabhojane P, Sumby P, Brennan RG, Musser JM. 2010. A combination of independent transcriptional regulators shapes bacterial virulence gene expression during infection. PLoS Pathog 6:e1000817. doi: 10.1371/journal.ppat.1000817. [DOI] [PMC free article] [PubMed] [Google Scholar]
- 35.Bradford MM. 1976. A rapid and sensitive method for the quantitation of microgram quantities of protein utilizing the principle of protein-dye binding. Anal Biochem 72:248–254. doi: 10.1016/0003-2697(76)90527-3. [DOI] [PubMed] [Google Scholar]
- 36.Levin JC, Wessels MR. 1998. Identification of csrR/csrS, a genetic locus that regulates hyaluronic acid capsule synthesis in group A Streptococcus. Mol Microbiol 30:209–219. doi: 10.1046/j.1365-2958.1998.01057.x. [DOI] [PubMed] [Google Scholar]
- 37.Weldon S, Ambroz K, Schutz-Geschwender A, Olive DM. 2008. Near-infrared fluorescence detection permits accurate imaging of loading controls for Western blot analysis. Anal Biochem 375:156–158. doi: 10.1016/j.ab.2007.11.035. [DOI] [PubMed] [Google Scholar]
- 38.Gao R, Stock AM. 2013. Probing kinase and phosphatase activities of two-component systems in vivo with concentration-dependent phosphorylation profiling. Proc Natl Acad Sci U S A 110:672–677. doi: 10.1073/pnas.1214587110. [DOI] [PMC free article] [PubMed] [Google Scholar]
- 39.Willett JW, Kirby JR. 2012. Genetic and biochemical dissection of a HisKA domain identifies residues required exclusively for kinase and phosphatase activities. PLoS Genet 8:e1003084. doi: 10.1371/journal.pgen.1003084. [DOI] [PMC free article] [PubMed] [Google Scholar]
- 40.Zhang Y. 2008. I-TASSER server for protein 3D structure prediction. BMC Bioinformatics 9:40. doi: 10.1186/1471-2105-9-40. [DOI] [PMC free article] [PubMed] [Google Scholar]
- 41.Zhu Y, Inouye M. 2002. The role of the G2 box, a conserved motif in the histidine kinase superfamily, in modulating the function of EnvZ. Mol Microbiol 45:653–663. doi: 10.1046/j.1365-2958.2002.03061.x. [DOI] [PubMed] [Google Scholar]
- 42.Mitrophanov AY, Churchward G, Borodovsky M. 2007. Control of Streptococcus pyogenes virulence: modeling of the CovR/S signal transduction system. J Theor Biol 246:113–128. doi: 10.1016/j.jtbi.2006.11.009. [DOI] [PMC free article] [PubMed] [Google Scholar]
- 43.Trevino J, Perez N, Ramirez-Pena E, Liu Z, Shelburne SA III, Musser JM, Sumby P. 2009. CovS simultaneously activates and inhibits the CovR-mediated repression of distinct subsets of group A Streptococcus virulence factor-encoding genes. Infect Immun 77:3141–3149. doi: 10.1128/IAI.01560-08. [DOI] [PMC free article] [PubMed] [Google Scholar]
- 44.Broudy TB, Pancholi V, Fischetti VA. 2002. The in vitro interaction of Streptococcus pyogenes with human pharyngeal cells induces a phage-encoded extracellular DNase. Infect Immun 70:2805–2811. doi: 10.1128/IAI.70.6.2805-2811.2002. [DOI] [PMC free article] [PubMed] [Google Scholar]
- 45.Cao TN, Liu Z, Cao TH, Pflughoeft KJ, Trevino J, Danger JL, Beres SB, Musser JM, Sumby P. 2014. Natural disruption of two regulatory networks in serotype M3 group A Streptococcus isolates contributes to the virulence factor profile of this hypervirulent serotype. Infect Immun 82:1744–1754. doi: 10.1128/IAI.01639-13. [DOI] [PMC free article] [PubMed] [Google Scholar]
- 46.Sharkawy A, Low DE, Saginur R, Gregson D, Schwartz B, Jessamine P, Green K, McGeer A. 2002. Severe group A streptococcal soft-tissue infections in Ontario: 1992-1996. Clin Infect Dis 34:454–460. doi: 10.1086/338466. [DOI] [PubMed] [Google Scholar]
- 47.Steer AC, Law I, Matatolu L, Beall BW, Carapetis JR. 2009. Global emm type distribution of group A streptococci: systematic review and implications for vaccine development. Lancet Infect Dis 9:611–616. doi: 10.1016/S1473-3099(09)70178-1. [DOI] [PubMed] [Google Scholar]
- 48.Cole JN, Barnett TC, Nizet V, Walker MJ. 2011. Molecular insight into invasive group A streptococcal disease. Nat Rev Microbiol 9:724–736. doi: 10.1038/nrmicro2648. [DOI] [PubMed] [Google Scholar]
- 49.Walker MJ, Hollands A, Sanderson-Smith ML, Cole JN, Kirk JK, Henningham A, McArthur JD, Dinkla K, Aziz RK, Kansal RG, Simpson AJ, Buchanan JT, Chhatwal GS, Kotb M, Nizet V. 2007. DNase Sda1 provides selection pressure for a switch to invasive group A streptococcal infection. Nat Med 13:981–985. doi: 10.1038/nm1612. [DOI] [PubMed] [Google Scholar]
- 50.Dalton TL, Hobb RI, Scott JR. 2006. Analysis of the role of CovR and CovS in the dissemination of Streptococcus pyogenes in invasive skin disease. Microb Pathog 40:221–227. doi: 10.1016/j.micpath.2006.01.005. [DOI] [PubMed] [Google Scholar]
- 51.Agarwal S, Pancholi P, Pancholi V. 2011. Role of serine/threonine phosphatase (SP-STP) in Streptococcus pyogenes physiology and virulence. J Biol Chem 286:41368–41380. doi: 10.1074/jbc.M111.286690. [DOI] [PMC free article] [PubMed] [Google Scholar]
- 52.Wolfe AJ. 2010. Physiologically relevant small phosphodonors link metabolism to signal transduction. Curr Opin Microbiol 13:204–209. doi: 10.1016/j.mib.2010.01.002. [DOI] [PMC free article] [PubMed] [Google Scholar]
- 53.Xu H, Caimano MJ, Lin T, He M, Radolf JD, Norris SJ, Gherardini F, Wolfe AJ, Yang XF. 2010. Role of acetyl-phosphate in activation of the Rrp2-RpoN-RpoS pathway in Borrelia burgdorferi. PLoS Pathog 6:e1001104. doi: 10.1371/journal.ppat.1001104. [DOI] [PMC free article] [PubMed] [Google Scholar]
- 54.Beres SB, Richter EW, Nagiec MJ, Sumby P, Porcella SF, DeLeo FR, Musser JM. 2006. Molecular genetic anatomy of inter- and intraserotype variation in the human bacterial pathogen group A Streptococcus. Proc Natl Acad Sci U S A 103:7059–7064. doi: 10.1073/pnas.0510279103. [DOI] [PMC free article] [PubMed] [Google Scholar]
- 55.Aziz RK, Pabst MJ, Jeng A, Kansal R, Low DE, Nizet V, Kotb M. 2004. Invasive M1T1 group A Streptococcus undergoes a phase-shift in vivo to prevent proteolytic degradation of multiple virulence factors by SpeB. Mol Microbiol 51:123–134. doi: 10.1046/j.1365-2958.2003.03797.x. [DOI] [PubMed] [Google Scholar]
- 56.Cole JN, McArthur JD, McKay FC, Sanderson-Smith ML, Cork AJ, Ranson M, Rohde M, Itzek A, Sun H, Ginsburg D, Kotb M, Nizet V, Chhatwal GS, Walker MJ. 2006. Trigger for group A streptococcal M1T1 invasive disease. FASEB J 20:1745–1747. doi: 10.1096/fj.06-5804fje. [DOI] [PubMed] [Google Scholar]
- 57.Hollands A, Pence MA, Timmer AM, Osvath SR, Turnbull L, Whitchurch CB, Walker MJ, Nizet V. 2010. Genetic switch to hypervirulence reduces colonization phenotypes of the globally disseminated group A Streptococcus M1T1 clone. J Infect Dis 202:11–19. doi: 10.1086/653124. [DOI] [PMC free article] [PubMed] [Google Scholar]
- 58.Crotty Alexander LE, Maisey HC, Timmer AM, Rooijakkers SH, Gallo RL, von Kockritz-Blickwede M, Nizet V. 2010. M1T1 group A streptococcal pili promote epithelial colonization but diminish systemic virulence through neutrophil extracellular entrapment. J Mol Med 88:371–381. doi: 10.1007/s00109-009-0566-9. [DOI] [PMC free article] [PubMed] [Google Scholar]
- 59.Venturini C, Ong CL, Gillen CM, Ben-Zakour NL, Maamary PG, Nizet V, Beatson SA, Walker MJ. 2013. Acquisition of the Sda1-encoding bacteriophage does not enhance virulence of the serotype M1 Streptococcus pyogenes strain SF370. Infect Immun 81:2062–2069. doi: 10.1128/IAI.00192-13. [DOI] [PMC free article] [PubMed] [Google Scholar]
- 60.Yang L, Jelsbak L, Marvig RL, Damkiaer S, Workman CT, Rau MH, Hansen SK, Folkesson A, Johansen HK, Ciofu O, Hoiby N, Sommer MO, Molin S. 2011. Evolutionary dynamics of bacteria in a human host environment. Proc Natl Acad Sci U S A 108:7481–7486. doi: 10.1073/pnas.1018249108. [DOI] [PMC free article] [PubMed] [Google Scholar]
- 61.Lieberman TD, Michel JB, Aingaran M, Potter-Bynoe G, Roux D, Davis MR Jr, Skurnik D, Leiby N, LiPuma JJ, Goldberg JB, McAdam AJ, Priebe GP, Kishony R. 2011. Parallel bacterial evolution within multiple patients identifies candidate pathogenicity genes. Nat Genet 43:1275–1280. doi: 10.1038/ng.997. [DOI] [PMC free article] [PubMed] [Google Scholar]
Associated Data
This section collects any data citations, data availability statements, or supplementary materials included in this article.