

Abstract
Collected to support clinical decisions and processes, clinical data may be subject to validity issues when used for research. The objective of this study is to examine methods and issues in summarizing and evaluating the accuracy of clinical data as compared to primary research data. We hypothesized that research survey data on a patient cohort could serve as a reference standard for uncovering potential biases in clinical data. We compared the summary statistics between clinical and research datasets. Seven clinical variables, i.e., height, weight, gender, ethnicity, systolic and diastolic blood pressure, and diabetes status, were included in the study. Our results show that the clinical data and research data had similar summary statistical profiles, but there are detectable differences in definitions and measurements for individual variables such as height, diastolic blood pressure, and diabetes status. We discuss the implications of these results and confirm the important considerations for using research data to verify clinical data accuracy.
Introduction
Computational reuse of clinical data from the electronic health record (EHR) has been frequently recommended for improving efficiency and reducing cost for comparative effectiveness research[1]. This goal faces significant barriers because clinical data are collected to aid individual clinicians in diagnosis, treatment, and monitoring of health-related conditions rather than for research uses[2]. A risk to reuse is potential hidden biases in clinical data. While specific studies have demonstrated positive value in clinical data research, there are concerns about whether they are generally usable. An opaque data capture processes and idiosyncratic documentation behaviors of clinicians from multiple disciplines may lead to data biases. A difference in the population who seek medical care versus the general residential population may introduce a selection bias when clinical data are used to estimate population statistics.
Comparison of EHR data with a gold standard is by far the most frequently used method for assessing accuracy[3]. Recent efforts have taken a more implicit approach to validating clinical data in the form of study result replication. Groups such as HMORN, OMOP, and DARTNet assessed the accuracy of clinical data by comparing research results derived from clinical data with those derived from randomized controlled trials[4–6]. This reflects a focus on making a new system work, rather than a lack of recognition of a potential problem.
The Washington Heights/Inwood Informatics Infrastructure for Community-Centered Comparative Effectiveness Research (WICER) Project (http://www.wicer.org) has been conducting community-based research and collecting patient self-reported health information. We assume research data are of better quality than clinical data given their rigorous data collection processes. For patients with information in both the survey and electronic health records, an analysis of the differences between data collected through survey and data collected in clinical settings may help us understand the potential biases in clinical data. This study compares WICER Community Survey results to data for the same variables from the same people collected within our EHR as well as attempts to replicate the WICER research sample using only clinical data. We discuss the implications of these results and three potential categories of accuracy of clinical data.
Methods
Our conceptual framework for using research data to verify clinical data includes four consecutive steps: (1) cohort selection; (2) variable selection; (3) data point selection; and (4) measurement selection.
Step 1: Cohort Selection
We selected the patients who had data in both data sources: the WICER community population health survey and our institutional clinical data warehouse. The WICER Community Survey collected data from residents in Washington Heights, an area of New York with a population of approximately 300,000 people, through cluster and snowball sampling methodologies. Surveys were administered to individuals over the age of 18 who spoke either English or Spanish. Survey data was collected and processed from March 2012 through September 2013. A total of 5,269 individuals took the WICER Community Survey in either the Household or Clinic setting.
The Columbia University Medical Center’s Clinical Data Warehouse (CDW) integrates patient information collected from assorted EHR systems for about 4 million patients for more than 20 years. The initial effort to replicate the WICER research sample restricted the CDW to adult patients who had an address within one of the five same zip codes and one recorded visit during the WICER data collection time period, resulting in a cohort of 78,418 patients.
The WICER data set includes a higher proportion of women and Hispanic individuals than either the CDW sample or what was expected based on census data for the same area codes. New clinical data samples were created to match the proportion of women and Hispanic ethnicity as found in the WICER data set, as well as new samples for both which match the census distributions for age and gender. A total of 1,279 individuals were identified from the intersection of the two datasets to compare clinical data in CDW and research data in WICER without a sampling bias.
Step 2: Variable Selection
Because the WICER study included variables related to hypertension, the American Heart Association (AHA) / American College of Cardiology (ACC) original guidelines for cardiac risk were chosen to guide the variable selection process[7]. The content overlap between the wide range of information collected for the WICER Community Survey and that available in the CDW is limited to some basic demographic and baseline health information. Of the factors in the AHA/ACC Guidelines, Age, Race, Ethnicity, Gender, the components of BMI (height and weight), Smoking Status, Blood Pressure (systolic and diastolic) were available as structured data in both data sources. See Table 1 for concept definitions.
Table 1:
Concepts and Definitions for sample summary
| Concept | Definition |
|---|---|
| N | Number of individuals in sample |
| Age | Average age of individuals in sample |
| Proportion Female | Proportion of sample labeled female |
| Proportion Hispanic | Proportion of sample labeled Hispanic |
| Weight kg | Average weight of individuals in sample |
| Height cm | Median height of individuals in sample |
| BMI | Average BMI of individuals in sample, computed from individual weight and height |
| Prevalence of Smoking | Proportion of sample labeled positive for smoking |
| Prevalence of Smoking with labeled status | Proportion labeled positive for smoking out of individuals with labeled smoking status |
| Systolic | Average systolic blood pressure of individuals in sample |
| Diastolic | Average diastolic blood pressure of individuals in sample |
| Prevalence of Diabetes, Strict Criteria | Proportion of sample with positive diabetes status. |
| Prevalence of Diabetes among labeled status, Strict Criteria | Proportion with positive diabetes status out of individuals with recorded ICD-9 codes and test values |
A simple clinical phenotyping method, consistent with the eMERGE diabetes phenotype[8] but excluding medication orders, was developed for type 2 diabetes in the CDW using ICD-9 Codes, HbA1c test values, and glucose test values. Using the strictest criteria, a patient will only be identified as having diabetes if there are at least two ICD-9 codes for diabetes, at least one HbA1c test value >6.5, or at least two high glucose test values. A glucose test value is coded as high if it is >126 for a fasting glucose test or >200 otherwise. Effectiveness of labeling of each of these components was also explored.
Step 3: Data Point Selection
Each clinical variable could have many data points from multiple points of measurement across time, which necessitated careful data point selection to ensure that summary data points were both representative of all data points and comparable across data sources without introducing data sampling biases. This includes an issue of temporal bias, where some data variables, such as weight, might naturally be expected to change over time. To make a comparable cross-section to the Survey dataset and to ensure the resulting data reflects not only the same sample but also the same sample at the same time, we selected only data points recorded during the 18-month WICER study period from the CDW. In this way, assuming the survey participants are measured at random throughout an 18-month period, so too are the clinical data population.
In the matched sample we had an opportunity to more finely tune the data comparison. The most direct approach is to simply select the clinical data point closest in time to the survey measurement of any given participant. Alternatives include the closest prior or subsequent data paint as well as using a single randomly selected point rather than the average of all clinical data points. While alternate data point selection options were explored, to best keep the results comparable the reported values for the matched sample were derived in the same fashion as for the sample at large.
Step 4: Data Measure Selection for Comparing the Two Data Sets
With representative patient sample, meaningful variables, and representative data points, the next important step for designing an unbiased verification study was to select a meaningful data measure, which seems to be the most subjective step without standard guidance. For this step, we considered two measures: (a) population-level average summary statistics; and (b) patient-level average summary statistics.
Option (a): Population-Level Average summary statistics
Multiple data values available during the study period were averaged in order to minimize any temporal effects while also allowing the use of the most number of patients. Continuous variables within each set were averaged, with one exception, and compared via t-test. The median BMI value was used for comparison as the mean summary value for the calculation of BMI is more susceptible to outliers. Choice of other “best matching” clinical data values, such as the closest prior and subsequent values in time as well as simple random choice, were also explored.
Proportions of interest, which include % female, % smoking, and % Hispanic, for the categorical variables were reported and compared with chi-square test. For some proportions there is a possibility that negative or healthy status might not be recorded and would therefore be accurately represented by missing data. Therefore for smoking and diabetes there is a second value reported: the proportion of labeled status, which excludes any patient with missing data rather than assume missing data denotes known negative status.
For the purpose of primary analysis, only the strictest, ALL criteria for diabetes diagnosis are reported, as consistent with the eMERGE criteria. However, each component of the diabetes diagnosis was examined for sensitivity, specificity, and positive predictive against the patient's self-reported diabetes status. All summary and statistical comparisons were performed in Python, using the SciPy scientific computing package for statistical comparisons.
Option (b): Patient-level Average Summary Statistics
When there is sufficient clinical data, it is possible to create a distribution of expected values for a given patient and compare the survey value to that distribution. At its simplest, the comparison is simply whether the survey value is within one standard deviation of the mean of the available clinical values. This process was performed for patients with at least five data points for the same variable recorded during the study period.
Results
Summary values for the WICER Survey population, the raw clinical sample, the resampled clinical data targeted to match the survey proportion of women and hispanic participants, and census distribution weighted samples are presented in Table 2. Analysis was performed across all samples with no significant variation in results. The original, total clinical dataset was chosen for representative purposes because it is the only clinical sample to contain all members of the matched set.
Table 2:
Summary Results from alternate sampling methods
| Survey | Census-weighted Survey | Clinical Raw | Clinical Resampled | Census-weightedClinical | ||
|---|---|---|---|---|---|---|
| N | 4069 | 78418 | 56694 | |||
| Age | 50.1 | 44.6 | 47.6 | 47.0 | 44.1 | |
| Proportion Female | 0.708 | 0.528 | 0.619 | 0.714 | 0.528 | |
| Proportion Hispanic | 0.955 | 0.951 | 0496 | 0.604 | 0.501 | |
| Weight kg | 75.4 | 77.0 | 75.7 | 74.8 | 78.2 | |
| Height cm | 161.2 | 163.7 | 160.3 | 159.1 | 162.7 | |
| BMI | 28.2 | 27.7 | 28.1 | 28.3 | 28.1 | |
| Prevalence of Smoking | 0.058 | 0.064 | 0.089 | 0.078 | 0.101 | |
| Prevalence of Smoking with labeled status | 0.060 | 0.066 | 0.122 | 0.103 | 0.138 | |
| Systolic | 127.7 | 125.5 | 127.2 | 126.5 | 126.8 | |
| Diastolic | 81.0 | 80.7 | 73.1 | 72.7 | 73.4 | |
| Prevalence of Diabetes, Strict Criteria | 0.159 | 0.122 | 0 038 | 0.040 | 0.032 | |
| Prevalence of Diabetes among labeled status, Strict Criteria | 0.162 | 0.124 | 0.284 | 0.286 | 0.313 |
Following the population summary approach, values and statistics for each data point are presented in Table 3. The Survey dataset tends to be slightly older and contain more women. Survey participants were almost entirely identifying as Hispanic. Sixteen percent of the survey participants self-identified as having diabetes. Measuring the Matched dataset via clinical data and primary survey collection processes broadly records the same values. There are statistically significant measurement discrepancies in Hispanic ethnicity labeling, height measurement, diastolic blood pressure, and diabetes status determination. Where the Clinical and Survey datasets differ, in age, proportion of women, and prevalence of smoking, are evidence of statistically significant differences in sample composition. In exploring patient-level summary statistics, the number of patients with sufficient data to construct a distribution of expected blood pressures was 866. Of these, 491(57%) and 479(55%) had a survey systolic or diastolic blood pressure, respectively, greater than one standard deviation away from their clinical mean. Table 4 shows an example result of alternate data point selections in Systolic BP. While values are statistically significantly different from one another in this and other examples, they would not change the conclusions drawn from Table 3.
Table 3:
Clinical, Survey, and Matched Set data comparison. Bonferroni-corrected p-value = 1e-4
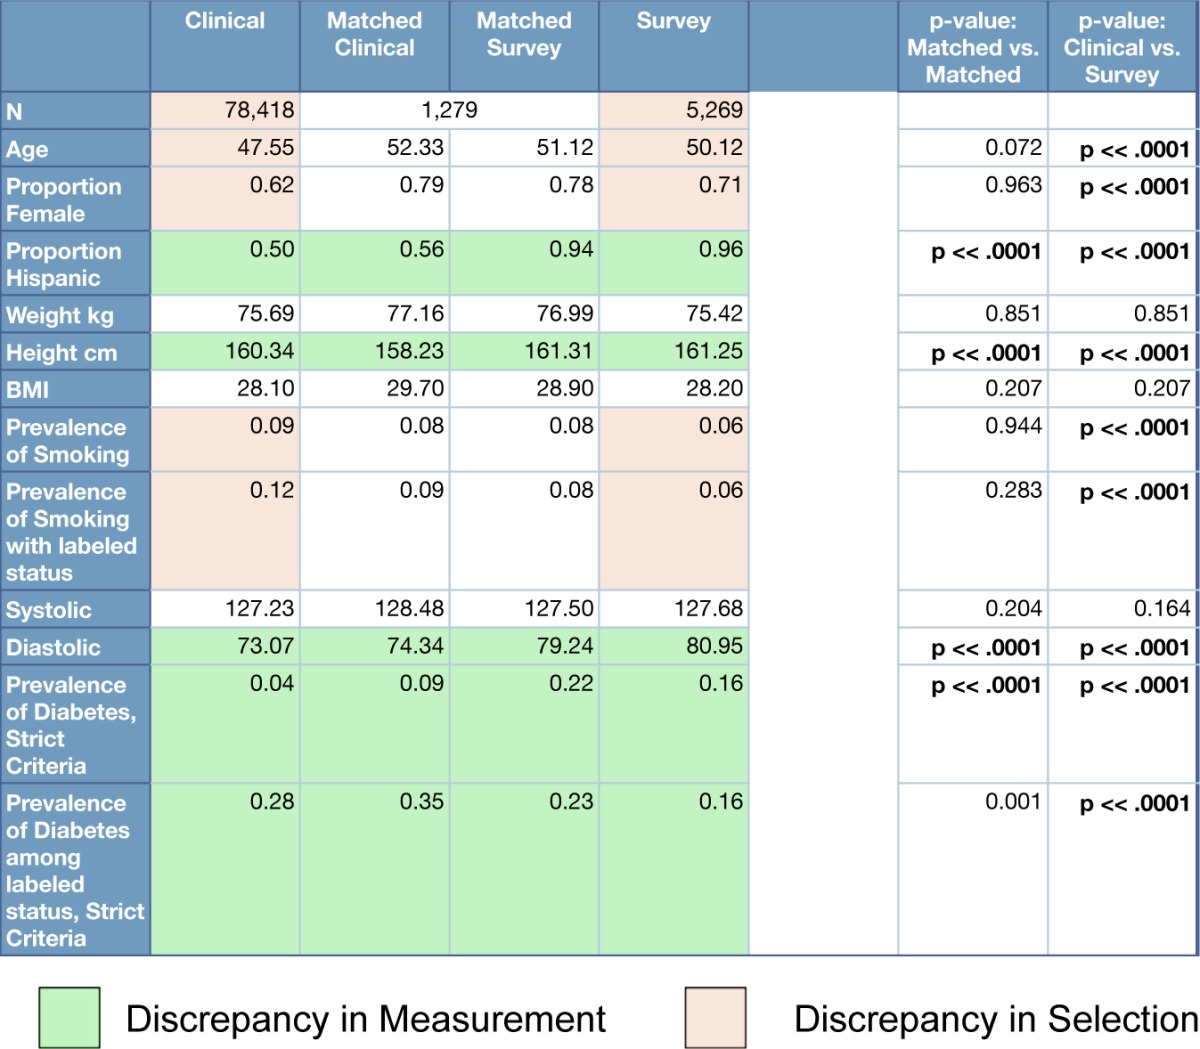
Table 4:
Systolic blood pressure summary values and patient cohort size for various data point selection methodologies
| Systolic BP | Survey | Closest Prior | Closest Subsequent | Random Point | Mean |
|---|---|---|---|---|---|
| N | 1290 | 1107 | 962 | 1185 | 1185 |
| Mean | 127.8 | 127.9 | 130.3 | 129.3 | 128.5 |
The sensitivity, specificity, and positive predictive value of various strategies to identify diabetes status using clinical data are presented in Table 5. In this simple phenotype, ALL is the intersection of three criteria and ANY is the union. The three criteria are having at least two ICD-9 codes for diabetes, one high HbA1c value, and at least two high glucose values. The rationale for requiring two of some categories is to restrict potentially spurious results. In the case of diagnostic codes, for example, a diabetes ICD-9 code might be recorded for a negative diabetes evaluation. The removal of these restrictions was also considered. The ALL criteria have the highest positive predictive value, but the lowest sensitivity. Both the ICD-9 and HbA1c-based criteria have high specificities and the ICD-9 based criteria alone have the highest F-measure for sensitivity and specificity. Proportions of patients retrieved under each qualifying criteria are consistent with published results[9].
Table 5:
Sensitivity, Specificity, F-measure, and Positive Predictive Value of components of a diabetes diagnosis
| Value | ALL | ANY | ≥ ICD-9 | ≥ ICD-9 | HIGH HBA1C | HIGH GLUCOSE, EVER | HIGH GLUCOSE, RECENT |
|---|---|---|---|---|---|---|---|
| Sensitivity | 0.33 | 0.81 | 0.90 | 0.84 | 0.48 | 0.72 | 0.52 |
| Specificity | 0.98 | 0.35 | 0.88 | 0.93 | 0.96 | 0.53 | 0.74 |
| F-measure | 0.49 | 0.49 | 0.89 | 0.88 | 0.64 | 0.61 | 0.61 |
| Positiva Predictive Value | 0.82 | 0.27 | 0.68 | 0.78 | 0 79 | 0.31 | 0.37 |
Discussion
Our study shows discrepancies between clinical and research data, both in sampling and measurement. Clinical measurement of some data, such as gender and BMI, accurately reproduces the research measurement and others, such as diabetes, do not. While raw results may be interesting, because of the limits of overlapping data between sets and the comparisons which could be made, the raw results may have little value outside of this case study. If these discrepancies can be considered as representative of classes of clinical data, we can abstract some idea of generalizable accuracy of clinical data as compared to primary research data. We introduce three categories of accuracy.
The first category is “completely accurate” information, such as sex, birthdate, and therefore age. These data might be considered Personally Identifiable Information (PII), or information that on its own could be used to identify an individual. This classification suggests that address, social security number, and phone number would also be accurate between datasets. While there will be instances of coding error, misreporting, or other errors, by and large these data are consistent across datasets. It should be noted that birthdate was one of the criteria by which individuals were identified for the Matched, and therefore errors in the recording of birthdate would be excluded from this analysis. Also, while PII should be accurate across datasets, this does not suggest that all demographic information, such as ethnicity, will be accurate.
The second category is ‘simple measurement’ information, which is the result of a clear concept or measurement process. Height, weight, systolic and diastolic blood pressure, smoking status, and ethnicity are included in this category. Here, the simplicity of the measurement or concept leads to agreement in the value between sources, and differences in the value are the result of a difference in either the concept definition or the measurement process. For example, measured heights in the Matched group differ by approximately 2.5cm or 1in, suggesting that the concept and measurement of height in the Survey sample includes shoes. Likewise, diastolic blood pressure is consistently measured 5 points higher in the Survey sample, suggesting a difference in measurement. Ethnicity, which is self-reported in the survey, is labeled by hospital staff during admission to the hospital, resulting in approximately one third of Hispanic individuals being labeled as ‘Unknown’ ethnicity in the Clinical sample.
The final category of accuracy is 'inferred' information, where a complex concept, such as diabetes, is inferred from multiple variables. When compared with self-reported Survey values, no single prediction or combination of variables can be considered accurate for an entire cohort. However, some results may be useful enough for a specific purpose. For example, requiring ALL criteria has a high positive predictive value and may provide a high level of accuracy within a given cohort. Conversely, using just HbA1c measurements has a high sensitivity and may be most valuable when a larger quantity of data is required for statistical power.
At least in this case study, discrepancies in the 'simple measurement' category are stable across multiple sampling methodologies. Discrepancies are also stable when samples are broken down into categories such as age by decade, obesity classification, and hypertension risk category. This stability is what would be expected if the discrepancies were the result of simple measurement error and would suggest these discrepancies represent systematic bias in the clinical data. It is possible that reported discrepancies are the result of data retrieval and processing. However, the presence of pairs of measurements such as weight/height and systolic/diastolic blood pressure, retrieved and processed in an identical manner, where one is accurate and one not, suggests the discrepancies are truly present in at data source. Due to the limitations of this case study, it is unclear how generalizable this finding may be.
The choice of exact data points may also influence study results, so care must be taken in accurately summarizing patient data. In this study, the biggest apparent difference was between closest prior and subsequent data points. The reason may be that closest prior data point represents the end of a series of blood pressures which began with a hospitalization and is, therefore, the nearest to “normal”. The closest subsequent data point, however, would represent the initial data collection of a hospitalization and would likely reflect a health crisis. Furthermore, defining allowable data points in time restricts the number of patients, who qualify for comparison. Using the average value for each patient smoothens out these temporal effects and allows the use of the maximum number of patients for comparison.
Recommendations
When a research cohort is defined as having clinical data, that clinical data may be a usable substitute for primarily acquired research data, depending on the needs of the research. PII should have a high degree of accuracy and aspects of the patient record, which are conceptually simple or have a clear measurement process, may be accurate or include relatively small discrepancies. More complex concepts, such as a diabetes phenotype, are not accurate for summary purposes but components may be useful depending on the exact nature of the requirement. However, to avoid the discrepancies due to clinical sampling, the research cohort must be defined as already having clinical data. Results of this study demonstrate a significant difference in sampling processes between clinical data and research survey cohorts. Clinical data used as a convenience sample to substitute for primary research data will not accurately describe the target population. Discrepancies in the simple measurement category may be due to differences between either the concept definition or measurement processes. If a dictionary of concept definitions or measurement procedures was provided as either a standalone document or as metadata tied to each value, such as whether a measurement of height requires shoes to be taken off, then the comparability of specific variables might be predictable. Additionally, while aspects of clinical data collection are not in the researcher's control, the exact choice of data value for research may be. Different choices, such as average per patient or nearest in time, can result in statistically significant differences in values.
Limitations
This study is limited in scope and setting. First, the overlap between the population survey and clinical data was limited to a small set of variables. Second, the population survey targeted a largely Hispanic, urban population and the institution is a large academic medical center. These findings may not be generalizable to other institutions and populations. This work should be replicated in other settings.
Conclusions
We compared research population survey results to clinical data for the same target population to verify the accuracy of clinical data elements. Clinical data elements may be classified into three categories of accuracy: completely accurate, simple measurement, and inferred information, depending in part on the complexity of the concept being measured and the process of that measurement. Additionally, we report recommendations and considerations for using clinical data for cohort selection and research.
Acknowledgments
The authors are supported by grant R01HS019853 (PI: Bakken) from the Agency for Healthcare Research and Quality, grants 5T15LM007079 (PI: Hripcsak) and R01LM009886 (PI: Weng) from the National Library of Medicine, and grant UL1 TR000040 (PI: Ginsberg) from the National Center for Advancing Translational Sciences.
References
- 1.A First Look at the Volume and Cost of Comparative Effectiveness Research in the United States. Academy Health; 2009. [DOI] [PubMed] [Google Scholar]
- 2.Hersh WR, Weiner MG, Embi PJ, Logan JR, Payne PR, Bernstam EV, Lehmann HP, Hripcsak G, Hartzog TH, Cimino JJ, Saltz JH. Caveats for the use of operational electronic health record data in comparative effectiveness research. Med Care. 2013;51(8 Suppl 3):S30–7. doi: 10.1097/MLR.0b013e31829b1dbd. [DOI] [PMC free article] [PubMed] [Google Scholar]
- 3.Weiskopf NG, Weng C. Methods and dimensions of electronic health record data quality assessment: enabling reuse for clinical research. J Am Med Inform Assoc. 2013;20(1):144–51. doi: 10.1136/amiajnl-2011-000681. [DOI] [PMC free article] [PubMed] [Google Scholar]
- 4.OMOP Design and Validation. 2013. Available from: http://omop.fnih.org.
- 5.Tannen RL, Weiner MG, Xie D. Use of primary care electronic medical record database in drug efficacy research on cardiovascular outcomes: comparison of database and randomised controlled trial findings. BMJ. 2009;338:b81. doi: 10.1136/bmj.b81. [DOI] [PMC free article] [PubMed] [Google Scholar]
- 6.Libby AM, Pace W, Bryan C, Anderson HO, Ellis SL, Allen RR, Brandt E, Huebschmann AG, West D, Valuck RJ. Comparative effectiveness research in DARTNet primary care practices: point of care data collection on hypoglycemia and over-the-counter and herbal use among patients diagnosed with diabetes. Med Care. 2010;48(6 Suppl):S39–44. doi: 10.1097/MLR.0b013e3181ddc7b0. [DOI] [PubMed] [Google Scholar]
- 7.Grundy SM, Pasternak R, Greenland P, Smith S, Jr, Fuster V. AHA/ACC scientific statement: Assessment of cardiovascular risk by use of multiple-risk-factor assessment equations: a statement for healthcare professionals from the American Heart Association and the American College of Cardiology. J Am Coll Cardiol. 1999;34(4):1348–59. doi: 10.1016/s0735-1097(99)00387-3. [DOI] [PubMed] [Google Scholar]
- 8.Pacheco JT, W Type 2 Diabetes Mellitus. 2012. Available from: http://phenotype.mc.vanderbilt.edu/phenotype/type-2-diabetes-mellitus.
- 9.Richesson RL, Rusincovitch SA, Wixted D, Batch BC, Feinglos MN, Miranda ML, Hammond WE, Califf RM, Spratt SE. A comparison of phenotype definitions for diabetes mellitus. J Am Med Inform Assoc. 2013;20(e2):e319–26. doi: 10.1136/amiajnl-2013-001952. [DOI] [PMC free article] [PubMed] [Google Scholar]