

Abstract
Medulloblastoma comprises four distinct molecular variants with distinct genetics, transcriptomes, and outcomes. Subgroup affiliation has been previously shown to remain stable at the time of recurrence, which likely reflects their distinct cells of origin. However, a therapeutically relevant question that remains unanswered is subgroup stability in the metastatic compartment. We assembled a cohort of 12-paired primary-metastatic tumors collected in the MAGIC consortium, and established their molecular subgroup affiliation by performing integrative gene expression and DNA methylation analysis. Frozen tissues were collected and profiled using Affymetrix gene expression arrays and Illumina methylation arrays. Class prediction and hierarchical clustering were performed using existing published datasets. Our molecular analysis, using consensus integrative genomic data, establishes the unequivocal maintenance of molecular subgroup affiliation in metastatic medulloblastoma. We further validated these findings by interrogating a non-overlapping cohort of 19-pairs of primary-metastatic tumors from the Burdenko Neurosurgical Institute using an orthogonal technique of immunohistochemical staining. This investigation represents the largest reported primary-metastatic paired cohort profiled to date and provides a unique opportunity to evaluate subgroup-specific molecular aberrations within the metastatic compartment. Our findings further support the hypothesis that medulloblastoma subgroups arise from distinct cells of origin, which are carried forward from ontogeny to oncology.
Keywords: Medulloblastoma, Metastasis, Molecular Subgroups, Integrative Genomics, Gene Expression, DNA Methylation
Introduction
Medulloblastoma is the most common malignant pediatric brain tumor [3]. Despite multi-modal treatments of maximal-safe surgical resection, radiation, and chemotherapy, there remains a significant portion of patients who succumb to their disease[20]. Recent integrative genomics have identified four distinct subgroups of medulloblastoma, these include WNT, SHH, Group 3 and Group 4 [2, 13, 16, 27, 28]. These four subgroups have disparate demographics, clinical features, and genetics. Previous work demonstrates that clinical parameters used to risk stratify patients are largely attributed to molecular subgroup differences. For example, WNT patients have the best prognosis, whereas Group 3 patients often present with metastatic disease and have the worst prognosis [12, 15, 21]. As patient mortality and high-risk disease are characterized by the presence of metastatic lesions, there is significant interest in unraveling the role of subgroup affiliation between the primary and metastatic compartments.
Previous study comparing primary and recurrent medulloblastoma has demonstrated the maintenance of subgroup affiliation at recurrence, using a 22-gene nanoString probe-set [22]. This finding largely deviates from other neoplasms, such as glioblastoma multiforme, where molecular subclass switching has been identified, both temporally and spatially [10, 18, 25]. What remains unknown is whether medulloblastoma maintain subgroup identity between the primary and metastatic compartment. As inclusion/exclusion schemas for many clinical trials already necessitates molecular subtyping, the establishment of molecular subgroup in both the primary and metastatic compartments remains of critical importance [30]. Whether molecular subgroups play a significant prognostic and biological role in the metastatic compartment remains to be seen. Moreover, future trials will likely evaluate patients with relapsed/recurrent and metastatic disease, highlighting the need to identify molecular subgroup identity in both the primary and metastatic disease.
Methodology
Patients
Our integrative molecular and clinical analysis comprised of two non-overlapping cohorts. Cohort 1 (discovery) consisted of all patients with metastatic medulloblastoma with either frozen or formalin-fixed paraffin-embedded (FFPE) material along with clinical variables and survival data from 10 different centres (Johns Hopkins University School of Medicine, Baltimore, MD, USA; Virginia Commonwealth University, Richmond, VA, USA; New York University Langone Medical Center, New York, NY, USA; Children's Hospital of Minnesota, Minneapolis, MN, USA; Stanford University School of Medicine, Stanford, CA, USA; Emory University, Atlanta, GA, USA; Texas Children's Cancer Center, Houston, TX, USA; Weill Medical College of Cornell University, New York, NY, USA; Brain Tumour Tissue Bank, London, ON, Canada; Hospital for Sick Children, Toronto, ON, Canada). Matched samples from primary and metastatic samples were extracted using TRIzol RNA extraction, according to manufacturer's instructions. Cohort 2 (validation) consisted of samples from patients with metastatic medulloblastoma obtained at the NN Burdenko Neurosurgical Institute (Moscow, Russia). For all available clinical characteristics of both patient cohorts, including the location of available metastases, please see Supplementary Table 2.
Subgroup determination was established using gene expression profiling, nanoString targeted gene-expression profiling, as well as 450k DNA methylation, as previously described, in all cases, where available, from cohort 1 [7, 14, 16]. Subgroup affiliation for cohort 2 was completed by immunohistochemistry employing the four-antibody approach, as previously described (WNT=nuclear β-catenin, SHH=SFRP1, Group 3=NPR3, Group 4=KCNA1) [16, 23, 24]. For SFRP1 and NPR3, we detected membranous-cytoplasmic staining and most of the tumor cells were stained with these markers. For KCNA1 we detected cytoplasmic and nuclear staining with wide extensions in the group 4 tumors.
The research ethics boards at all participating centres approved the study and all samples and clinical information were obtained with consent in accordance with the research ethics board at the Hospital for Sick Children and collaborating centres.
Statistical Analysis
Whole genome expression was generated using the Affymetrix GeneChip Human Gene 2.0 ST Array. Samples were normalized using RMA as part of the R/Bioconductor oligo package (version 1.26.6) [8]. DNA methylation was generated using the Illumina Infinium HumanMethylation450 BeadChip array (450k array). Samples were normalized using the SWAN as part of the R/Bioconductor minfi package (version 1.12.0). Assessment of differential expression between primary and metastatic samples was conducted using the generalized linear model with empirical Bayes adjustment using the limma package from R (version 3.0.2). Unsupervised hierarchical clustering (HCL) using the Pearson correlation metric and non-negative matrix factorization (NMF) consensus analysis for whole genome expression and DNA methylation were completed using the top 1,000 differentially expressed genes and top 10,000 differentially methylated probes, respectively. We used the cophenetic coefficient as a measure of correlation between the sample distances induced by the consensus matrix [1]. The red circle is the evidence for the number of clusters resulting in the highest similarity between samples. Principle component analysis was done in the Partek Genomic Suite and HCL and NMF was done using MultiExperiment Viewer (version 10.2). Class prediction was done using prediction analysis of microarrays (PAM) as previously described [29], using the expression training data as reported by Northcott et al [16]. (Gene Expression Omnibus accession No. GSE 21140) and methylation training data as reported by Hovestadt et al [6]. (Gene Expression Omnibus accession No. GSE 54880). Raw and normalized whole genome expression and 450k DNA methylation data were deposited to Gene Expression Omnibus under accession number GSE 63670.
Results
Cohort description
Biopsies of metastatic lesions of medulloblastoma are not routinely taken; as such very few primary-metastatic pairs have been analyzed. We set out and collected a relatively large cohort of primary-metastatic pairs to our knowledge and performed integrative genetic analysis to determine subgroup affiliation. Table I shows the demographics of all patients in this study. Due to limitation and rarity of patient samples with matched primary and metastasis, 9 patient samples were subjected to gene expression profiling and 11 patient samples were profiled using high resolution genome wide methylation arrays. Eight out of the 12 patients have both gene expression and 450k DNA methylation data; this cohort of patients will thus be referred to as the discovery cohort. We have also conducted immunohistochemistry on a non-overlapping cohort of patient samples obtained from the Burdenko Neurosurgical Institute; this cohort of patients will be referred to as the validation cohort. Both the discovery and validation cohort have similar age, with the vast majority of patients between the ages of 5-18. The cohorts are comparable in terms of gender and histology. Using a previously validated 22-nanoString probe-set for subgroup determination[14], the most enriched subgroup is Group 4, followed by Group 3 (Fig. 1a). We did not have any WNT patients, which is likely a reflection of the largely local and non-metastatic nature of these tumours. Using an established cohort of 103 patients with known subgroup affiliation as the training set, we further used Prediction Analysis of Microarrays (PAM) prediction to assign subgroup to the primary and metastases pairs (Supplementary Table 1).
Table 1. Clinical characteristics of matched primary and metastatic medulloblastoma in the discovery and validation cohorts.
| HuGene2.0 Gene Expression (n=9) | 450K DNA Methylation (n=11) | Validation Tissue Microarray (n=19) | ||||
|---|---|---|---|---|---|---|
|
|
||||||
| Variable | No. | % | No. | % | No. | % |
| Age, years | ||||||
| ≤ 5 | 1 | 11 | 1 | 9 | 5 | 26 |
| 5-18 | 5 | 56 | 6 | 55 | 11 | 58 |
| ≥18 | 1 | 11 | 1 | 9 | 3 | 16 |
| Unknown | 2 | 22 | 3 | 27 | 0 | 0 |
|
| ||||||
| Sex | ||||||
| Male | 3 | 33 | 4 | 36 | 10 | 53 |
| Female | 4 | 44 | 4 | 36 | 9 | 47 |
| Unknown | 2 | 22 | 3 | 28 | 0 | 0 |
|
| ||||||
| Subgroup | ||||||
| WNT | 0 | 0 | 0 | 0 | 0 | 0 |
| SHH | 1 | 11 | 1 | 9 | 4 | 21 |
| Group 3 | 2 | 22 | 3 | 27 | 8 | 42 |
| Group 4 | 6 | 67 | 7 | 64 | 7 | 37 |
| Unknown | 0 | 0 | 0 | 0 | 0 | 0 |
|
| ||||||
| Histology | ||||||
| Classic | 3 | 22 | 3 | 27 | N/A | |
| Desmoplastic | 0 | 0 | 0 | 0 | N/A | |
| Large Cell Anaplastic | 1 | 11 | 1 | 9 | N/A | |
| Unknown | 5 | 67 | 7 | 64 | N/A | |
|
| ||||||
| Died of disease | ||||||
| No | 1 | 11 | 2 | 18 | 4 | 21 |
| Yes | 4 | 44 | 3 | 27 | 15 | 79 |
| Unknown | 4 | 44 | 6 | 55 | 0 | 0 |
8/12 samples have both gene expression and 450K DNA methylation data
Fig. 1.
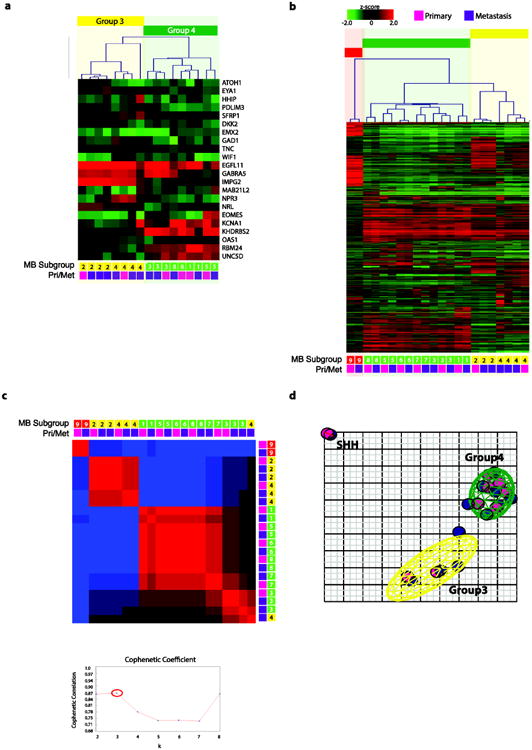
(a) Unsupervised hierarchical clustering of human 2.0 exon array (Affymetrix GeneChip Human Gene 2.0 ST Array) expression data from 22 medulloblastoma samples (9 matched primary-metastasis patients) using 1,000 most differentially expressed genes. (b) Non-negative matrix factorization (NMF) consensus analysis provides strong statistical support for three subgroups (k=2, cophenetic coefficient=0.86; k=3, cophenetic coefficient=0.87; k=4, cophenetic coefficient=0.77). (c) Heatmap of relative gene expression of 22 nanoString probe-set (normalized with ACTB, GAPDH, LDHA) on 17 samples (6 matched primary-metastasis patients). (d) Principle component analysis (PCA) of the primary and metastatic medulloblastoma samples described in (a) using the same 1000 most differentially expressed genes. Coloured ellipsoids (red=SHH, yellow=Group 3, green=Group 4) represent 1.5 SDs of the data distribution for each subgroup. Individual primary samples are indicated with magenta colour and metastatic samples are indicated with purple colour.
Subgroup stability by expression
Using gene expression signatures (Affymetrix GeneChip Human Gene 2.0 ST Array) from 9 pairs of primary-metastasis pairs, we show the subgroup affiliation is stable between the primary and metastatic compartment. Unsupervised hierarchical clustering using the top 1,000 differentially expressed probes is able to recapitulate the subgroups despite the low sample number. In all 9 pairs, the primary and metastatic samples clustered with the same subgroup and furthermore clustered with the same patient, even in cases with multiple metastases (Fig. 1b). We further demonstrate using NMF-consensus clustering that in all but one case (patient 4), primary and metastatic samples are more alike to each other, with the highest support for 3 subgroups (k=3, cophenetic coefficient=0.87) (Fig. 1c). The similarity and stability of subgroup between the primary and metastatic compartment was also demonstrated using Principal Components Analysis (PCA) (Fig. 1d). The primary (pink) consistently cluster with the matched metastasis (purple). Individual patients also cluster more closely together to each other (Supplementary Fig. 1a). Using three orthogonal methods, we demonstrate that primary and metastasis from the same patients cluster together.
Subgroup stability by methylation
To further demonstrate the subgroup stability between primary and metastasis, we performed Illumina 450k DNA methylation array (Infinium HumanMethylation450 BeadChip) on 11 patient pairs. Unsupervised hierarchical clustering using the top 10,000 most differentially methylated probes as calculated by the Kruskal-Wallis test, demonstrates maintenance of subgroup between primary and metastatic pairs. In all cases, the primary (pink) clustered together with the metastases (purple) (Fig. 2a). NMF consensus analysis further provides statistical support for the three-medulloblastoma subgroups that remain stable between patient pairs (k=3, cophenetic coefficient=1.0) (Fig. 2b). Using PCA, the methylation of the primary and metastatic samples cluster together (Fig. 2c) and are more alike to each other (Supplementary Fig. 1b) than to other patients in the same subgroup. Using a publically available dataset of 100 primary medulloblastoma samples with subgroup affiliation as determined through 450k DNA methylation array, we further validated the stability of subgroup between primary and metastases using PAM prediction (Supplementary Table 1). Using integrative genetic analysis looking at gene expression signatures and 450k DNA methylation, we demonstrate the maintenance and stability of medulloblastoma subgroups between the primary and metastatic compartments. Using an orthogonal technique of immunohistochemistry on a non-overlapping cohort of 19 primary and metastases patient pairs, we further validated the maintenance of subgroup affiliation between primary and metastatic compartments (Fig. 3a). Supplementary Table I shows a summary of the subgroup calls using different platforms and statistical tests. We observed a total of 4/28 misclassified samples using 3 different strategies comprising of both gene expression and DNA methylation data for subgrouping totaling 168 tests, thus comprising only a very small disconcordance rate (2.98%). Currently the gold standard is considered consensus clustering using Illumina Infinium HumanMethylation450 arrays. Using consensus clustering by high-density methylation arrays, the primary and metastatic samples uniformly share subgroup affiliation. We therefore conclude, using multiple experimental approaches examining the levels of gene expression, DNA methylation, and protein expression, that medulloblastoma subgroups remain stable across both primary and metastatic compartments.
Fig. 2.
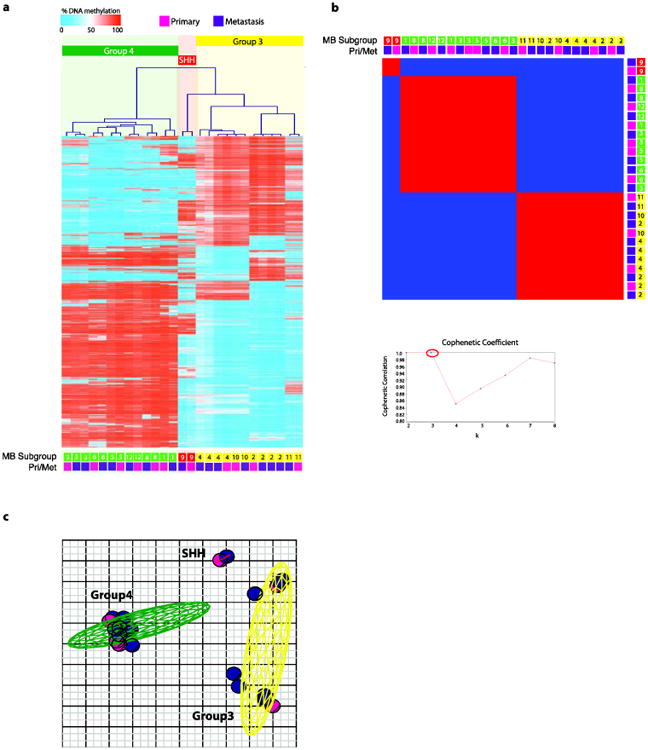
(a) Unsupervised hierarchical clustering of 450k DNA methylation (Infinium HumanMethylation450 BeadChip Kit) data from 27 medulloblastoma samples (11 matched primary-metastasis patients) using 10,000 most differentially methylated probes. (b) Non-negative matrix factorization (NMF) consensus analysis provides strong statistical support for three subgroups (k=2, cophenetic coefficient=1.0; k=3, cophenetic coefficient=1.0; k=4, cophenetic coefficient=0.85). (c) Principle component analysis (PCA) of the primary and metastatic medulloblastoma samples described in (a) using the same 10,000 most differentially methylated probes. Coloured ellipsoids (red = SHH, yellow = Group 3, green = Group 4) represent 1.5 SDs of the data distribution for each subgroup. Individual primary samples are indicated with magenta colour and metastatic samples are indicated with purple colour.
Fig. 3.
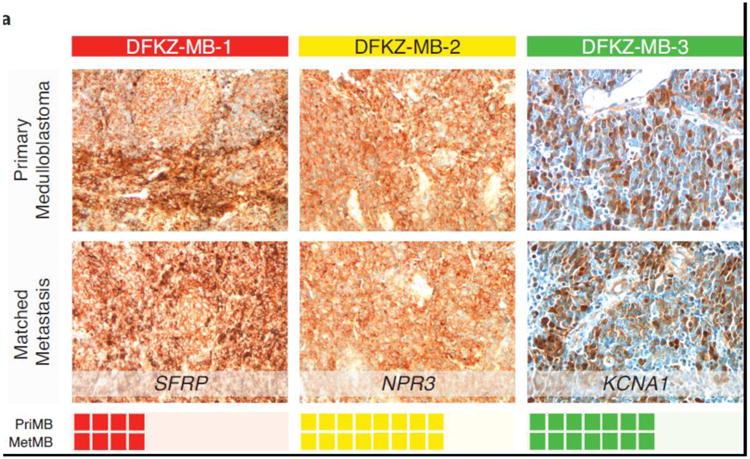
(a) Immunohistochemistry of 19 matched primary-metastasis patient samples in our validation cohort (SHH=SFRP, Group3=NPR3, Group4=KCNA1) provides additional support using orthogonal technique the maintenance of molecular subgroups between primary and metastatic compartments.
Discussion
Herein we demonstrate that medulloblastoma subgroup affiliation remains stable in both the primary and metastatic compartments. Using a multi-modal validation strategy integrating molecular - both gene expression and methylation analysis – and immunohistochemistry tools, we evaluated two non-overlapping cohorts of medulloblastoma. This study, to our knowledge, represents the largest study to date designed to evaluate matched primary and metastasis samples with detailed subgroup information. Metastatic and primary disease from the same subgroup will always cluster together, further highlighting their similarity, and strengthening the notion that medulloblastoma subgroups are distinct entities.
Our finding that subgroup affiliation is stable between the primary and metastatic compartments further reinforces the stability of medulloblastoma subgroups. Indeed, this finding further suggests that medulloblastoma subgroups arise from distinct cells of origin [5, 11, 19, 22]. The maintenance of subgroup affiliation between the two compartments reflects the primary and metastatic compartments sharing a distinct cell of origin. However, our previous work suggests that the metastatic compartment is distinct form the primary. Clinically, Group 3 and 4 patients fail almost exclusively with metastatic dissemination suggesting a therapy resistant subclone drives relapse [22]. This coupled with our previous cross species genomic studies suggest that in both murine and human medulloblastoma, the primary and metastatic compartments are genomically distinct [31]. This current work suggests that although the cell of origin between the primary and metastatic compartments are retained, the two compartments are distinct within the context of a preserved subgroup affiliation.
It is of interest to note that despite subgroup affiliation being preserved between the primary and metastasis compartments, metastasis often cluster closer to each other than to their primary disease. Although this evidence is preliminary given our limited number of samples with multiple metastases, this finding suggests the intriguing possibility that clonal evolution has given rise to divergent populations in the metastatic compartment. Previous evidence from murine medulloblastoma indeed shows that the primary and metastatic compartments are biologically distinct and harbor different driver events [31]. This observation may have significant clinical implications, therapies aimed at targeting disease subgroups may be more efficacious then targeting single genetic aberrations, which may or may not be present in the metastatic compartment or at recurrence.
Treatment for metastatic medulloblastoma has led to survival rate approaching 70% [4, 9, 17, 26]. However, the requirement for 36Gy of craniospinal irradiation results in devastating neurocognitive sequelae. In order to further increase survival and improve quality of life, targeted therapies aimed at the metastatic compartment are urgently required. Future clinical trials, which are often conducted in the setting of metastatic or relapsed patients, need to prioritize on targets that are present in metastatic lesions. To better understand the metastatic compartment, sampling of the metastatic disease needs to be considered if possible. However, sampling for the sole purpose of subgrouping is unwarranted and based on the findings of this paper unnecessary and should rather be extrapolated from the primary disease. Prospective multi-centered longitudinal studies of metastatic medulloblastoma need to be conducted in a subgroup-specific fashion to increase our understanding of metastatic progression. Further studies using high-resolution platforms, such as RNA-sequencing and next generation whole genome sequencing comparing both primary and matched metastases will guide therapeutic development.
Supplementary Material
Supplementary Fig. 1 PCA of the primary and metastatic medulloblastoma samples described in using the 1,000 most differentially expressed genes (a) and 10,000 most differentially methylated probes (b). Coloured ellipsoids (red = SHH, yellow = Group 3, green = Group 4) represent 1.5 SDs of the data distribution for each subgroup. Individual patients are indicated with a unique colour.
Supplementary Table 1. Medulloblastoma subgroup predictions and consensus using integrative genomics analysis based on gene expression and 450k DNA methylation
Acknowledgments
XW is supported by a CIHR Vanier Canada Graduate Scholarship, McLaughlin Centre for Molecular Medicine MD/PhD Scholarship, and the Ruggles MD/PhD Innovation Award. MDT is supported by a CIHR Clinician Scientist Phase II award, funds from the Garron Family Chair in Childhood Cancer Research at The Hospital for Sick Children and The University of Toronto, and operating funds from the Canadian Institutes of Health Research, the National Institutes of Health (R01CA159859 and R01CA148699) and the Pediatric Brain Tumor Foundation. VR is supported by a CIHR fellowship, an Alberta Innovates-Health Solutions Clinical Fellowship and a Young Investigator Award from Alex's Lemonade Stand Foundation. BHK is supported by the Gattuso-Slaight Personalized Cancer Medicine Fund at the Princess Margaret Cancer Centre. We wish to acknowledge the Labatt Brain Tumour Research Centre and Tumour Tissue Repository, which are supported by b.r.a.i.n.child and Meagan's Walk.
References
- 1.Brunet JP, Tamayo P, Golub TR, Mesirov JP. Metagenes and molecular pattern discovery using matrix factorization. Proc Natl Acad Sci U S A. 2004;101:4164–9. doi: 10.1073/pnas.0308531101. [DOI] [PMC free article] [PubMed] [Google Scholar]
- 2.Cho YJ, Tsherniak A, Tamayo P, Santagata S, Ligon A, Greulich H, Berhoukim R, Amani V, Goumnerova L, Eberhart CG, et al. Integrative genomic analysis of medulloblastoma identifies a molecular subgroup that drives poor clinical outcome. J Clin Oncol. 2011:1424–1430. doi: 10.1200/JCO.2010.28.5148. [DOI] [PMC free article] [PubMed] [Google Scholar]
- 3.Dolecek Ta, Propp JM, Stroup NE, Kruchko C. CBTRUS Statistical Report: Primary Brain and Central Nervous System Tumors Diagnosed in the United States in 2005-2009. Neuro Oncol. 2012;14(Suppl 5):v1–v49. doi: 10.1093/neuonc/nos218. [DOI] [PMC free article] [PubMed] [Google Scholar]
- 4.Gandola L, Massimino M, Cefalo G, et al. Hyperfractionated accelerated radiotherapy in the Milan strategy for metastatic medulloblastoma. J Clin Oncol. 2009;27:566–71. doi: 10.1200/JCO.2008.18.4176. [DOI] [PubMed] [Google Scholar]
- 5.Gibson P, Tong Y, Robinson G, et al. Subtypes of medulloblastoma have distinct developmental origins. Nature. 2010;468:1095–9. doi: 10.1038/nature09587. [DOI] [PMC free article] [PubMed] [Google Scholar]
- 6.Hovestadt V, Jones DTW, Picelli S, et al. Decoding the regulatory landscape of medulloblastoma using DNA methylation sequencing. Nature. 2014;510:537–41. doi: 10.1038/nature13268. [DOI] [PubMed] [Google Scholar]
- 7.Hovestadt V, Remke M, Kool M, et al. Robust molecular subgrouping and copy-number profiling of medulloblastoma from small amounts of archival tumour material using high-density DNA methylation arrays. Acta Neuropathol. 2013;125:913–6. doi: 10.1007/s00401-013-1126-5. [DOI] [PMC free article] [PubMed] [Google Scholar]
- 8.Irizarry Ra. Summaries of Affymetrix GeneChip probe level data. Nucleic Acids Res. 2003;31:15e–15. doi: 10.1093/nar/gng015. [DOI] [PMC free article] [PubMed] [Google Scholar]
- 9.Jakacki RI, Burger PC, Zhou T, et al. Outcome of children with metastatic medulloblastoma treated with carboplatin during craniospinal radiotherapy: a Children's Oncology Group Phase I/II study. J Clin Oncol. 2012;30:2648–53. doi: 10.1200/JCO.2011.40.2792. [DOI] [PMC free article] [PubMed] [Google Scholar]
- 10.Johnson BE, Mazor T, Hong C, et al. Mutational analysis reveals the origin and therapy-driven evolution of recurrent glioma. Science. 2014;343:189–93. doi: 10.1126/science.1239947. [DOI] [PMC free article] [PubMed] [Google Scholar]
- 11.Kawauchi D, Robinson G, Uziel T, et al. A Mouse Model of the Most Aggressive Subgroup of Human Medulloblastoma. Cancer Cell. 2012;21:168–180. doi: 10.1016/j.ccr.2011.12.023. [DOI] [PMC free article] [PubMed] [Google Scholar]
- 12.Kool M, Korshunov A, Remke M, et al. Molecular subgroups of medulloblastoma: an international meta-analysis of transcriptome, genetic aberrations, and clinical data of WNT, SHH, Group 3, and Group 4 medulloblastomas. Acta Neuropathol. 2012 doi: 10.1007/s00401-012-0958-8. [DOI] [PMC free article] [PubMed] [Google Scholar]
- 13.Kool M, Koster J, Bunt J, et al. Integrated genomics identifies five medulloblastoma subtypes with distinct genetic profiles, pathway signatures and clinicopathological features. PLoS One. 2008;3:e3088. doi: 10.1371/journal.pone.0003088. [DOI] [PMC free article] [PubMed] [Google Scholar]
- 14.Northcott Pa, Shih DJH, Remke M, et al. Rapid, reliable, and reproducible molecular sub-grouping of clinical medulloblastoma samples. Acta Neuropathol. 2012;123:615–26. doi: 10.1007/s00401-011-0899-7. [DOI] [PMC free article] [PubMed] [Google Scholar]
- 15.Northcott Pa, Jones DTW, Kool M, et al. Medulloblastomics: the end of the beginning. Nat Rev Cancer. 2012;12:818–834. doi: 10.1038/nrc3410. [DOI] [PMC free article] [PubMed] [Google Scholar]
- 16.Northcott PA, Korshunov A, Witt H, et al. Medulloblastoma comprises four distinct molecular variants. J Clin Oncol. 2011;29:1408–14. doi: 10.1200/JCO.2009.27.4324. [DOI] [PMC free article] [PubMed] [Google Scholar]
- 17.Packer RJ, Gajjar A, Vezina G, et al. Phase III study of craniospinal radiation therapy followed by adjuvant chemotherapy for newly diagnosed average-risk medulloblastoma. J Clin Oncol. 2006;24:4202–8. doi: 10.1200/JCO.2006.06.4980. [DOI] [PubMed] [Google Scholar]
- 18.Patel AP, Tirosh I, Trombetta JJ, et al. Single-cell RNA-seq highlights intratumoral heterogeneity in primary glioblastoma. Science. 2014;344:1396–401. doi: 10.1126/science.1254257. [DOI] [PMC free article] [PubMed] [Google Scholar]
- 19.Pei Y, Moore CE, Wang J, et al. An Animal Model of MYC-Driven Medulloblastoma. Cancer Cell. 2012;21:155–167. doi: 10.1016/j.ccr.2011.12.021. [DOI] [PMC free article] [PubMed] [Google Scholar]
- 20.Polkinghorn WR, Tarbell NJ. Medulloblastoma: tumorigenesis, current clinical paradigm, and efforts to improve risk stratification. Nat Clin Pract Oncol. 2007;4:295–304. doi: 10.1038/ncponc0794. [DOI] [PubMed] [Google Scholar]
- 21.Ramaswamy V, Northcott Pa, Taylor MD. FISH and chips: the recipe for improved prognostication and outcomes for children with medulloblastoma. Cancer Genet. 2011;204:577–88. doi: 10.1016/j.cancergen.2011.11.001. [DOI] [PubMed] [Google Scholar]
- 22.Ramaswamy V, Remke M, Bouffet E, et al. Recurrence patterns across medulloblastoma subgroups: an integrated clinical and molecular analysis. Lancet Oncol. 2013;14:1200–7. doi: 10.1016/S1470-2045(13)70449-2. [DOI] [PMC free article] [PubMed] [Google Scholar]
- 23.Remke M, Hielscher T, Korshunov A, et al. FSTL5 Is a Marker of Poor Prognosis in Non-WNT/Non-SHH Medulloblastoma. J Clin Oncol. 2011;29:3852–61. doi: 10.1200/JCO.2011.36.2798. [DOI] [PubMed] [Google Scholar]
- 24.Remke M, Hielscher T, Northcott Pa, et al. Adult medulloblastoma comprises three major molecular variants. J Clin Oncol. 2011;29:2717–23. doi: 10.1200/JCO.2011.34.9373. [DOI] [PubMed] [Google Scholar]
- 25.Sottoriva A, Spiteri I, Piccirillo SGM, et al. Intratumor heterogeneity in human glioblastoma reflects cancer evolutionary dynamics. Proc Natl Acad Sci U S A. 2013;110:4009–14. doi: 10.1073/pnas.1219747110. [DOI] [PMC free article] [PubMed] [Google Scholar]
- 26.Tarbell NJ, Friedman H, Polkinghorn WR, et al. High-risk medulloblastoma: a pediatric oncology group randomized trial of chemotherapy before or after radiation therapy (POG 9031) J Clin Oncol. 2013;31:2936–41. doi: 10.1200/JCO.2012.43.9984. [DOI] [PMC free article] [PubMed] [Google Scholar]
- 27.Taylor MD, Northcott Pa, Korshunov A, et al. Molecular subgroups of medulloblastoma: the current consensus. Acta Neuropathol. 2012;123:465–72. doi: 10.1007/s00401-011-0922-z. [DOI] [PMC free article] [PubMed] [Google Scholar]
- 28.Thompson MC, Fuller C, Hogg TL, et al. Genomics identifies medulloblastoma subgroups that are enriched for specific genetic alterations. J Clin Oncol. 2006;24:1924–31. doi: 10.1200/JCO.2005.04.4974. [DOI] [PubMed] [Google Scholar]
- 29.Tibshirani R, Hastie T, Narasimhan B, Chu G. Diagnosis of multiple cancer types by shrunken centroids of gene expression. Proc Natl Acad Sci U S A. 2002;99:6567–72. doi: 10.1073/pnas.082099299. [DOI] [PMC free article] [PubMed] [Google Scholar]
- 30.Wang X, Ramaswamy V, Remke M, et al. Intertumoral and intratumoral heterogeneity as a barrier for effective treatment of medulloblastoma. Neurosurgery. 2013;60(Suppl 1):57–63. doi: 10.1227/01.neu.0000430318.01821.6f. [DOI] [PubMed] [Google Scholar]
- 31.Wu X, Northcott Pa, Dubuc A, et al. Clonal selection drives genetic divergence of metastatic medulloblastoma. Nature. 2012;482:529–33. doi: 10.1038/nature10825. [DOI] [PMC free article] [PubMed] [Google Scholar]
Associated Data
This section collects any data citations, data availability statements, or supplementary materials included in this article.
Supplementary Materials
Supplementary Fig. 1 PCA of the primary and metastatic medulloblastoma samples described in using the 1,000 most differentially expressed genes (a) and 10,000 most differentially methylated probes (b). Coloured ellipsoids (red = SHH, yellow = Group 3, green = Group 4) represent 1.5 SDs of the data distribution for each subgroup. Individual patients are indicated with a unique colour.
Supplementary Table 1. Medulloblastoma subgroup predictions and consensus using integrative genomics analysis based on gene expression and 450k DNA methylation