Abstract
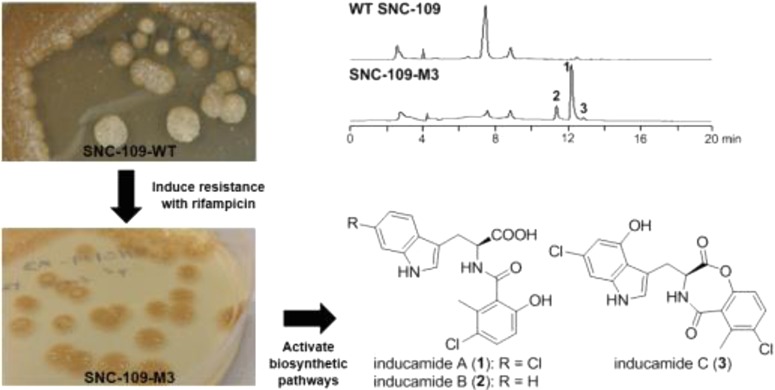
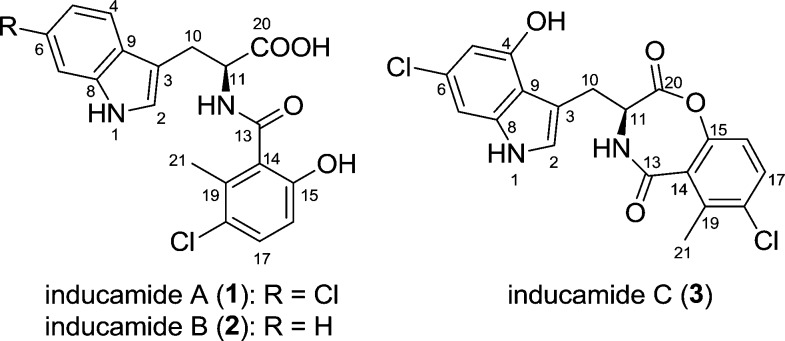
Inducamides A–C (1–3), three new chlorinated alkaloids featuring an amide skeleton generated by a tryptophan fragment and a 6-methylsalicylic acid unit, were isolated from a chemically induced mutant strain of Streptomyces sp. with the inducamides only being produced in the mutant strain. Their structures, including stereochemistry, were determined by spectroscopic analysis, Marfey’s method, and CD spectroscopy.
Over the past decade, it has become clear that many biosynthetic gene clusters in bacteria and fungi are silent under standard laboratory fermentation conditions.1 For example, the most well studied Streptomyces strain, S. coelicolor, initially produces four classes of metabolites under laboratory fermentation, but genomic characterization suggests it has the capacity to produce >30 families of metabolites.2 In order to unlock the chemical potential of these organisms, efforts are underway to combine the use of genome mining and heterologous expression.3 Until now, another seven classes of metabolites from S. coelicolor have been identified.2 An alternative approach is to activate the silent biosynthetic gene clusters under fermentation conditions.1,4 The use of histone deacetylase inhibitors and other epigenetic modifiers, pioneered by Keller and others, has become routine in the discovery of natural products from fungi.5 For bacteria, a number of groups are pursuing strategies involving the use of coculture, relying on chemical cues or physical interactions to induce metabolite production. This strategy has resulted in the isolation of emericellamides A and B.6
In a very innovative strategy, Ochi and co-workers developed a successful strategy for activating biosynthetic pathways in actinomycetes by selection of antibiotic-resistant strains with mutations in the gene encoding for the ribosomal protein S12 (RPSL, using streptomycin) or RNA polymerase β-subunit (RNAP, using rifampicin).7 The strategy works because these mutations modulate bacterial gene expression, including natural product biosynthetic pathways. This method has been utilized to induce production of the antimicrobial cyclic peptide piperidamycin A.8
In order to exploit the potential of tapping into greater biosynthetic capacity, we selected a subset of ∼20 actinomycete strains from our microbial collection that showed limited metabolite production as analyzed by LC–MS and had no antimicrobial activity in a disk-diffusion assay against Bacillus subtilis. The 20 strains were subjected to RNAP engineering with various concentrations of rifampicin (10–1000 μg/mL), and all rifampicin-induced resistant mutants were subjected to small-scale fermentation and LC–MS analysis to look for changes in metabolite production. Herein we report the induction of the chlorinated metabolites inducamides A–C (1–3) from a mutant strain of Streptomyces sp. designated as strain SNC-109-M3 (Figure 1). Details of mutant strain generation can be found in the Supporting Information.
Figure 1.
Structures of inducamides A–C.
Streptomyces sp. mutant strain SNC-109-M3 was obtained by selection with 64 μg/mL rifampicin, and the mutation was determined to have a X442F mutation of the β subunit of bacterial RNA polymerase (Figure 2b). We also found the major peak in wild type strain SNC-109 at 7.5 min was also present in mutant strain SNC-109-M3, which confirmed that SNC-109-M3 was derived from the parental strain. Fermentation of the mutant strain using a seawater-based medium in a 2.8 L flask and subsequent purification gave inducamide A (1) as a colorless oil. The negative ESIMS spectrum exhibited a characteristic chlorinated quasimolecular ion peak cluster at m/z 405/407/409 [M – H]− with a ratio of 9:6:1, indicating two chlorine atoms in the molecule. The molecular formula could be determined as C19H16N2O4Cl2 by HRESIMS at m/z 405.0413 [M – H] – (calcd for C19H15N2O4Cl2, 405.0414). Analysis of the 13C NMR and HSQC data for 1 (Table 1) revealed nine quaternary carbons (one carbonyl and eight olefinic carbons), seven methine groups (six olefinic carbons and one α-carbon of amino acid), one sp3 methylene carbon, and one methyl carbon.
Figure 2.
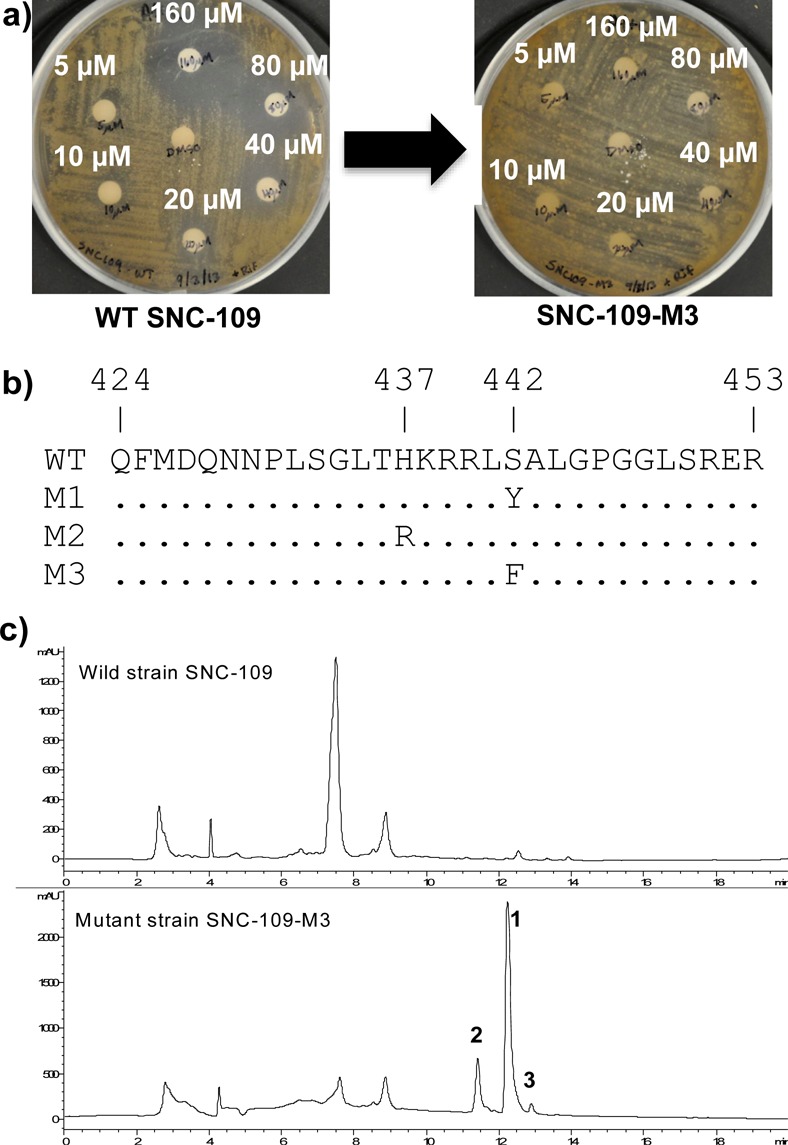
(a) Wild-type strain SNC-109 and rifampicin-resistant mutant strains SNC-109-M3 grown on media. Multiple concentrations of rifampicin on the different disks. (b) Mutation analysis of the β-subunit of bacterial RNA polymerase (RNAP) of SNC-109-M1, -M2, and -M3. RNAP gene segment for the wild-type and three mutants. Amino acid numbering based on S. coelicolor A3. (c) LC–MS traces of SNC-109 wild type and mutant strain SNC-109-M3. Compounds 1–3 can only be observed in the mutant strain (UV detection at λ 280 nm). The major peak in wild type strain SNC-109 at 7.5 min has a significantly different UV profile (Figure S5, Supporting Information).
Table 1. 1H (600 MHz) and 13C (100 MHz) NMR Data of 1 and 2 in CD3OD.
|
1 |
2 |
|||
|---|---|---|---|---|
| no. | δH, mult (J, Hz) | δC | δH, mult (J, Hz) | δC |
| 2 | 7.21, s | 125.7, CH | 7.19, s | 124.6, CH |
| 3 | 111.9, C | 111.1, C | ||
| 4 | 7.62, d (8.5) | 120.5, CH | 7.63, d (7.9) | 119.3, CH |
| 5 | 6.97, dd (8.5, 1.8) | 120.2, CH | 7.00, t (7.3) | 119.7, CH |
| 6 | 128.2, C | 7.08, t (7.3) | 122.3, CH | |
| 7 | 7.31, d (1.8) | 111.5, CH | 7.32, d (8.1) | 112.2, CH |
| 8 | 138.3, C | 138.0, C | ||
| 9 | 127.6, C | 128.8, C | ||
| 10 | 3.43, dd (14.8, 4.6) 3.19, dd (14.8, 8.8) | 28.3, CH2 | 3.41, dd (14.8, 5.0) 3.23, dd (14.8, 8.6) | 28.4, CH2 |
| 11 | 4.87, dd (8.8, 4.6) | 55.0, CH | 4.93, dd (8.6, 5.0) | 55.1, CH |
| 13 | 170.3, C | 170.3, C | ||
| 14 | 127.5, C | 127.6, C | ||
| 15 | 154.3, C | 154.4, C | ||
| 16 | 6.66, d (8.8) | 115.5, CH | 6.66, d (8.8) | 115.5, CH |
| 17 | 7.16, d (8.8) | 131.2, CH | 7.16, d (8.7) | 131.2, CH |
| 18 | 125.6, C | 125.6, C | ||
| 19 | 135.2, C | 135.2, C | ||
| 20 | 175.4, C | 175.5, C | ||
| 21 | 2.07, s | 17.1, CH3 | 2.06, s | 17.0, CH3 |
The 1H NMR spectrum (Table 1) showed three signals at δH 7.62 (1H, d, J = 8.5), 7.31 (1H, d, J = 1.8), and 6.97 (1H, dd, J = 8.5, 1.8), attributed from three protons of a 1,3,4-trisubstituted benzene nucleus. The signals at δH 7.16 (1H, d, J = 8.8) and 6.66 (1H, d, J = 8.8) suggested a 1,2,3,4-tetrasubstituted aromatic system. The signal at δH 7.21 (1H, s) and the HMBC correlations of H-2 to C-8 and C-9, H-4 to C-3 and C-6, H-5 to C-7 and C-9, and H-7 to C-5 and C-9 indicated a 3,6-disubstituted indole fragment. On the basis of the signals at δH/C 3.43 (1H, dd, J = 14.8, 4.6), 3.19 (1H, dd, J = 14.8, 8.8)/28.3 (CH2) and δH/C 4.87 (1H, dd, J = 8.8, 4.6)/55.0 (CH), a 6-chlorotryptophan fragment was suggested. The COSY correlation between H-16 and H-17 and the HMBC correlations of H-16 to C-14 and C-18, H-17 to C-15 and C-19, and 21-CH3 to C-14 and C-18 indicated the 3-chloro-6-hydroxy-2-methylbenzoic acid fragment. Because the key HMBC correlations connecting these two fragments were not detected, there were two possible connections between the two fragments involving either an amide or an ester linkage (Figure S1, Supporting Information).
In order to determine the correct connection, a methylation reaction was carried out using TMS-CHN2, and LC–MS analysis revealed the presence of two methyl groups corresponding to formation of a methyl ester at C-20 and a C-15 methyl ether (Scheme S1, Supporting Information). Thus, the structure of 1 was assigned as depicted. In order to determine the absolute configuration of the 6-chloro-tryptophan unit we utilized Marfey’s method.9 The 1-fluoro-2,4-dinitrophenyl-5-l-valine amide (l-FDVA) derivative of the acid hydrolysates of 1, l-FDVA derivative of authentic 6-Cl-l-Trp, and d-FDVA derivative of authentic 6-Cl-l-Trp were obtained. HPLC analysis of them indicated that the l-FDVA derivative of the acid hydrolysates of 1 gave the same retention time as the l-FDVA derivative of authentic 6-Cl-l-Trp (Figure S3, Supporting Information), thus establishing the l-configuration.
Inducamide B (2) was nearly identical to 1 by 1H and 13C NMR. The molecular formula was determined to be C19H17N2O4Cl, indicating that one of the −Cl atoms of 1 was replaced by a −H. Analysis of the 1H NMR revealed a spin-system reminiscent of 1,2-disubstituted benzene at δH 7.63 (1H, d, J = 7.9), 7.32 (1H, d, J = 8.1), 7.08 (1H, t, J = 7.3), and 7.00 (1H, t, J = 7.3). The 1H and 13C NMR data of compound 2 were almost the same as those of compound 1 except that the 3,6-disubstituted indole of 1 was replaced by a 3-substituted indole of 2. The HMBC correlations of H-10 to C-20, and H-11 to C-13 and C-20 confirmed the connection between tryptophan and 3-chloro-6-hydroxy-2-methylbenzoic acid (Figure 3). By using a strategy similar to that described above, the absolute configuration of tryptophan unit was determined to be l using an authentic l-Trp sample (Figure S2, Supporting Information).
Figure 3.
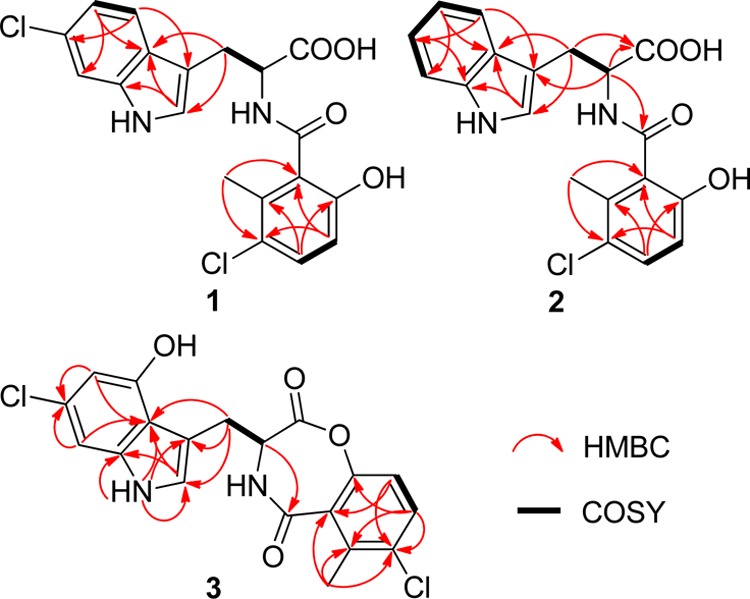
Key correlations for the structural assignment of 1–3.
Inducamide C (3) was obtained as a white powder. The negative ESIMS spectrum exhibited a characteristic chlorinated quasimolecular ion peak cluster at m/z 403/405/407 [M – H]− with a ratio of 9:6:1, indicating two chlorine atoms in the molecule. The molecular formula was determined as C19H14N2O4Cl2 according to its HRESIMS peak at m/z 403.0271 [M – H]−. Comparison of the 1H and 13C NMR spectra of 3 (Table S1, Supporting Information) with those of 1 showed that the methine signal at δH/C 7.62/119.2 in 1 was replaced by a quaternary carbon signal at δC152.4 in 3. In addition, C-5 and C-9 were shifted upfield, indicating the H-4 in 1 was replaced by an −OH group in compound 3.
Moreover, C-16 was shifted upfield, suggesting the 15-OH was esterified with the carboxyl to form a seven-membered ring. The 2D NMR confirmed this structure, with the key HMBC correlations being H-5 to C-6 and C-9, H-7 to C-6 and C-9, 1-NH to C-2, C-3, C-8 and C-9, H-2 to C-8 and C-9, H-10 to C-2, C-3 and C-9, H-11 to C-13, H-16 to C-14 and C-18, H-17 to C-15, C-18 and C-19, and 21-CH3 to C-14, C-18 and C-19 (Figure 3).
On the basis of the biosynthetic arguments, it could be assumed that the stereochemistry of the tryptophan moiety in 3 is the same as 1 and 2. When we measured the CD spectrum of 3 in MeOH at 0.1 mM, we observed a signal that was indicative of exciton coupling,10 which showed a negative bisignate Cotton effect [λmax (Δε) 286 (−5.5), 234 (+19.8)] (Figure 4). We hypothesize this could be due to exciton coupling between the π–π* transitions of the two chromophores: the indole unit and the benzoyloxy group. Application of the Harada–Nakanishi nonempirical rule10 for exciton chirality CD predicated the negative and positive bisignate Cotton effects for (11S)- and (11R)-isomers, respectively (Figure 4).
Figure 4.
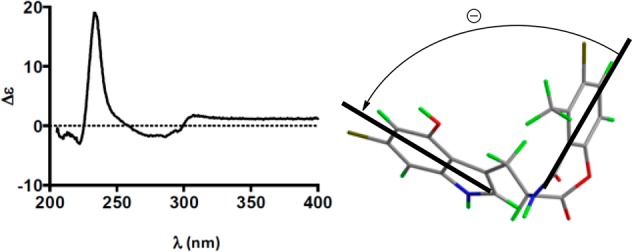
Experimental CD spectra and stereoview of 3 displaying the negative helicity between chromophores. Bold lines denote the electric dipole of the chromophores.
The formation of 1 and 2 is relatively straightforward (Figure 5), with the 2-methyl-3-chlorosalicylic acid moiety most likely originating from polyketide biosynthesis (although it could be shikimate derived) and subsequently chlorinated to yield 6-hydroxy-3-chloro-2-methylbenzoic acid.11 The acylation of the salicylic acid with L-tryptophan resulted in compound 2 ,which was chloridated to yield compound 1.12 Inducamide C (3), however, involves a few additional steps, oxidation of of 6-chloro-L-tryptophan at C-4 and an unusual intramolecular esterification to form the seven membered ring of 3. This type of cyclization has been encountered only in a metabolite of a marine Streptomyces strain.13 In the context that these molecules are only produced in the mutant SNC-109 strains, it seems most probable that the RNAP mutations activate chlorosalicylic acid production.
Figure 5.
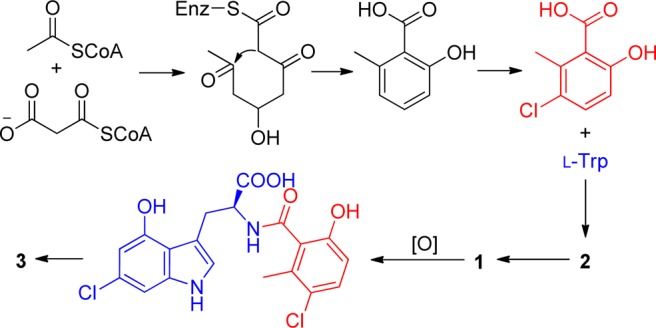
Plausible biosynthetic pathway of 1–3.
The antibacterial activities for compounds 1–3 against Pseudomonas aeruginosa and Bacillus subtilis were evaluated by an agar dilution method. These compounds did not show significant antibacterial activities (IC50 ≥ 50 μM). Compound 3 does exhibit modest cytotoxicity against the NSCLC cell line HCC44 at 10 μM.
The introduction of mutations into the ribosome or RNA polymerase of actinomycetes has been demonstrated by Ochi to be a straightforward approach for induction of secondary metabolites. We have exploited this method with a Streptomyces strain that produced relatively few compounds as analyzed by LC–MS. We believe this straightforward method, coupled with advances in LC–MS technology, provides a high-throughput method for inducing/enhancing production of microbial metabolites. It is important to note that although we identify mutations in RNAP in SNC-109-M3, there is the possibility of additional mutations in the bacterial genome, which could be responsible for the induced expression. Further studies by our laboratory and others are needed to understand the empirical data.
Acknowledgments
We thank Rebecca Goss (St. Andrews University) for providing 6-chloro-l-tryptophan for an authentic standard. We acknowledge the following grants for funding this project: Welch Foundation I-1689 and NIH R01CA1499833. J.B.M. is a Chilton/Bell Foundation Endowed Scholar.
Supporting Information Available
General procedures, bioassay protocols, data tables, and NMR spectra. This material is available free of charge via the Internet at http://pubs.acs.org.
Author Contributions
† These authors contributed equally to this work
The authors declare no competing financial interest.
Funding Statement
National Institutes of Health, United States
Supplementary Material
References
- a Nützmann H.; Reyes-Dominguez Y.; Scherlach K.; Schroeckh V.; Horn F.; Gacek A.; Schümann J.; Hertweck C.; Strauss J.; Brakhage A. A. Proc. Natl. Acad. Sci. U.S.A. 2011, 108, 14282–14287. [DOI] [PMC free article] [PubMed] [Google Scholar]; b Bok J. W.; Chiang Y.; Szewczyk E.; Reyes-Dominguez Y.; Davidson A. D.; Sanchez J. F.; Lo H.; Watanabe K.; Strauss J.; Oakley B. R.; Wang C. C. C.; Keller N. P. Nat. Chem. Biol. 2009, 5, 462–464. [DOI] [PMC free article] [PubMed] [Google Scholar]; c Brakhage A. A.; Schroeckh V. Fungal Genet. Biol. 2011, 48, 15–22. [DOI] [PubMed] [Google Scholar]
- a Bentley S. D.; Chater K. F.; Cerdeño-Tárraga A.-M.; Challis G. L.; Thomson N. R.; James K. D.; Harris D. E.; Quail M. A.; Kieser H.; Harper D.; Bateman A.; Brown S.; Chandra G.; Chen C. W.; Collins M.; Cronin A.; Fraser A.; Goble A.; Hidalgo J.; Hornsby T.; Howarth S.; Huang C.-H.; Kieser T.; Larke L.; Murphy L.; Oliver K.; O’Neil S.; Rabbinowitsch E.; Rajandream M.-A.; Rutherford K.; Rutter S.; Seeger K.; Saunders D.; Sharp S.; Squares R.; Squares S.; Taylor K.; Warren T.; Wietzorrek A.; Woodward J.; Barrell B. G.; Parkhill J.; Hopwood D. A. Nature 2002, 417, 141–147. [DOI] [PubMed] [Google Scholar]; b Nett M.; Ikeda H.; Moore B. S. Nat. Prod. Rep. 2009, 26, 1362–1384. [DOI] [PMC free article] [PubMed] [Google Scholar]
- a Gomez-Escribano J. P.; Bibb M. J. J. Ind. Microbiol. Biotechnol. 2014, 41, 425–431. [DOI] [PubMed] [Google Scholar]; b Ongley S. E.; Bian X.; Neilan B. A.; Muller R. Nat. Prod. Rep. 2013, 30, 1121–1138. [DOI] [PubMed] [Google Scholar]
- Chiang Y.; Chang S.; Oakley B. R.; Wang C. C. C. Curr. Opin. Chem. Biol. 2011, 15, 137–143. [DOI] [PMC free article] [PubMed] [Google Scholar]
- a Shwab E. K.; Bok J. W.; Tribus M.; Galehr J.; Graessle S.; Keller N. P. Eukaryotic Cell 2007, 6, 1656–1664. [DOI] [PMC free article] [PubMed] [Google Scholar]; b Williams R. B.; Henrikson J. C.; Hoover A. R.; Lee A. E.; Cichewicz R. H. Org. Biomol. Chem. 2008, 6, 1895–1897. [DOI] [PubMed] [Google Scholar]; c Henrikson J. C.; Hoover A. R.; Joyner P. M.; Cichewicz R. H. Org. Biomol. Chem. 2009, 7, 435–438. [DOI] [PubMed] [Google Scholar]; d Cichewicz R. H. Nat. Prod. Rep. 2010, 27, 11–22. [DOI] [PMC free article] [PubMed] [Google Scholar]
- Oh D.; Kauffman C. A.; Jensen P. R.; Fenical W. J. Nat. Prod. 2007, 70, 515–520. [DOI] [PubMed] [Google Scholar]
- a Ochi K.; Okamoto S.; Tozawa Y.; Inaoka T.; Hosaka T.; Xu J.; Kurosawa K. Adv. Appl. Microbiol. 2004, 56, 155–184. [DOI] [PubMed] [Google Scholar]; b Ochi K.; Hosaka T. Appl. Microbiol. Biotechnol. 2013, 97, 87–98. [DOI] [PMC free article] [PubMed] [Google Scholar]
- Hosaka T.; Ohnishi-Kameyama M.; Muramatsu H.; Murakami K.; Tsurumi Y.; Kodani S.; Yoshida M.; Fujie A.; Ochi K. Nat. Biotechnol. 2009, 27, 462–464. [DOI] [PubMed] [Google Scholar]
- Marfey P. Carlsberg Res. Commun. 1984, 49, 591–596. [Google Scholar]
- Harada N.; Nakanishi K.. Circular Dichroic Spectroscopy: Exciton Coupling in Organic Stereochemistry; University Sciences Books: Mill Valley, CA, 1983. [Google Scholar]
- Jia X. Y.; Tian Z. H.; Shao L.; Qu X. D.; Zhao Q. F.; Tang J.; Tang G. L.; Liu W. Chem. Biol. 2006, 13, 575–585. [DOI] [PubMed] [Google Scholar]
- Seibold C.; Schnerr H.; Rumpf J.; Kunzendorf A.; Hatscher C.; Wage T.; Ernyei A. J.; Dong C. J.; Naismith J. H.; van Pée K. H. Biocatal. Biotransform. 2006, 24, 401–408. [Google Scholar]
- Ma Z.; Yu L.; Wang D.; Hu Z.; Hu Z. Chinese Patent CN103980266A, 2014.
Associated Data
This section collects any data citations, data availability statements, or supplementary materials included in this article.


