The authors of this study sought to determine if quantitative CT fibrosis score can replace diffusion capacity of carbon monoxide results in a modified clinical model that includes gender, age, and physiology (GAP model) with comparable performance to offer an important and simpler alternative to the GAP model for determining risk of death in patients with idiopathic pulmonary fibrosis.
Abstract
Purpose
To investigate the prognostic value of quantitative computed tomographic (CT) scoring for the extent of fibrosis or emphysema in the context of a clinical model that includes the gender, age, and physiology (GAP model) of the patient.
Materials and Methods
Study cohorts were approved by local institutional review boards, and all patients provided written consent. This was a retrospective cohort study that included 348 patients (246 men, 102 women; mean age, 69 years ± 9) with idiopathic pulmonary fibrosis from two institutions. Fibrosis and emphysema visual scores were independently determined by two radiologists. Models were based on competing risks regression for death and were evaluated by using the C index and reclassification improvement.
Results
The CT-GAP model (a modification of the original GAP model that replaces diffusion capacity of carbon monoxide with CT fibrosis score) had accuracy comparable to that of the original GAP model, with a C index of 70.3 (95% confidence interval: 66.4, 74.0); difference in C index compared with the GAP model of −0.4 (95% confidence interval: −2.2, 3.4). The performance of the original GAP model did not change significantly with the simple addition of fibrosis score, with a change in C index of 0.0 (95% confidence interval: −1.8, 0.5) or of emphysema score, with a change in C index of 0.0 [95% confidence interval: −1.3, 0.4]).
Conclusion
CT fibrosis score can replace diffusion capacity of carbon monoxide test results in a modified GAP model (the CT-GAP model) with comparable performance. This may be a useful alternative model in situations where CT scoring is more reliable and available than diffusion capacity of carbon monoxide.
© RSNA, 2014
Introduction
Idiopathic pulmonary fibrosis (IPF) is a chronic, progressive fibrotic lung disease of unknown cause characterized by the usual interstitial pneumonia pattern at histopathologic examination (1). IPF has a poor prognosis, with an overall median survival time of approximately 3 years. However, the clinical course varies substantially, with some individuals living only a few months and others living many years after diagnosis (2,3). Predicting which course a patient’s disease will take remains a difficult challenge for clinicians and researchers (4–7).
Recently, a validated clinical model (the GAP [gender, age, and physiology] model) was shown to be useful for determination of risk of death for patients with IPF on the basis of four predictors: sex, age, forced vital capacity (FVC), and diffusion capacity of carbon monoxide (DLCO) (7). The advantage of the variables in the GAP model is that they are commonly evaluated in patients with IPF by clinicians and researchers at the time of initial evaluation. Therefore, we believe that the GAP model is the most relevant base model for evaluating the additive value of new prognostic variables for patients with IPF. However, DLCO can be difficult to obtain in certain settings; some patients with IPF simply cannot complete the test, and there is appreciable interfacility and intrapatient variability (8).
Computed tomography (CT) of the chest has a central role in the diagnosis of IPF and is performed in virtually all patients with IPF. Quantitative CT scoring has been developed as a prognostic tool, and methods of quantification are becoming automated. The extent of fibrosis as quantified at CT (ie, the fibrosis score) has been consistently associated with survival in patients with IPF (9–13). The extent of emphysema at CT (ie, the emphysema score) also has been associated with survival in patients with IPF; however, the findings are less consistent among studies (14–17). Before adoption into clinical practice and research protocols, the precise role and contribution of these scores should be well defined in relation to already available clinical variables.
The purpose of this study was to investigate the prognostic value of CT scoring for the extent of fibrosis or emphysema in the context of the GAP model, either by adding to the performance of the GAP model or by replacing variables of the model without compromising its performance. Our hypothesis was that quantitative CT scores would improve prognostic performance with the GAP model.
Materials and Methods
The original study of prospectively enrolled patients and cohorts was Health Insurance Portability and Accountability Act compliant, was approved by local institutional review boards, and all patients provided informed written consent. This retrospective study was exempt from additional institutional review board approval because it was an analysis of preexisting data, and all patient identifiers had been removed from the data. There was no industry support for this study.
Study Patients
We identified study patients from two separate cohorts of patients with IPF. Cohort 1 (n = 176) included patients enrolled in the University of California, San Francisco interstitial lung disease longitudinal cohort study between 2001 and 2010. Cohort 2 (n = 172) included patient data entered in the Mayo Clinic, Rochester database between 2000 and 2010. For inclusion, patients were required to have (a) received a diagnosis of IPF according to 2000 consensus criteria (18), (b) undergone pulmonary function testing within 6 months of the initial clinical evaluation (ie, study baseline), and (c) undergone a CT examination within 1 year of the initial clinical evaluation (ie, study baseline) that was available for review. There were no exclusion criteria. These patients comprised subcohorts of patients who were part of a previous study on the derivation and validation of the GAP models (7). Table 1 shows the baseline characteristics of the patient cohorts.
Table 1.
Patient Characteristics
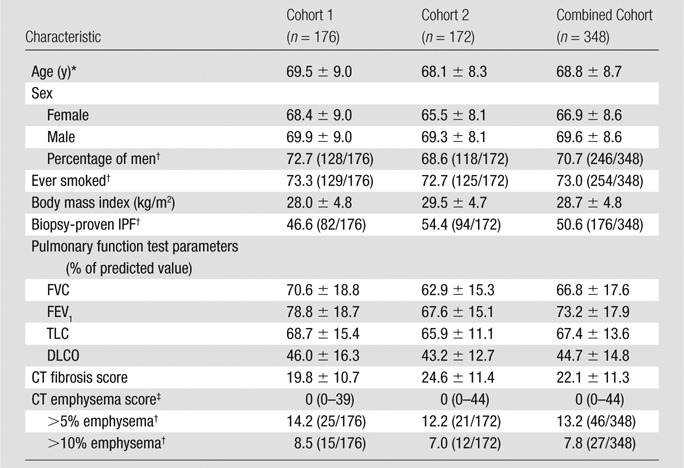
Note.—Unless otherwise indicated, data are means ± standard deviation. FEV1 = forced expiratory volume after 1 second, TLC = total lung capacity.
There was no significant difference in the age of men compared with that of women in cohort 1 (P = .31), but there was a significant difference in cohort 2 (P = .005) and the overall cohort (P = .006). Comparison made with t test.
Data are percentages, with numerator and denominator in parentheses.
Data are medians, with the range in parentheses.
Outcome
The outcome was death, with lung transplantation treated as a competing risk. Vital status and date of death were verified by using database records and the United States Social Security Death Index.
Independent Variables
The primary independent variables for this study were CT fibrosis score (score, 0–100) and CT emphysema score (score, 0–100). Additional variables included as covariates were the four individual variables of the GAP model (age, gender, percentage of predicted FVC, and percentage of predicted DLCO), and the GAP score itself (the linear variable of the GAP continuous model [7]).
All CT examinations were performed in a routine clinical care setting by using four–, 16–, or 64–detector row CT scanners (GE, Milwaukee, Wis) with a standard interstitial lung disease protocol. Axial images were obtained at full inspiration with patients in the supine and prone positions; only images with patients in the supine position were used for analysis. Thin sections (1.25 mm) were imaged at 1-cm intervals, and images were reconstructed by using an edge-enhancing (bone) algorithm. Scanner parameters were as follows: axial mode, 120 kVp; milliampere adjustment, automatic; pitch, 1.0. Images were analyzed by using a picture archiving and communication system (Agfa, Mortsel, Belgium) with standard CT windows (level, 700 HU; width, 1000 HU).
Two experienced chest radiologists (B.M.E. and T.E.H, with 8 and 21 years of experience) who were blinded to clinical data independently assessed CT images for the extent of fibrosis and emphysema by using a standard protocol (12). These radiologists determined the percentage of lung affected by fibrosis (including extent of reticulation and honeycombing) and emphysema (defined as low attenuation areas with a barely perceptible or undetectable wall), rounded to the nearest 5%. The lungs were divided into six distinct zones, three on each side. The upper lung zone was located at and above the level of the aortic arch. The midlung zone was located between the aortic arch and the inferior pulmonary veins. The lower lung zone was located at and below the inferior pulmonary veins. Radiologists performed a visual assessment of all images in each zone to determine the percentage of lung affected by fibrosis and emphysema. The values from these six lung zones were then averaged to produce an overall percentage of fibrosis (the fibrosis score) and emphysema (the emphysema score) for each subject. A total of 14 CT examinations were read by only one radiologist to protect the anonymity of the patients (the CT scans were unable to be deidentified for sending to an outside institution). In these cases, the scores of the single radiologist reading the study were used. In all other cases, the average of the two radiologists’ readings was used for the main analysis, with sensitivity analyses performed by each radiologist. FVC and DLCO were performed according to standard criteria (8,19,20).
Statistical Analysis
All analyses were performed by using software (Stata 13; StataCorp, College Station, Tex). Emphysema score had a highly skewed distribution and was transformed to the natural logarithmic scale after adding 1 to avoid losing zero values. Interobserver reliability for CT fibrosis score and emphysema score was assessed by using intraclass correlation. Correlations between variables were determined by using Spearman correlation coefficients.
It is generally accepted that no more than one independent variable for every 10 uncensored outcomes in the derivation cohort should be considered for inclusion in the final multivariate model to avoid overfitting the model (21). Our derivation cohort had 83 deaths, implying that up to eight variables (83 divided by 10) could safely be considered. We screened only six variables in this study. We then sought further protection against overfitting by cross-validating the summary statistic used to compare candidate models.
Fine-Gray models for risk of death were used, treating transplantation as a competing risk (22). Subdistribution hazard ratios were used to summarize variable effects in these models. We first evaluated the unadjusted association of each variable with death followed by adjustment for DLCO, FVC, and the calculated GAP score (Appendix E1 [online], Table E1 [online]). Next, we compared a base model, which included the calculated GAP score as the only variable, to augmented models also including the fibrosis or emphysema score. Our first measure of potential model improvement was change in the cross-validated C index, an optimism-corrected measure of discrimination (21). The C index is similar to the more familiar area under the receiver operating characteristic curve for binary outcomes for estimating the concordance between predicted and observed outcomes when censoring is present. The C index accommodates censoring in survival data by focusing estimation on usable pairs in which one subject is known to fail before the other, who may fail later or be censored. The range of the C index is 0%–100%, with 50% indicating no predictive discrimination, and 100% indicating perfect discrimination. The approach of Wolbers et al (23) was used to calculate the C index in the presence of a competing risk, with 20 repetitions of 10-fold cross-validation to minimize optimism. Our second measure was the net reclassification improvement (NRI), based on three strata of 1-year mortality corresponding to the GAP stages (7): less than 10%, low risk (GAP stage I); 10%–30%, intermediate risk (GAP stage II); and greater than 30%, high risk (GAP stage III). NRI is the net proportion of surviving or dying patients correctly reclassified into a lower- or higher-risk stratum, respectively. We also calculated clinical NRI by using a correction for asymmetry (24,25). Clinical NRI is a measurement of the net proportion of patients at intermediate risk (GAP stage II) correctly reclassified into the low- or high-risk strata (GAP stage I or III, respectively), in which treatment implications are clearer than those for the intermediate risk group, in view of the average 1-year mortality after lung transplantation of approximately 20% (26). Bootstrap resampling with 500 repetitions was used to calculate 95% bias-corrected confidence intervals (CIs) for the cross-validated C index and between-model differences, while CIs for NRI and clinical NRI were calculated by using normal approximation. The analysis was performed in each cohort independently and then combined. Analyses were repeated in the combined cohort by using each individual radiologist’s reading alone as a sensitivity analysis.
To obtain a model potentially including fibrosis and/or emphysema scores, we estimated the cross-validated C index for all potential models containing combinations of the individual GAP variables and quantitative CT scores. The CT-GAP model, with fibrosis score in place of DLCO, was selected on the basis of clinical utility and optimization of the cross-validated C index and was compared with the GAP model by determining the difference in the C index. Calibration was assessed by comparing mean model-based and observed mortality according to GAP stage, with stage II further substratified into three risk groups (stages IIa–IIc) to better assess calibration in this intermediate risk group. Finally, for ease of clinical use, the CT-GAP model was modified to use categorical versions of the four included variables. To avoid overfitting, cut points for categorization were determined by optimizing the cross-validated C index.
Results
Cohort Characteristics and Radiologic Evaluation
Overall, there were 194 deaths and 30 lung transplantations (83 deaths and 20 lung transplantations in cohort 1 and 111 deaths and 10 lung transplantations in cohort 2) with a median follow-up time of 2.5 years. The median time to death or transplantation was 2.9 years (3.0 years and 2.8 years in cohorts 1 and 2, respectively).
The intraclass correlation coefficient between radiologists was 81.7% (95% CI: 78.1%, 85.3%) for fibrosis score and 86.6% (95% CI: 83.9%, 89.3%) for emphysema score. The mean ± standard deviation interval between CT examination and clinical evaluation was 10 days ± 71; more than 85% of CT examinations were performed within 3 months and more that 95% were performed within 6 months. The mean interval between CT examination and pulmonary function test was 13 days ± 84.
Relationships among Quantitative CT Scores, GAP Variables, and Risk of Death
CT fibrosis score had a weak positive correlation with age (r = 0.18, P ≤ .001) and a moderate negative correlation with FVC (r = −0.47, P ≤ .001) and DLCO (r = −0.37, P ≤ .001) (Appendix E1 [online], Table E2 [online]). Men had a higher mean fibrosis score than did women (22.9 vs 20.2, respectively; P = .041), and patients who were unable to perform the DLCO maneuver had a higher mean fibrosis score than those who were able to perform the maneuver (36.4 vs 21.1, respectively; P ≤ .001). CT emphysema score did not have a significant correlation with age (r = 0.04, P = .42), but did have a weak positive correlation with FVC (r = 0.17, P = .001) and a weak negative correlation with DLCO (r = −0.29, P ≤ .001). There was no difference in emphysema score between men and women (P = .16) or patients who were or were not able to perform the DLCO maneuver (P = .63).
CT fibrosis score was significantly associated with mortality at unadjusted analysis (P ≤ .001), but lost significance after adjustment for FVC and DLCO in combination (P = .104) (Appendix E1 [online], Table E3 [online]). CT emphysema score was not significantly associated with risk of death at unadjusted analysis (P = .074). Neither CT fibrosis score nor CT emphysema score were significantly associated with mortality after adjustment for the calculated GAP score (P = .114 and .365, respectively) (Table 2).
Table 2.
CT Fibrosis and Emphysema Scores and Risk of Death: Unadjusted and Adjusted for the GAP Score
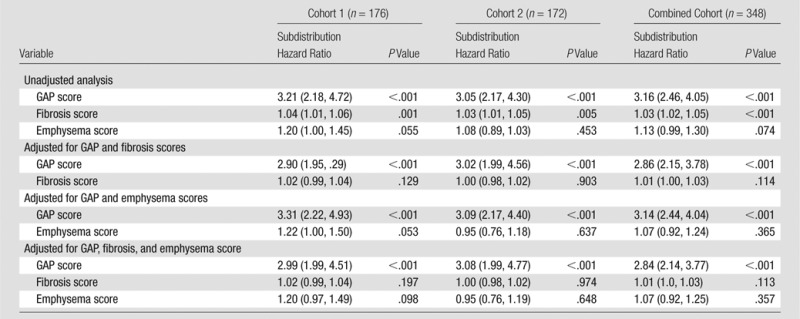
Note.—Data in parentheses are 95% CIs. Data are based on competing risk regression analysis. Emphysema score was transformed to the natural logarithmic scale.
The CT-GAP Model
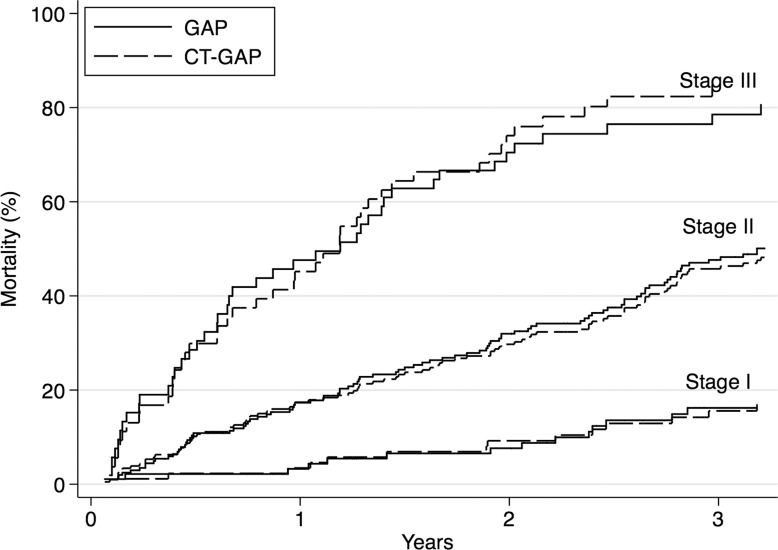
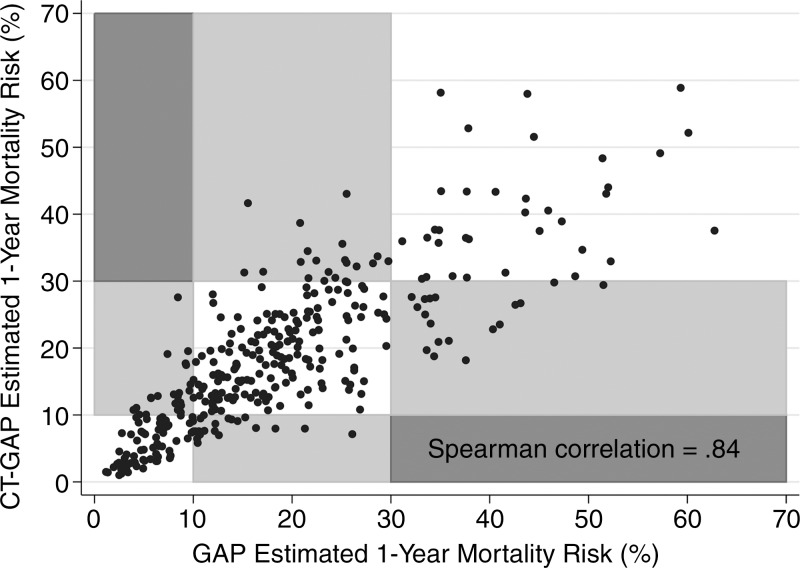
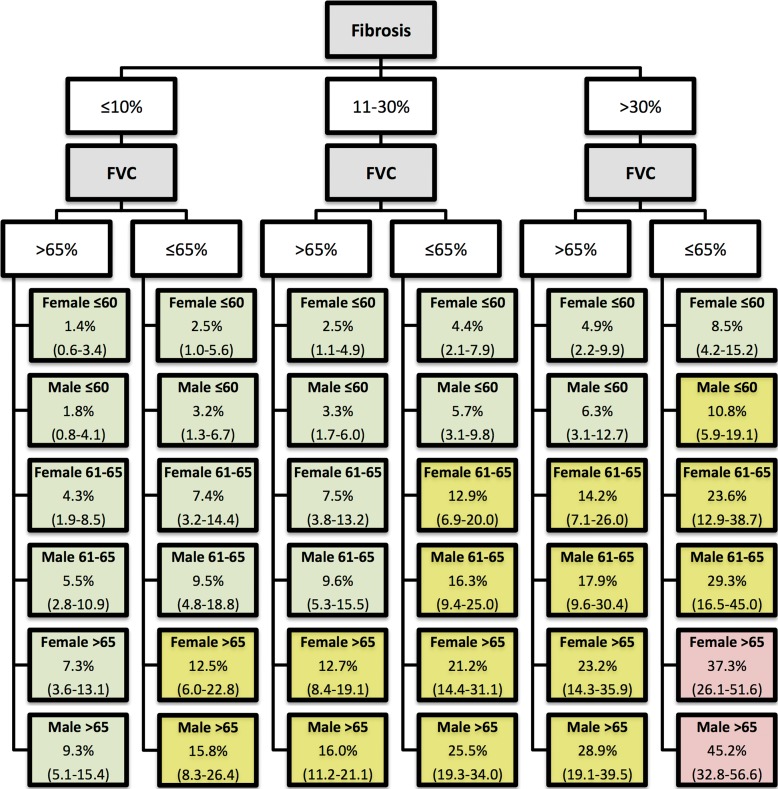
Screening all potential models with the individual GAP variables and the CT quantitative scores allowed identification of a model consisting of gender, age, FVC, and CT fibrosis score in place of DLCO (Tables 3, 4; Appendix E1 [online]; Table E1 [online]) with a C index comparable to that of the GAP model (69.2 [95% CI: 65.2, 72.9]). The C indexes for the CT fibrosis score alone and DLCO alone were nearly identical, 64.3 (95% CI: 60.0, 68.6) and 64.1 (95% CI: 59.2, 68.0), respectively. Both CT fibrosis score and DLCO significantly improved model discriminative performance when added to the remaining GAP variables alone (ie, gender, age, and FVC). The CT-GAP model demonstrated acceptable calibration in comparisons of model-based and observed risk of death. Estimated death risk by stage for the CT-GAP model was comparable to that of the GAP model (Figs 1, 2). Categorization of the CT-GAP predictors is shown in Tables 5 and 6.The categorical CT-GAP model demonstrated comparable discrimination (C index, 70.3 [95% CI: 66.4, 74.0], differences when compared with the original GAP model of −0.4 [95% CI: −2.2, 3.4]) and calibration. Figures 3 and 4 demonstrate clinical application of the categorical CT-GAP model.
Table 3.
Continuous CT-GAP Model: Multivariate Analysis for Risk of Death
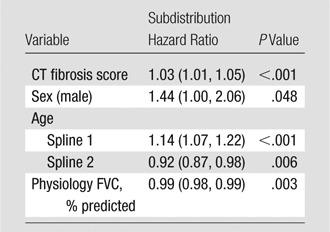
Note.—Data in parentheses are 95% CIs. Analysis was of the combined cohort. Model discrimination: C index for cohort 1, 67.6 (95% CI: 59.9, 73.2); cohort 2, 66.0 (95% CI: 59.1, 71.4); combined, 69.2 (95% CI: 65.2, 72.9).
Table 4.
Continuous CT-GAP Model: Model Calibration
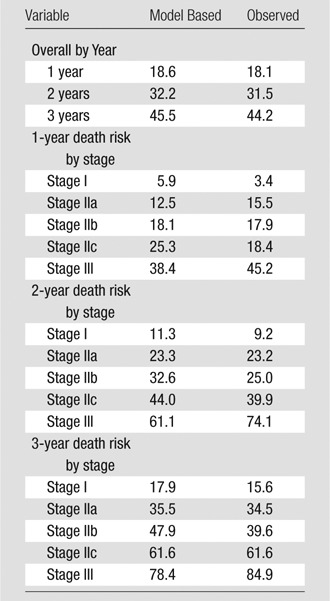
Note.—Data are percentage of patients who died. Numbers of patients: stage I, 87; stage IIa, 64; stage IIb, 72; stage IIc, 70; stage III, 53.
Figure 1:
Graph shows cumulative incidence of death by stage for the CT-GAP and original GAP models.
Figure 2:
Scatterplot shows correlation between CT-GAP–estimated and GAP-estimated risk of death. Grid boxes are shaded according to the shift in GAP stage between the two models. White boxes represent no shift in GAP stage between the two models, whereas light gray boxes represent a one-stage shift and dark gray boxes represent a two-stage shift. No patients were shifted two stages between the two models. GAP stage I = less than 10% risk of death in 1 year, GAP stage II = 10%–30% risk of death in 1 year, and GAP stage III = more than 30% risk of death in 1 year.
Table 5.
Categorical CT-GAP Model: Multivariate Analysis
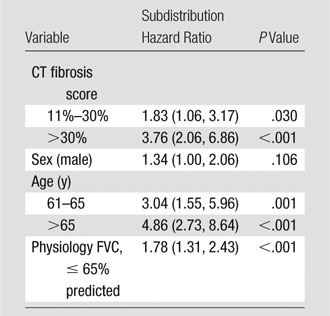
Note.—Data in parentheses are 95% CIs. Multivariate analysis was of the combined cohort. Model discrimination: C index, cohort 1, 69.9 (95% CI: 62.4, 74.8); cohort 2, 66.8 (95% CI: 59.4, 71.2); combined, 70.3 (95% CI: 66.4, 4.0)
Table 6.
Categorical CT-GAP Model: Model Calibration
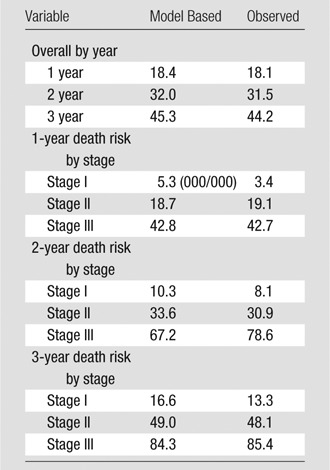
Note.—Data are percentage of patients who died. Numbers of patients: stage I, 87; stage II, 215; stage III, 44.
Figure 3:
Illustration shows the categorical CT-GAP model in simple algorithm form. Lowest tier boxes show 1-year model-estimated risk of death in percentages, with 95% CIs in parentheses according to gender and age (eg, female 61–65). Pale green boxes correspond to low 1-year risk (<10%); yellow boxes correspond to intermediate 1-year risk (10%–30%); and red boxes correspond to high 1-year risk (>30%). Fibrosis = percentage of fibrosis at CT; FVC = forced vital capacity compared with percentage predicted.
Figure 4a:
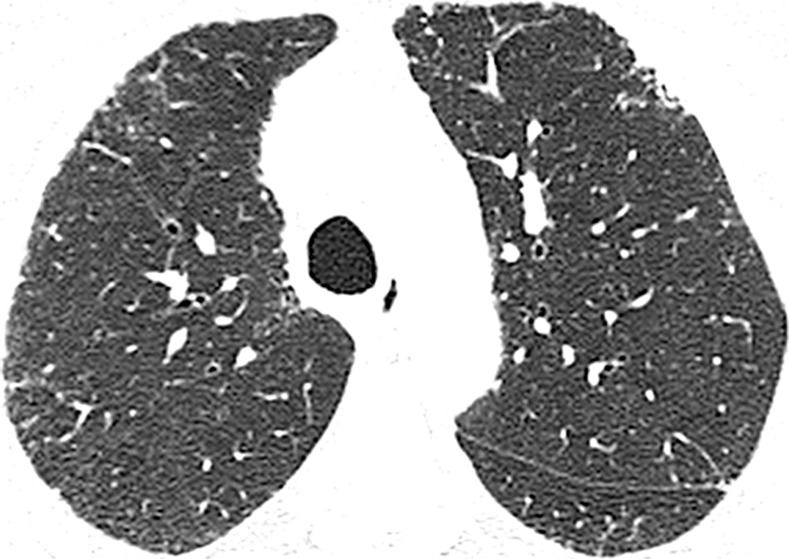
CT images show application of categorical CT-GAP model in two patient examples. Patient 1 (a–c, upper, middle, and lower lung, respectively) is a 71-year-old woman with low fibrosis score of 4 and no emphysema. FVC was 81% of predicted, and DLCO was 61% of that predicted. Patient was alive after 3.4 years of follow-up. Estimated 1-year risk of death according to CT-GAP model was 7.3% (95% CI: 3.5%, 13.1%). Patient 2 (d–f, upper, middle, and lower lung, respectively) was a 75-year-old man with high fibrosis score of 42 and no emphysema. FVC was 46% of that predicted, and DLCO was 48% of that predicted. Patient died 163 days after evaluation. Estimated one-year risk of death according to CT-GAP model was 45.2% (95% CI: 32.8%, 56.6%).
Figure 4b:
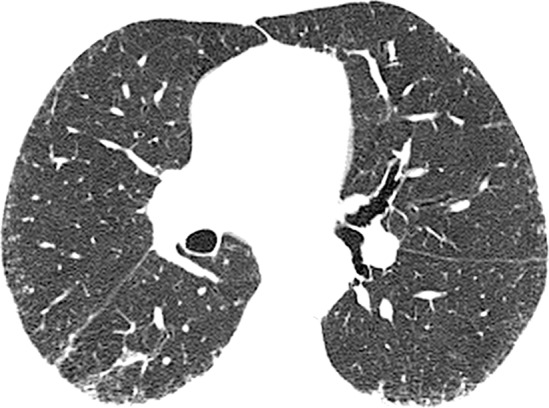
CT images show application of categorical CT-GAP model in two patient examples. Patient 1 (a–c, upper, middle, and lower lung, respectively) is a 71-year-old woman with low fibrosis score of 4 and no emphysema. FVC was 81% of predicted, and DLCO was 61% of that predicted. Patient was alive after 3.4 years of follow-up. Estimated 1-year risk of death according to CT-GAP model was 7.3% (95% CI: 3.5%, 13.1%). Patient 2 (d–f, upper, middle, and lower lung, respectively) was a 75-year-old man with high fibrosis score of 42 and no emphysema. FVC was 46% of that predicted, and DLCO was 48% of that predicted. Patient died 163 days after evaluation. Estimated one-year risk of death according to CT-GAP model was 45.2% (95% CI: 32.8%, 56.6%).
Figure 4c:
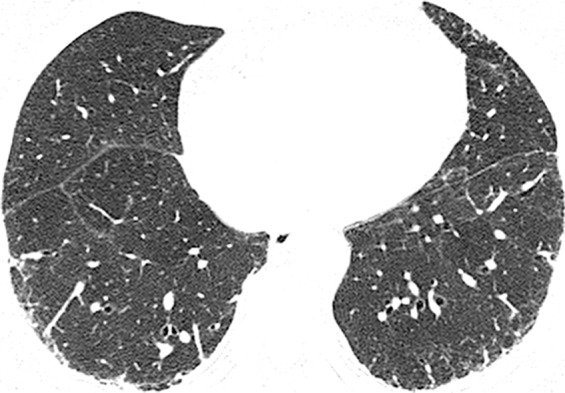
CT images show application of categorical CT-GAP model in two patient examples. Patient 1 (a–c, upper, middle, and lower lung, respectively) is a 71-year-old woman with low fibrosis score of 4 and no emphysema. FVC was 81% of predicted, and DLCO was 61% of that predicted. Patient was alive after 3.4 years of follow-up. Estimated 1-year risk of death according to CT-GAP model was 7.3% (95% CI: 3.5%, 13.1%). Patient 2 (d–f, upper, middle, and lower lung, respectively) was a 75-year-old man with high fibrosis score of 42 and no emphysema. FVC was 46% of that predicted, and DLCO was 48% of that predicted. Patient died 163 days after evaluation. Estimated one-year risk of death according to CT-GAP model was 45.2% (95% CI: 32.8%, 56.6%).
Figure 4d:
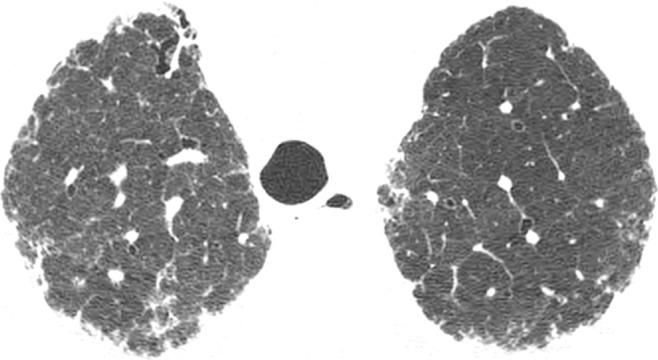
CT images show application of categorical CT-GAP model in two patient examples. Patient 1 (a–c, upper, middle, and lower lung, respectively) is a 71-year-old woman with low fibrosis score of 4 and no emphysema. FVC was 81% of predicted, and DLCO was 61% of that predicted. Patient was alive after 3.4 years of follow-up. Estimated 1-year risk of death according to CT-GAP model was 7.3% (95% CI: 3.5%, 13.1%). Patient 2 (d–f, upper, middle, and lower lung, respectively) was a 75-year-old man with high fibrosis score of 42 and no emphysema. FVC was 46% of that predicted, and DLCO was 48% of that predicted. Patient died 163 days after evaluation. Estimated one-year risk of death according to CT-GAP model was 45.2% (95% CI: 32.8%, 56.6%).
Figure 4e:
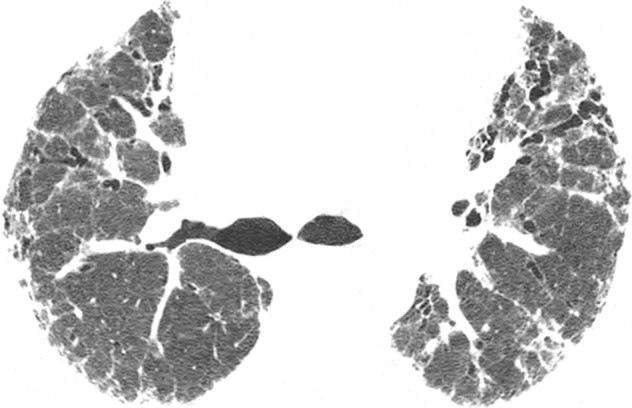
CT images show application of categorical CT-GAP model in two patient examples. Patient 1 (a–c, upper, middle, and lower lung, respectively) is a 71-year-old woman with low fibrosis score of 4 and no emphysema. FVC was 81% of predicted, and DLCO was 61% of that predicted. Patient was alive after 3.4 years of follow-up. Estimated 1-year risk of death according to CT-GAP model was 7.3% (95% CI: 3.5%, 13.1%). Patient 2 (d–f, upper, middle, and lower lung, respectively) was a 75-year-old man with high fibrosis score of 42 and no emphysema. FVC was 46% of that predicted, and DLCO was 48% of that predicted. Patient died 163 days after evaluation. Estimated one-year risk of death according to CT-GAP model was 45.2% (95% CI: 32.8%, 56.6%).
Figure 4f:
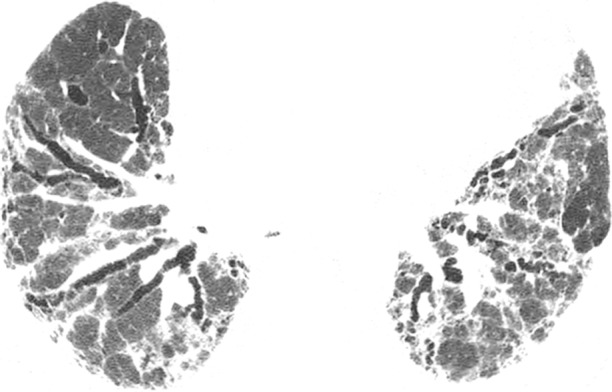
CT images show application of categorical CT-GAP model in two patient examples. Patient 1 (a–c, upper, middle, and lower lung, respectively) is a 71-year-old woman with low fibrosis score of 4 and no emphysema. FVC was 81% of predicted, and DLCO was 61% of that predicted. Patient was alive after 3.4 years of follow-up. Estimated 1-year risk of death according to CT-GAP model was 7.3% (95% CI: 3.5%, 13.1%). Patient 2 (d–f, upper, middle, and lower lung, respectively) was a 75-year-old man with high fibrosis score of 42 and no emphysema. FVC was 46% of that predicted, and DLCO was 48% of that predicted. Patient died 163 days after evaluation. Estimated one-year risk of death according to CT-GAP model was 45.2% (95% CI: 32.8%, 56.6%).
Model Performance with the Addition of CT Fibrosis and Emphysema Scores
Adding the CT fibrosis score or the CT emphysema score to the complete GAP model did not improve model performance (change in C index of 0.0 [95% CI: −1.8, 0.5] with fibrosis score and 0.0 [95% CI: −1.3, 0.4] for emphysema score; NRI and clinical NRI similarly were not significant for either addition (Table E4 [online]). Results were similar when analyses were restricted to quantitative CT scores from either individual radiologist (Tables E5, E6 [online]).
Discussion
Quantitative CT fibrosis score can replace DLCO in a modified GAP model (the CT-GAP model) with comparable performance, thus offering an important and, in some cases, simpler alternative to the GAP model for determining risk of death in patients with IPF. Quantitative CT scoring does not improve performance of the complete original GAP model, likely because of the significant correlation of CT scores with the clinical and physiologic variables in the GAP model.
CT of the chest has become the standard of care in the diagnostic evaluation of patients with IPF (1). Quantitative CT analysis has the potential to extend the value of CT beyond diagnosis, and among the community of practitioners who treat interstitial lung disease there has been increasing interest in standardization of quantitative methodology. The results of our study directly demonstrated how quantitative CT scoring of fibrosis can be combined with clinical data and lung function test results to determine risk of death in patients with IPF.
There are merits to a risk model that replaces DLCO with other variables available from the initial clinical evaluation such as quantitative CT fibrosis score. Although the DLCO test has a proven association with mortality in patients with IPF, it does require additional time and effort to obtain, has variable reproducibility (8) and cannot be performed adequately by some patients. Therefore, the CT-GAP model may provide a more efficient and, ultimately, more reliable method of prognostication for patients with IPF than the original GAP model can provide. Improved standardization and dissemination of quantitative CT scoring methodology and the development of automated, computerized CT scoring algorithms could make this model particularly useful and attractive.
Our findings are consistent with those of prior studies that showed that CT fibrosis score is statistically associated with survival in patients with IPF, and that it correlates with pulmonary function test results (11–13). However, in our study we found that CT fibrosis score does not add prognostic value to a prespecified base model consisting of clinical and physiologic variables, and that it may replace DLCO in that model, with preserved overall model performance. Our study also differed from previous studies in that we included more informative measures of model accuracy (ie, the C index, net reclassification improvement, and calibration) and included an external validation cohort.
Authors of previous studies have reported an inconsistent association of CT emphysema score with prognosis in patients with IPF (14–17). We did not find a significant association. Although the small number of patients with substantial emphysema in our cohort may have limited the statistical power to detect an association of emphysema with mortality, the proportion of subjects in our cohort with any detectable emphysema (103 of 348 [30%]) is consistent with that of other studies of patients with IPF (range, 28%–33% [10,14,15]). In addition, inspection of the 95% CIs for the change in C index (0.0 [95% CI: −1.8, 0.5]) and the NRI (1.3 [95% CI: −3.8, 6.4]) with the addition of CT emphysema score to the GAP model makes it unlikely that a substantial improvement in model performance was missed with the exclusion of CT emphysema score from a modified GAP model.
In our study, we included the largest cohort of well-characterized patients with IPF in whom the prognostic value of quantitative CT scoring has been evaluated to date. We included two geographically distinct cohorts of IPF patients, allowing for validation of all findings, and implemented rigorous model evaluation methods (ie, discrimination and calibration) that go beyond simple tests of statistical significance and are more prognostically informative (24,25,27–29). In evaluating the prognostic contribution of quantitative CT scoring, we compared CT-based approaches with a well-validated, simple, and accessible clinical model (the GAP model), considering the GAP model a base model reference standard. We believe that this base model approach is important for the future assessment of predictors, because it allows for the more accurate evaluation of the additional contribution of putative prognostic variables and a direct quantitative comparison of prognostic variables throughout studies. This is similar to the approach to identifying prognostic variables being used in cardiovascular disease risk prediction (30).
This study was retrospective, which may have limited data quality, and additional prospective assessment is needed to confirm these findings. Also, we only evaluated the association of CT fibrosis and emphysema scores with risk of death; it is unknown if they are associated with the risk of other clinically important outcomes such as disease progression or acute exacerbation. Specific CT features such as honeycombing, traction bronchiectasis, and ground-glass attenuation could have prognostic value and were not individually assessed in this study. Finally, CT scans were scored by experienced chest radiologists in this study, and results may not be generalizable to other centers with less experienced readers. Improved standardization of the CT fibrosis score, even at centers with less experienced radiologists, may be obtainable in the near future with the increased availability of computer-generated models that allow automation of these calculations. Also, in this study, we analyzed nonvolumetric CT examinations in which sampled images were acquired at 1-cm intervals. Volumetric CT is used increasingly at many centers, and would decrease the chance of sampling error, albeit at the expense of increased radiation dose.
Although we believe that the original GAP model remains the most practical and well-validated means of determining risk of death in patients with IPF today, the CT-GAP model, if validated, may become the preferred approach in patients with IPF for providers who have easy access to reliable quantitative CT scoring. In addition, the CT-GAP model provides an alternative for patients in whom DLCO is unmeasurable or difficult to obtain. The discriminative performance of both the CT-GAP and GAP models, although acceptable, remains suboptimal, and additional prognostic variables are needed to improve their performance in patients with IPF. Useful prognostic variables may include additional clinical variables like the six-minute walk test distance or desaturation, comorbidities, the change in variables such as FVC or DLCO with time, and blood or bronchoalveolar lavage−based biologic markers. These and other prognostic variables for IPF should be evaluated with rigorous multivariate model methodology by using the base model comparison approach to evaluate their clinical utility in comparison with an accepted reference standard.
Advance in Knowledge
■ Quantitative CT scoring for the extent of fibrosis (P ≤ .001), but not the extent of emphysema (P = .074), is associated with risk of death in patients with idiopathic pulmonary fibrosis and may be incorporated into a validated clinical model (the CT-gender, age, and physiology [GAP] model).
Implication for Patient Care
■ The CT-GAP model (C index, 70.3 [95% confidence interval: 66.4, 74.0]) may be a useful model for determining prognosis in patients with idiopathic pulmonary fibrosis in situations where CT scoring is more reliable and available than diffusion capacity of carbon monoxide.
APPENDIX
SUPPLEMENTAL TABLES
Acknowledgments
Acknowledgments
The authors would like to acknowledge the providers and staff of the University of California, San Francisco Interstitial Lung Disease Program and Consortium and the Mayo Clinic, Rochester for their assistance in recruiting patients for this study and the patients with IPF who, through their generosity and efforts, allow us to conduct clinical research studies such as this in an effort to improve the lives of patients with IPF.
Received February 19, 2013; revision requested April 1; revision received December 22; accepted February 17, 2014; final version accepted April 4.
Funding: This research was supported by the National Institutes of Health (grant HL086516).
Disclosures of Conflicts of Interest: B.L. disclosed no relevant relationships. B.M.E. disclosed no relevant relationships. T.E.H. disclosed no relevant relationships. C.J.R. disclosed no relevant relationships. E.V. Activities related to the present article: payment from Harold R. Collard, MD for salary support and statistical consulting. Activities not related to the present article: disclosed no relevant relationships. Other relationships: disclosed no relevant relationships. J.H.R. disclosed no relevant relationships. J.S.L. disclosed no relevant relationships. K.D.J. Activities related to the present article: disclosed no relevant relationships. Activities not related to the present article: consultancy for Actelion Pharmaceuticals and Pinpoint Genomics, employed by the University of Californa, San Francisco. Other relationships: disclosed no relevant relationships. L.R. disclosed no relevant relationships. T.E.K. Activities related to the present article: disclosed no relevant relationships. Activities not related to the present article: payment for consultancy from InterMune, Daiichi Sankyo, Pulmatrix, and Immune Works; travel expenses for lectures from Boehringer Ingelheim. Other relationships: disclosed no relevant relationships. H.R.C. Activities related to the present article: disclosed no relevant relationships. Activities not related to the present article: consultancy for biogen, Fibrogen, Gilead, InterMune, Promedior, Pfizer, Bayer, and Stromedix; grants/grants pending from Boehringer-Ingelheim and Genentec; royalties from UpToDate; and payment for development of educational presentations from MedScape. Other relationships: disclosed no relevant relationships.
Abbreviations:
- CI
- confidence interval
- DLCO
- diffusion capacity of carbon monoxide
- FVC
- forced vital capacity
- GAP
- gender, age, and physiology
- IPF
- idiopathic pulmonary fibrosis
- NRI
- net reclassification improvement
References
- 1.Raghu G, Collard HR, Egan JJ, et al. An official ATS/ERS/JRS/ALAT statement: idiopathic pulmonary fibrosis: evidence-based guidelines for diagnosis and management. Am J Respir Crit Care Med 2011;183(6):788–824. [DOI] [PMC free article] [PubMed] [Google Scholar]
- 2.Martinez FJ, Safrin S, Weycker D, et al. ; IPF Study Group . The clinical course of patients with idiopathic pulmonary fibrosis. Ann Intern Med 2005;142(12 Pt 1):963–967. [DOI] [PubMed] [Google Scholar]
- 3.Fernández Pérez ER, Daniels CE, Schroeder DR, et al. Incidence, prevalence, and clinical course of idiopathic pulmonary fibrosis: a population-based study. Chest 2010;137(1):129–137. [DOI] [PMC free article] [PubMed] [Google Scholar]
- 4.King TE, Jr, Tooze JA, Schwarz MI, Brown KR, Cherniack RM. Predicting survival in idiopathic pulmonary fibrosis: scoring system and survival model. Am J Respir Crit Care Med 2001;164(7):1171–1181. [DOI] [PubMed] [Google Scholar]
- 5.Wells AU, Desai SR, Rubens MB, et al. Idiopathic pulmonary fibrosis: a composite physiologic index derived from disease extent observed by computed tomography. Am J Respir Crit Care Med 2003;167(7):962–969. [DOI] [PubMed] [Google Scholar]
- 6.du Bois RM, Weycker D, Albera C, et al. Ascertainment of individual risk of mortality for patients with idiopathic pulmonary fibrosis. Am J Respir Crit Care Med 2011;184(4):459–466. [DOI] [PubMed] [Google Scholar]
- 7.Ley B, Ryerson CJ, Vittinghoff E, et al. A multidimensional index and staging system for idiopathic pulmonary fibrosis. Ann Intern Med 2012;156:684–691. [DOI] [PubMed] [Google Scholar]
- 8.Macintyre N, Crapo RO, Viegi G, et al. Standardisation of the single-breath determination of carbon monoxide uptake in the lung. Eur Respir J 2005;26(4):720–735. [DOI] [PubMed] [Google Scholar]
- 9.Gay SE, Kazerooni EA, Toews GB, et al. Idiopathic pulmonary fibrosis: predicting response to therapy and survival. Am J Respir Crit Care Med 1998;157(4 Pt 1):1063–1072. [DOI] [PubMed] [Google Scholar]
- 10.Mogulkoc N, Brutsche MH, Bishop PW, et al. Pulmonary function in idiopathic pulmonary fibrosis and referral for lung transplantation. Am J Respir Crit Care Med 2001;164(1):103–108. [DOI] [PubMed] [Google Scholar]
- 11.Lynch DA, Godwin JD, Safrin S, et al. High-resolution computed tomography in idiopathic pulmonary fibrosis: diagnosis and prognosis. Am J Respir Crit Care Med 2005;172(4):488–493. [DOI] [PubMed] [Google Scholar]
- 12.Best AC, Meng J, Lynch AM, et al. Idiopathic pulmonary fibrosis: physiologic tests, quantitative CT indexes, and CT visual scores as predictors of mortality. Radiology 2008;246(3):935–940. [DOI] [PubMed] [Google Scholar]
- 13.Sumikawa H, Johkoh T, Colby TV, et al. Computed tomography findings in pathological usual interstitial pneumonia: relationship to survival. Am J Respir Crit Care Med 2008;177(4):433–439. [DOI] [PubMed] [Google Scholar]
- 14.Cottin V, Nunes H, Brillet PY, et al. Combined pulmonary fibrosis and emphysema: a distinct underrecognised entity. Eur Respir J 2005;26(4):586–593. [DOI] [PubMed] [Google Scholar]
- 15.Mejía M, Carrillo G, Rojas-Serrano J, et al. Idiopathic pulmonary fibrosis and emphysema: decreased survival associated with severe pulmonary arterial hypertension. Chest 2009;136(1):10–15. [DOI] [PubMed] [Google Scholar]
- 16.Kurashima K, Takayanagi N, Tsuchiya N, et al. The effect of emphysema on lung function and survival in patients with idiopathic pulmonary fibrosis. Respirology 2010;15(5):843–848. [DOI] [PubMed] [Google Scholar]
- 17.Todd NW, Jeudy J, Lavania S, et al. Centrilobular emphysema combined with pulmonary fibrosis results in improved survival. Fibrogenesis Tissue Repair 2011;4(1):6. [DOI] [PMC free article] [PubMed] [Google Scholar]
- 18.American Thoracic Society . Idiopathic pulmonary fibrosis: diagnosis and treatment. International consensus statement. American Thoracic Society (ATS), and the European Respiratory Society (ERS). Am J Respir Crit Care Med 2000;161(2 Pt 1):646–664. [DOI] [PubMed] [Google Scholar]
- 19.Wanger J, Clausen JL, Coates A, et al. Standardisation of the measurement of lung volumes. Eur Respir J 2005;26(3):511–522. [DOI] [PubMed] [Google Scholar]
- 20.Miller MR, Hankinson J, Brusasco V, et al. Standardisation of spirometry. Eur Respir J 2005;26(2):319–338. [DOI] [PubMed] [Google Scholar]
- 21.Harrell FE, Jr, Lee KL, Mark DB. Multivariable prognostic models: issues in developing models, evaluating assumptions and adequacy, and measuring and reducing errors. Stat Med 1996;15(4):361–387. [DOI] [PubMed] [Google Scholar]
- 22.Fine JP, Gray RJ. A proportional hazards model for the subdistribution of a competing risk. J Am Stat Assoc 1999;94(446):496–509. [Google Scholar]
- 23.Wolbers M, Koller MT, Witteman JC, Steyerberg EW. Prognostic models with competing risks: methods and application to coronary risk prediction. Epidemiology 2009;20(4):555–561. [DOI] [PubMed] [Google Scholar]
- 24.Pencina MJ, D’Agostino RB, Sr, Steyerberg EW. Extensions of net reclassification improvement calculations to measure usefulness of new biomarkers. Stat Med 2011;30(1):11–21. [DOI] [PMC free article] [PubMed] [Google Scholar]
- 25.Cook NR, Paynter NP. Performance of reclassification statistics in comparing risk prediction models. Biom J 2011;53(2):237–258. [DOI] [PMC free article] [PubMed] [Google Scholar]
- 26.Thabut G, Christie JD, Ravaud P, et al. Survival after bilateral versus single-lung transplantation for idiopathic pulmonary fibrosis. Ann Intern Med 2009;151(11):767–774. [DOI] [PubMed] [Google Scholar]
- 27.Pencina MJ, D’Agostino RB, Sr, D’Agostino RB, Jr, Vasan RS. Evaluating the added predictive ability of a new marker: from area under the ROC curve to reclassification and beyond. Stat Med 2008;27(2):157–172; discussion 207–212. [DOI] [PubMed] [Google Scholar]
- 28.Tzoulaki I, Liberopoulos G, Ioannidis JP. Assessment of claims of improved prediction beyond the Framingham risk score. JAMA 2009;302(21):2345–2352. [DOI] [PubMed] [Google Scholar]
- 29.Steyerberg EW, Vickers AJ, Cook NR, et al. Assessing the performance of prediction models: a framework for traditional and novel measures. Epidemiology 2010;21(1):128–138. [DOI] [PMC free article] [PubMed] [Google Scholar]
- 30.Kavousi M, Elias-Smale S, Rutten JHW, et al. Evaluation of newer risk markers for coronary heart disease risk classification: a cohort study. Ann Intern Med 2012;156(6):438–444. [DOI] [PubMed] [Google Scholar]
Associated Data
This section collects any data citations, data availability statements, or supplementary materials included in this article.


