

Abstract
Adding small fractions of cholesterol decreases the interfacial viscosity of dipalmitoylphosphatidylcholine (DPPC) monolayers by an order of magnitude per wt %. Grazing incidence X-ray diffraction shows that cholesterol at these small fractions does not mix ideally with DPPC but rather induces nanophase separated structures of an ordered, primarily DPPC phase bordered by a line-active, disordered, mixed DPPC-cholesterol phase. We propose that the free area in the classic Cohen and Turnbull model of viscosity is inversely proportional to the number of molecules in the coherence area, or product of the two coherence lengths. Cholesterol significantly reduces the coherence area of the crystals as well as the interfacial viscosity. Using this free area collapses the surface viscosity data for all surface pressures and cholesterol fractions to a universal logarithmic relation. The extent of molecular coherence appears to be a fundamental factor in determining surface viscosity in ordered monolayers.
Introduction
Despite its ubiquity in cell membranes, there is little quantitative information on the effects of small mole fractions of cholesterol on the phase diagrams, molecular organization, and surface viscosity of mixtures of phospholipids and cholesterol.1,2 Understanding cholesterol’s effects in altering the local molecular organization and rheology of lipid monolayers may give clues to the mechanisms that stabilize nanometer-scale “rafts” in complex lipid-cholesterol mixtures; the raft hypothesis has emerged in recent years as a general organizing principle for the structure of eukaryotic cell membranes.3−6 Rafts are hypothesized to result from nanometer-scale phase separation of ordered and viscous domains in which cholesterol, saturated lipids, and membrane proteins preferentially accumulate, surrounded by a sea of less viscous, unsaturated lipids with greater protein diffusivity.3−6 However, the fundamental physics underlying raft formation is still being developed, especially how interactions between saturated phospholipids and cholesterol determine membrane phase behavior, viscosity and diffusivity.4
The interactions of cholesterol and saturated phospholipids also play an important, but poorly understood, role in the properties of human lung surfactant (LS), a lipid-protein monolayer necessary to reduce the surface tension in the lung alveoli.7 At present, even the existence of cholesterol in native LS is questioned, as the lung lavage required to harvest LS inevitably causes blood and cell debris to be coextracted, potentially contaminating LS with cholesterol. This lack of consensus is reflected in the composition of replacement lung surfactants, which are used to treat neonatal respiratory distress syndrome (NRDS), which occurs in 20 000–30 000 premature infants each year in the U.S.7,8 Survanta and Curosurf, two clinically approved animal extract replacement surfactants for treatment of NRDS, have all cholesterol removed after harvesting. Infasurf, the third clinically approved surfactant, retains 4-5 wt % cholesterol.9 Resolving this controversy is difficult, as there is little information on the effects of small cholesterol fractions on the organization and dynamics of phospholipid monolayers. Our previous work has shown that the surface viscosity of dipalmitoylphosphatidylcholine (DPPC) monolayers decreases by an order of magnitude per wt % cholesterol,10 up to about 3 wt %, suggesting that the cholesterol-containing Infasurf would have significantly different monolayer dynamics than cholesterol-free Survanta and Curosurf. Interfacial viscosity is believed to have a significant effect on monolayer collapse,11 surfactant spreading during breathing, and transport from the type II epithelial cells, where surfactant is produced, to the alveolar air–water interface.8 Interfacial viscosity may also be important during the instillation of replacement surfactant and the reopening of bronchial airways.12 However, the origin of this dramatic effect of cholesterol on DPPC viscosity is not yet known.
Cholesterol may also play a role in lung surfactant inactivation in acute lung injury (ALI) and acute respiratory distress syndrome (ARDS). ARDS occurs as a rapid onset of respiratory failure13−15 and affects about 150 000 people per year in the U.S. with a mortality rate of 30–40%.16 The pathogenesis of ARDS is not fully understood, but in both ALI and ARDS, surfactant is “inactivated” by some primary pathogenesis such as lung inflammation, trauma, pulmonary infection, near-drowning, etc.15 The cholesterol content of ARDS patients shows an increase in cholesterol content17,18 and in vitro, cholesterol levels greater than 10 mol % increase the minimum surface tension at monolayer collapse, which may exacerbate lung damage.
Grazing incidence X-ray diffraction (GIXD) shows that up to 7 mol % added cholesterol does not change the basic alkane packing of DPPC, but does decrease the extent of ordering, or coherence area, suggesting an increased number of lattice defects. We postulate that the free area available for diffusive transport in a two-dimensional analog of the classic Cohen and Turnbull free volume model of viscosity19 is inversely proportional to the number of molecules in a coherence area.20 Using this relationship,10,21,22 the surface viscosity data for all surface pressures and cholesterol fractions collapses to a simple logarithmic relation with no adjustable parameters. This suggests that the decreased molecular ordering caused by the incompatibility of cholesterol with the alkane chain lattice is the origin of the orders of magnitude decrease in surface viscosity.
Materials and Methods
Isotherms and Fluorescence Imaging
1,2-Dipalmitoyl-sn-glycero-3-phosphocholine (DPPC, R-enantiomer) and dihydrocholesterol (Avanti, Alabaster, AL) with 0.1 wt % Texas-Red DHPE (N-(Texas Red sulfonyl)-1,2-dihexadecanoyl-sn-glycero-3-phosphoethanolamine, Invitrogen, Grand Island, NY) were mixed in the appropriate ratios and diluted to ∼0.2 mg/mL in HPLC-grade chloroform (Fisher Scientific, St. Louis, MO) to form a spreading solution. Dihydrocholesterol (Chol) was used instead of cholesterol to minimize oxidation but has little impact on phase behavior.23 Surface pressure–area isotherms were recorded at 25 °C using a Teflon trough (NIMA, Coventry, England) with custom designed stainless steel ribbons which reduce film leakage at high surface pressures. A filter paper Wilhelmy plate (Riegler and Kirstein, GmbH; Potsdam, Germany) was used to measure surface pressure. The open area of the trough used was 125 cm2 and each complete compression/expansion cycle took about 8 min (0.42 cm2/s). For fluorescence imaging, the Langmuir trough was mounted on a Nikon Optiphot optical microscope with a custom designed stage equipped with long working distance objectives designed for fluorescent light. A dichroic mirror/barrier filter assembly directed the excitation light onto the monolayer films at a normal angle of incidence and filtered the emitted light and the images were detected by a silicon intensified CCD camera. Videos of the monolayer film were recorded during the compression-expansion cycle directly onto the computer using the Pinnacle studio capture software. The continuous, fluid lipid phase appears bright due to the preferential segregation of the Texas Red dye, while the better ordered domains exclude the dye molecules and appear dark.23
Grazing Incidence X-ray Diffraction (GIXD)
Two-dimensional GIXD experiments were carried out at the ChemMatCARS station at beamline 15-ID at the Advanced Photon Source, Argonne National Laboratory.24 DPPC/Chol at the appropriate ratios were dissolved in chloroform solution at ∼1 mg/mL and spread dropwise onto the air/deionized water interface in a custom Langmuir trough,24 which was temperature-controlled at 22° C. After waiting ∼30 min for solvent evaporation, the monolayers were compressed to the desired surface pressure (20, 30, or 40 mN/m) and annealed for an additional 30 min. The trough was enclosed in a helium-filled chamber and the oxygen level was constantly monitored during exposure to the X-ray beam. The analysis of GIXD data for two-dimensional films at the air-water interface follows that of Kaganer et al.25 It is well established that the Bragg peaks correspond to ordering within the alkane chains of the lipid tailgroups;26 the organization of the headgroups is inferred from changes in the tailgroup lattice in response to changes in surface pressure and cholesterol fraction.
Interfacial Microrheology
Circular ferromagnetic probes (microbuttons) of diameter 20 μm, thickness 1 μm, with “button holes” of diameter 3.5 μm were fabricated by photolithography. The probes were deposited at the air–water interface in a custom-built trough with an attached fluorescence microscope.27 A uniform magnetic field of magnitude, B, and orientation, θ, was generated by the output of two independent pairs of electromagnets controlled by a custom LabVIEW code10,27,28 to exert a controlled torque, L, on a microbutton of moment m and orientation ϕ. To measure the frequency-dependent linear viscoelastic response, a sinusoidal magnetic field was applied to generate a time varying applied torque. The driving torque was kept small enough that the response was linear. The microbutton orientation was determined from bright field images of the holes in the microbuttons as a function of applied torque, to determine the rotational resistance. From the rotational resistance, the linear viscoelastic surface moduli were obtained from the solution of the hydrodynamic problem of a rotating cylinder within a viscoelastic monolayer atop a viscous subphase.27,29−31 In terms of measured experimental properties, the surface loss modulus, G″ is the out of phase component of the rotational resistance, the surface storage modulus, G′, is in the in-phase component as in conventional 3-D rheology (Figure 6B). The surface viscosity for the Newtonian response we observed over the frequency range of 0.1–10 Hz is ηs = G″/ω, or for the 1 Hz frequency used in Figure 6, ηs = G″/2π. The same exponential dependence of surface viscosity on surface pressure was obtained using a 100 μm probe showing that continuum values of elasticity and viscosity were being measured. The 100 μm probe is more than an order of magnitude larger than the domain sizes we have seen (Figures 5 and 6). Recent results using macroscopic wire rings (10 cm diameter ring, 0.7 mm diameter wires) showed identical trends with surface pressure and good agreement for similar monolayers.32 The maximum surface viscosity that we could measure with our rheometer was ∼100 μPa·m·s; the surface viscosity of pure DPPC at 40 mN/m was greater than this and was not measured.
Figure 6.

Fluorescence images of DPPC monolayers with 0.0, 0.2, and 0.4 mol % cholesterol at coexistence between the disordered LE (light) and ordered LC (dark) phases at 10 mN/m. Contrast is due to doping the monolayer with 0.1 wt % of the fluorescent (N-(Texas Red sulfonyl)-1,2-dihexadecanoyl-sn-glycero-3-phosphoethanolamine, (Invitrogen) which segregates to the more fluid LE phase. The domain width decreases with increasing cholesterol, indicative of a decrease in line tension. The contrast disappears at higher surface pressures.
Figure 5.

Tapping-mode AFM images of DPPC/cholesterol monolayers transferred by Langmuir-Blodgett deposition to mica substrates at 20 mN/m. For 0.8 mol % cholesterol, dispersed, circular 10–100 nanodomains appear (darker gray indicates more compliant relative to the lighter gray background phase10), which preferentially locate at the boundaries of the light gray domains (arrows). For 3.7 mol % Chol, the circular nanodomains have condensed into linear features begin to break up the light gray domains, but the light gray domains remain continuous. For 5.0 mol % Chol the nanodomains make up a cocontinuous network separating the light gray domains, while decreasing the size of the light gray domains to 100–200 nm. Figure adapted from ref (10).
AFM and Langmuir-Blodgett Deposition
Freshly-cleaved mica substrates (S&J Trading Inc.; Glen Oaks, NY) connected to a computer-controlled dipping mechanism in a commercial circular NIMA L-B trough (Biolin Scientific, Inc., Linthicum Heights, MD) were pulled through the monolayer at 5 mm/min at a constant surface pressure of 20 mN/m. Transfer ratios were determined by recording the interfacial area change of the trough during transfer and comparing this to the surface area of the mica substrate. A transfer ratio of 1 means that these areas are equal; only films with transfer ratios of ∼1 were examined. The mica substrates were glued to stainless steel discs and affixed to the magnetic holder of an MMAFM-2 AFM (Digital Instruments; Santa Barbara, CA) with a cantilever tip (Asylum Research, AC160TS; Santa Barbara, CA) designed for tapping mode operation.
Results and Discussion
Two-dimensional GIXD was carried out at ChemMatCARS, Sector 15-ID at the Advanced Photon Source, Argonne National Laboratory on DPPC monolayers with various mole fractions of dihydrocholesterol (Chol). Figure 1 shows the GIXD intensity maps for (A) pure DPPC at 20 mN/m and (B) 6.4 mol % Chol/DPPC monolayers at 40 mN/m. Figure 2 shows the qz-integrated intensity profiles (arbitrary units) for DPPC/Chol monolayers at 20, 30, and 40 mN/m for 0 to 7 mol % Chol (each spectra offset by 1000).
Figure 1.
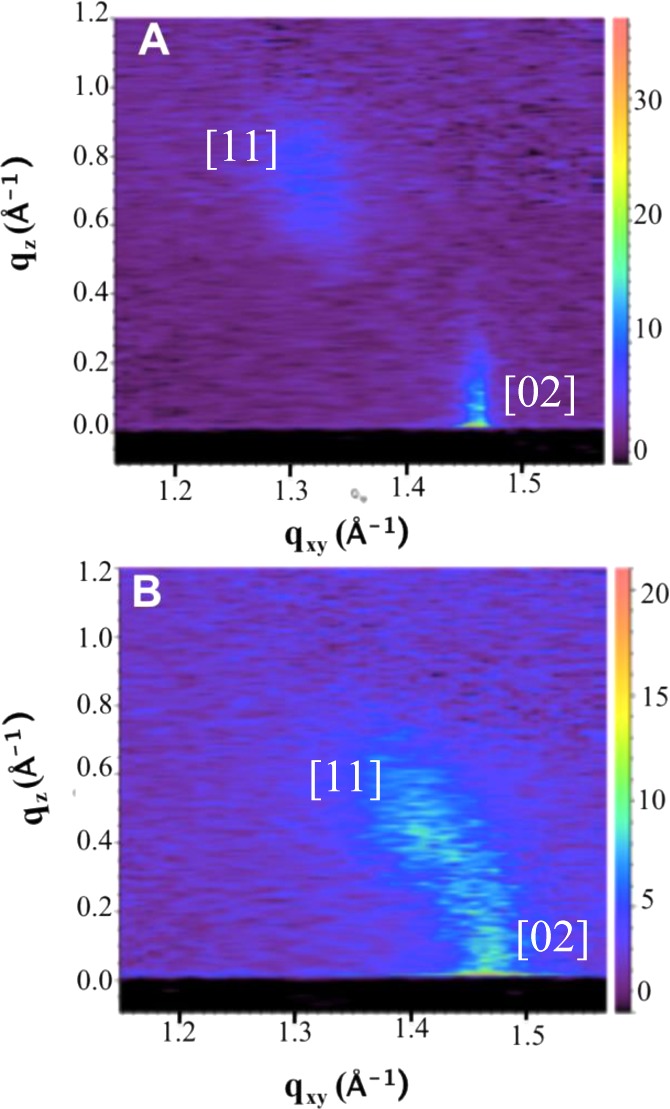
Two-dimensional X-ray maps of (A) pure DPPC at Π = 20 mN/m and (B) 6.4 mol % Chol in DPPC at Π = 40 mN/m. Two Bragg reflections are visible, the degenerate [11] reflection at positive qz and lower qxy and the [02] at higher qxy and qz =0, indicating nearest neighbor tilt.
Figure 2.

GIXD intensity integrated over the z-direction. For all surface pressures, the [11] peak migrates to higher qxy with increasing cholesterol. The [02] peak remains at the same location for all cholesterol or surface pressures (dotted lines). The basic motif of the DPPC lattice is unchanged by cholesterol, although the tilt is reduced with increasing cholesterol. Cholesterol broadens both peaks consistent with a decrease in the size of the correlated areas in the monolayer.
We assign the Bragg peak in Figure 1 at lower qxy and positive qz as due to the degenerate (11) and (11̅) reflections of distorted hexagonal packing;25,33 the second peak at higher qxy and qz = 0 is due to the nondegenerate (02) reflection. As the (11) reflection is located at qz > 0, and the (02) reflection is centered at qz = 0, the alkane chains are tilted in the nearest neighbor (NN) direction.25 Regardless of composition or surface pressure, all ordered areas in the monolayers had the same distorted hexagonal packing with NN tilt (Figure 3B, inset).
Figure 3.

(A) d11 and (B) d02 as a function of cholesterol and surface pressure. d11 decreases with increasing surface pressure and cholesterol fraction. d02 is invariant with both cholesterol and surface pressure. This is consistent with a decrease in tilt, which decreases d11, while the alkane chain packing normal to the chain axis, hence d02 remains the same. Inset: Real space lattice corresponding to the distorted hexagonal lattice parameters. One gray and one white circle are the two alkane chains in a rectangular unit cell of dimensions a and b. Translation of the pair of gray and white circles by a and/or b generates the lattice. The spacing between the dotted lines corresponds to the d-spacings in Table 2 and A, B.
The qz-integrated intensity profiles (Figure 2) show that the (11) Bragg peak broadens and moves to higher qxy with increasing cholesterol content (dotted lines) for all surface pressures, while the (02) peak also broadens with increasing cholesterol content but remains at constant qxy. From the qij values in Table 1, the real space lattice dimensions are dij = 2π/qij (Table 2 and Figure 3). The tilt angle, θ, for nearest neighbor tilt is given by tan θ = qz[q112 – (q02/2)2]−1/2.25 The coherence length is determined from the full width at half-maximum (fwhmij) of each peak after correction for the instrumental resolution, Lij = (0.9·2π)/(fwhmij)25 (Table 2).
Table 1. Reciprocal Space Lattice Parameters from GIXD for All Samples at 20, 30, and 40 mN/m Surface Pressure As a Function of Cholesterol Mole Fraction (Chol %)a.
| 20 mN/m surface pressure | |||
|---|---|---|---|
| Chol % | q02 (Å-1) | q11 (Å–1) | qz (Å-1) |
| 0 | 1.46 | 1.31 | 0.773 |
| 0.4 | 1.45 | 1.32 | 0.771 |
| 0.8 | 1.46 | 1.32 | 0.776 |
| 1.6 | 1.46 | 1.32 | 0.741 |
| 3.7 | 1.46 | 1.34 | 0.709 |
| 4.5 | 1.46 | 1.34 | 0.702 |
| 5.0 | 1.46 | 1.35 | 0.691 |
| 6.4 | 1.46 | 1.34 | 0.699 |
| 7.0 | 1.46 | 1.35 | 0.665 |
| 30 mN/m surface pressure | |||
|---|---|---|---|
| Chol % | q02 (Å-1) | q11 (Å–1) | qz (Å-1) |
| 0.0 | 1.46 | 1.34 | 0.710 |
| 0.4 | 1.46 | 1.35 | 0.700 |
| 0.8 | 1.46 | 1.35 | 0.700 |
| 1.6 | 1.46 | 1.35 | 0.685 |
| 3.7 | 1.47 | 1.37 | 0.609 |
| 4.5 | 1.47 | 1.39 | 0.601 |
| 5.0 | 1.46 | 1.36 | 0.599 |
| 6.4 | 1.46 | 1.36 | 0.569 |
| 7 | 1.46 | 1.37 | 0.573 |
| 40 mN/m surface
pressure | |||
|---|---|---|---|
| Chol % | q02 (Å-1) | q11 (Å–1) | qz (Å-1) |
| 0 | 1.47 | 1.37 | 0.622 |
| 0.4 | 1.47 | 1.38 | 0.611 |
| 0.8 | 1.46 | 1.37 | 0.614 |
| 1.6 | 1.46 | 1.39 | 0.510 |
| 3.7 | 1.47 | 1.41 | 0.498 |
| 4.5 | 1.46 | 1.40 | 0.501 |
| 5.0 | 1.47 | 1.40 | 0.510 |
| 6.4 | 1.47 | 1.42 | 0.438 |
| 7 | 1.47 | 1.43 | 0.407 |
q02 and q11 are the lattice parameters in Fourier space for the two strong reflections from the qz averaged data. qz is the z coordinate of the (11) reflection. All (02) reflections are centered at qz = 0. (See Figure 1).
Table 2. Real-Space Lattice Parameters, dij = 2π/qij, As a Function of Cholesterol Mole Fraction (Chol %)a.
| 20 mN/m surface pressure | |||||||||
|---|---|---|---|---|---|---|---|---|---|
| Chol % | d02 (Å) | d11 (Å) | a (Å) | b (Å) | θ° | area (Å2) | chain area (Å2) | L02 (Å) | L11 (Å) |
| 0 | 4.30 | 4.79 | 5.77 | 8.61 | 35.4 | 49.7 | 20.3 | 318 | 68 |
| 0.4 | 4.33 | 4.75 | 5.68 | 8.65 | 34.9 | 49.2 | 20.2 | 271 | 64 |
| 0.8 | 4.30 | 4.76 | 5.71 | 8.60 | 35.2 | 49.2 | 20.1 | 250 | 62 |
| 1.6 | 4.31 | 4.75 | 5.69 | 8.61 | 33.9 | 49.0 | 20.3 | 199 | 55 |
| 3.7 | 4.31 | 4.69 | 5.58 | 8.61 | 32.2 | 48.1 | 20.3 | 138 | 47 |
| 4.5 | 4.31 | 4.69 | 5.58 | 8.61 | 32.0 | 48.0 | 20.4 | 131 | 50 |
| 5.0 | 4.30 | 4.67 | 5.57 | 8.59 | 31.5 | 47.8 | 20.4 | 139 | 42 |
| 6.4 | 4.32 | 4.69 | 5.58 | 8.63 | 31.9 | 48.2 | 20.5 | 99 | 40 |
| 7 | 4.31 | 4.66 | 5.54 | 8.62 | 30.4 | 47.8 | 20.6 | 92 | 41 |
| 30 mN/m | |||||||||
|---|---|---|---|---|---|---|---|---|---|
| Chol % | d02 (Å) | d11 (Å) | a (Å) | b (Å) | θ° | area (Å2) | chain area (Å2) | L02 (Å) | L11 (Å) |
| 0 | 4.29 | 4.68 | 5.59 | 8.59 | 32.3 | 48.0 | 20.3 | 325 | 65 |
| 0.4 | 4.29 | 4.66 | 5.55 | 8.58 | 31.7 | 47.6 | 20.3 | 283 | 64 |
| 0.8 | 4.29 | 4.66 | 5.55 | 8.59 | 31.7 | 47.7 | 20.3 | 226 | 56 |
| 1.6 | 4.29 | 4.66 | 5.54 | 8.59 | 31.2 | 47.6 | 20.4 | 188 | 52 |
| 3.7 | 4.29 | 4.60 | 5.45 | 8.57 | 27.9 | 46.7 | 20.7 | 138 | 51 |
| 4.5 | 4.29 | 4.52 | 5.32 | 8.59 | 26.9 | 45.7 | 20.4 | 136 | 51 |
| 5.0 | 4.31 | 4.61 | 5.45 | 8.62 | 27.5 | 47.0 | 20.8 | 104 | 43 |
| 6.4 | 4.30 | 4.61 | 5.46 | 8.60 | 26.3 | 47.0 | 21.0 | 108 | 41 |
| 7 | 4.29 | 4.58 | 5.42 | 8.58 | 26.3 | 46.5 | 20.9 | 125 | 43 |
| 40
mN/m | |||||||||
|---|---|---|---|---|---|---|---|---|---|
| Chol % | d02 (Å) | d11 (Å) | a (Å) | b (Å) | θ° | area (Å2) | chain area (Å2) | L02 (Å) | L11 (Å) |
| 0 | 4.29 | 4.58 | 5.41 | 8.58 | 28.2 | 46.5 | 20.5 | 217 | 49 |
| 0.4 | 4.28 | 4.57 | 5.40 | 8.56 | 27.7 | 46.2 | 20.5 | 257 | 44 |
| 0.8 | 4.29 | 4.58 | 5.41 | 8.58 | 27.9 | 46.4 | 20.5 | 168 | 55 |
| 1.6 | 4.31 | 4.53 | 5.33 | 8.61 | 23.4 | 45.9 | 21.1 | 117 | 44 |
| 3.7 | 4.28 | 4.47 | 5.24 | 8.56 | 22.5 | 44.8 | 20.7 | 101 | 45 |
| 4.5 | 4.29 | 4.49 | 5.27 | 8.58 | 22.8 | 45.2 | 20.8 | 135 | 48 |
| 5.0 | 4.28 | 4.48 | 5.25 | 8.57 | 23.1 | 45.0 | 20.7 | 116 | 44 |
| 6.4 | 4.28 | 4.42 | 5.16 | 8.56 | 19.8 | 44.2 | 20.8 | 107 | 48 |
| 7 | 4.27 | 4.40 | 5.13 | 8.55 | 18.4 | 43.9 | 20.8 | 96 | 50 |
All d-spacings are referenced to a two molecule rectangular unit cell with a = d10 = [d11–2 – (2d02)−2]−1/2 and b = 2d02= d01 (see inset to Figure 3B). The error in a is larger than b as the (11) reflection is much broader than the (02) reflection (see Figure 2). θ is the tilt angle of the alkane chains in degrees with respect to the water surface, tan θ = qz[q112 −(q02/2)2]−1/225 from Table 1 (see inset to Figure 3B). The chain area is the cross sectional area of the chains in the direction perpendicular to the chains, or (ab cos θ)/2. L02 and L11 are the coherence lengths in the (02) and (11) directions, Lij ≅ (0.9·2π)/(fwhmij).
Figure 3A shows that, at a fixed surface pressure, adding Chol decreases d11 while Figure 3B shows that d02 remains constant. For pure DPPC, d11 decreases from 4.79 to 4.58 Å as the surface pressure increases from 20 to 40 mN/m; d02 is constant at 4.30 Å (Table 1). Cholesterol and surface pressure influence the lattice in a similar way; the same linear relationship between d11 and the tilt angle θ holds over the range of surface pressures and cholesterol fractions examined (Figure 4). θ decreases with increasing surface pressure, and with some scatter, increasing cholesterol fraction from 35° for pure DPPC at 20 mN/m to 18° for 7 mol % Chol at 40 mN/m. This change in tilt causes a decrease in the area per DPPC molecule at the air–water interface from 49.9 ± 1 to 43.9 ± 1 Å2.
Figure 4.

Molecular tilt angle measured from the monolayer normal, θ, decreases in the same manner with increasing cholesterol fraction as with increasing surface pressure (over this range of θ, sin θtilt ∼ θtilt; to convert to degrees of tilt, θ° = 180(θtilt/π)). Black symbols −20 mN/m surface pressure, Open symbols −30 mN/m and Gray symbols −40 mN/m. With some scatter, the tilt decreases with increasing cholesterol fraction. This linear relationship between d11 and θ is the same for changes in cholesterol fraction and surface pressure, which suggests that the local alkane packing of DPPC does not change with added cholesterol, but that both surface pressure and cholesterol act to decrease the mismatch between the lipid headgroup and tailgroup area in the same way.
From the values in Table 2, we determine a rectangular two-molecule unit cell of dimensions, a = d10 = [d11–2 – (2d02)−2]−1/2 and b = 2d02 = d01 (Figure 3B Inset), with a decreasing from 5.8 ± 0.1 at 20 mN/m, to 5.4 ± 0.1 Å at 40 mN/m; b remains constant at 8.6 ± 0.05 Å. These unit cell dimensions are consistent with a hexagonal packing of the alkane chains,34 which are tilted to accommodate the mismatch in projected area between the DPPC headgroup and the close-packed chains.25,33 As is the case for other lipids, accommodation of the larger DPPC headgroup area occurs by dilation of the alkane chain area via an increase in the tilt angle. Tilt costs little favorable alkane chain contact energy, as tilt occurs without changing the distances between the alkane chains.25 Tilt in the NN direction causes a, which is measured in the plane of the monolayer, to increase. However, b remains constant as this spacing does not change with tilt if the alkane chains retain their close-packed configuration. Increasing the surface pressure provides a uniform compression of the DPPC headgroup, which results in a decrease in the headgroup-chain incompatibility, and hence the tilt, without altering the alkane chain packing.25
The area per alkane chain perpendicular to the alkane chains, 20.5 ± 0.3 Å2 = (ab cos θ)/2, is constant within the experimental error for all surface pressures and also for all cholesterol fractions. Pure Chol has an untilted hexagonal lattice with a d spacing of 5.7 Å, and an area per molecule of ∼35 Å2,35 much larger than the 20.5 Å2 area per alkane chain we measure. The invariance of d02 (or b), and the linear relationship between d11 and θ is consistent with the bulk of the Chol not intercalating uniformly into the DPPC lattice as it does at higher mole fractions,35,36 but separating primarily into a second phase. Figure 5 shows AFM images of DPPC/Chol monolayers transferred to mica substrates at 20 mN/m showing two distinct morphologies. At 0.8 mol % Chol, dark gray, 10–100 nm circular areas are dispersed in extended light gray domains. The dark gray nanodomains localize preferentially at the boundaries of the light gray domains (arrows).10 Increasing the Chol fraction causes the circular nanodomains to percolate into linear structures (3.7 mol %), although the width of the linear structures remains ∼10–100 nm. The linear structures eventually break up the light gray domains (5 mol %). AFM force spectroscopy showed that the nanodomains were more compliant and easier to deform than the DPPC domains,10 suggesting that the nanodomains are disordered and do not contribute to the GIXD signature of the monolayer.
The alkane chains of DPPC prefer to be untilted to maximize the van der Waals contact between the chains,25,34 but are frustrated by the conflicting cross-sectional area requirements of the phosphocholine headgroup. This mismatch requires the tailgroup lattice to dilate, which responds by the lower energy tilt deformation in order to fill space efficiently. However, Chol has a complementary shape to DPPC, with a relatively small alcohol headgroup and a relatively large sterol ring tailgroup. Hence, this shape complementarity suggests that Chol can relieve the packing frustration of DPPC by making up some of the mismatch between the headgroups and alkane chains. Palmitic acid (PA) and hexadecanol (HD), which also have complementary shapes with DPPC, also lead to a decreased tilt at a given surface pressure,33 but do not show nanodomains in AFM images. The saturated C16 alkane chain of PA and HD is the same as the C16 alkane chain of DPPC, which allows PA and HD to be incorporated into the DPPC lattice. PA and HD increase the correlation length of the mixed crystal33 and the surface viscosity.37
Although the shape of cholesterol can relieve the frustration between the area of the headgroup and alkane chains of DPPC, the sterol rings cannot efficiently pack into the alkane chain lattice. This leads to a second type of frustration; the decrease in tilt due to the accommodation of the area mismatch results in disrupting the alkane chain lattice, which is likely higher in energy than decreasing the tilt.25 This second type of frustration may be accommodated by nanodomain phase separation. The combination of the sterol rings of Chol and more disordered DPPC chains gives the nanodomain phase excess tailgroup area, which may relieve part of the packing frustration of the headgroups in the adjacent ordered DPPC domains, albeit at longer range than if the cholesterol intercalated within the DPPC lattice.
The size of domains in typical phase-separated monolayers is governed by a competition between line tension, λ, which leads to larger domains, and entropy and electrostatic interactions, which favor smaller domains.23,38,39 Fluorescence images (Figure 6) at the coexistence surface pressure (9–10 mN/m) show that increasing Chol leads to a dramatic decrease in the width of the domains, which means a large decrease in λ.10,23,38 This decrease may be sufficient to stabilize the nanodomains against coalescence. An additional factor stabilizing the nanodomains may be the energy of reducing the tilt in the adjacent DPPC domains. The time for diffusive mixing of the nanodomains with the bulk is of order seconds over the ∼100 nm length scales of the nanodomains,40 so even with electrostatic interactions slowing bulk coalescence, molecular diffusion should eliminate the nanodomains in minutes if this structure were not stable. This stability may also be an indication that we are seeing an example of the recently proposed 2-D analogs of 3-D microemulsions, in which compositional variations within a single phase are due to coupling between monolayer curvature (i.e. incompatible area requirements of headgroups and tails) and composition.6,41 The evolution of the structure between discrete circular nanodomains (analogous to spherical micelles in 3-D) to extended linear structures (rod-like micelles) to an interconnected network (bicontinuous microemulsion) suggests this possibility.
Figure 7A shows that the coherence length, L02, in the untilted direction for pure DPPC is about 70 lattice repeats, or >300 Å, more than five times that in the tilted direction, L11 ∼ 60 Å or about 12 lattice repeats (Table 2). For both 20 and 30 mN/m, L02 decreases monotonically with increasing cholesterol fraction to ∼20 lattice repeats, but L11 only decreases to ∼10 lattice repeats. At 40 mN/m, L02 does not monotonically decrease with cholesterol fraction, the scatter in L02 is much greater than at lower surface pressures, and L02 is always less than expected from the results for the lower surface pressures. This is likely due to a decrease in film stability caused by a combination of leakage under the trough barriers and slow monolayer collapse during the 3-5 h required for GIXD. The AFM images in Figure 5 show that the average DPPC (light gray) domain size decreases from microns to 100–200 nm with cholesterol. Even with the decreasing domain size, the positional ordering given by the coherence lengths are orders of magnitude smaller than the domain size for a given cholesterol fraction. However, the orientational order extends for tens of microns as shown by the spiral domain textures in Figure 6.10 DPPC/Chol monolayers have nanometer-range positional order and micron-range orientational order,20,42 similar to tilted Smectic C liquid crystals43 and other Langmuir films that are classified as hexatics.44
Figure 7.

(A) Coherence lengths, L11, in the (11) or tilt direction, and L02, in the (02) or untilted direction, normalized by their respective lattice constants, d11 and d02. L02 decreases significantly with cholesterol fraction, but is less affected by surface pressure. L02 for 40 mN/m has more scatter and is nonmonotonic with cholesterol fraction, likely the result of film instabilities due to trough leakage and monolayer collapse at higher surface pressure. (B) The surface viscosity of DPPC/Chol monolayers measured with a microbutton magnetic rheometer decreases exponentially with cholesterol fraction for a given surface pressure for small mole fractions of cholesterol, then plateaus in the same fashion as L02. (Surface viscosity for pure DPPC at 40 mN/m was too high for the viscometer to measure.) (C) Free area model for DPPC/Chol monolayers (eqs 6-8) provides an excellent correlation between the surface viscosity and the number of correlated molecules, (L02·L11)/ab, over the entire range of cholesterol fraction. The lines are linear regression fits of eq 7 to the data (p < 0.01). (D) Normalizing to a reference state (taken to be that of pure DPPC for 20 and 30 mN/m and 0.4% Chol for 40 mN/m surface pressures), collapses the data onto a single universal curve relating surface viscosity to the molecular organization. The line is a linear regression fit of eq 8 to the data with p < .001 showing that the data is well described by the free area model.
Figure 7B shows that the surface viscosity, ηs, of DPPC/Chol monolayers10,27,28 decreases exponentially with increasing cholesterol fraction at a given surface pressure. In previous work,10 we found that the exponential dependence of surface viscosity on surface pressure was well-correlated by a “free area” model21,22,27,32,40,45 analogous to the classic free volume model of Cohen and Turnbull.19 The free-volume model19 was developed to explain the divergence in the viscosity of a liquid at the glass transition. The premise underlying the model is that in order to diffuse, a molecule in a liquid or other condensed phase has to have sufficient “free volume”, that is, volume not occupied by other molecules, in order to escape the cage formed by its neighboring molecules. Each molecule has a minimum van der Waals volume, V0, and moves randomly with thermal velocity u, within confining cages of diameter d0 defined by its nearest neighbors.19 Cohen and Turnbull calculated the probability for fluctuations in free volume relative to the average free volume, V̅. If the local fluctuation in free volume exceeds V0, a hole is created in the confining cage sufficiently large to allow a diffusional jump of the solute molecule into the hole. Diffusion occurs if another molecule fills the hole left by the solute molecule before the original molecule returns to its starting position.19 The probability P(V0) that the “free” volume, Vf, rearranges to give a void volume, V0, large enough for a molecule to diffuse (at constant energy) is given by19
| 1 |
thus giving a diffusivity
| 2 |
in which g is a geometric factor.19 The parameter B in eqs 1 and 2 is to take into account overlaps of free volume, and Cohen and Turnbull suggest a range from 1/2 ≤ B ≤ 1.19
In three dimensions, the diffusivity can be related to the bulk viscosity, η, via a generalized Stokes-Einstein relationship, D = kT/f. For spherical particles, the friction factor, f, is given by the Stokes drag on a sphere of diameter a: f = 3πηa. This leads to the free volume model for the viscosity:
| 3 |
In applications of the model, the free volume is the difference between the measured volume per molecule, V, and V0: Vf = V – V0. In applications of the model, V0 is a fitting parameter; theoretically, V0 is related to the volume per molecule at the glass transition where the viscosity diverges.
For a 2-dimensional film of constant thickness, L:
| 4 |
In analogy to the free volume, Af(Π) = A(Π) – A0, in which A(Π) is the area per molecule determined at a surface pressure, Π, from a surface pressure-area isotherm and A0 is taken to be a fitting parameter. In 2-dimensions, the diffusivity and free area can be related to the surface viscosity, ηs, via the Saffmann-Delbrück model29 for a cylinder diffusing within a viscous monolayer, surrounded by a viscous subphase, to give an equation analogous to eq 3 in terms of the free area:10,21,22,40,45
| 5 |
From fitting DPPC viscosity data, we found that A0 ∼ 40 Å2,10,21,22,45 which is roughly equal to ab cos θ, the molecular area of a DPPC molecule in a close-packed, untilted lattice (Table 2).
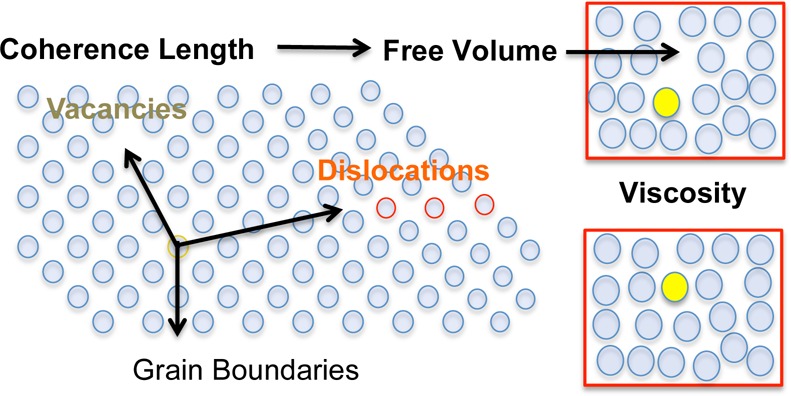
However, Cohen and Turnbull did not speculate on the molecular origins of Af(19) as they were modeling an unstructured liquid. However, for semicrystalline monolayers, we postulate that the free area is proportional to the number of defects in the lattice, which is inversely proportional to the number of correlated molecules at that composition and surface pressure:
| 6 |
Lattice defects, such as dislocations, vacancies, and grain boundaries decorrelate the lattice, which creates free area and pathways for diffusion. We define α as the free area (or number of defects times the area per defect20) per number of correlated molecules; we take α to be constant, independent of concentration. Combining eqs 5 and 6:
| 7 |
in which β = BA0/α. Linear regression to eq 7 (Figure 7C) shows that for 20, 30, and 40 mN/m, the slopes, β = 0.0134 ± 0.0007, 0.0131 ± 0.002 and 0.0196 ± 0.007 are the same within the experimental error. ηs0(Π = 20 mN/m) = 0.09 ± 0.02, ηs(Π = 30 mN/m) = 0.37 ± 0.2, and ηs0(Π = 40 mN/m) = 0.6 ± 0.5 μP·m·s, although the physical significance of the surface pressure variation of ηs is not given by our model. The Pearson correlation coefficient, r, for the three lines are 0.99, 0.95 and 0.81, respectively, giving a statistically significant fit of eq 7 to the data with p < 0.001, 0.001, and 0.05, respectively. To better compare the data at different surface pressures, the surface viscosity and correlated area are normalized relative to a reference composition, xref, at the same Π:
| 8 |
ηref(xref,Π) is the surface viscosity and ((L02L11)/ab)ref is the number of molecules in the coherence area at xref (taken to be pure DPPC for Π = 20 and 30 mN/m and 0.4% Chol for Π = 40 mN/m). Figure 7D shows that eq 8 eliminates the surface pressure dependence. Linear regression to eq 8 gives β = 0.0133 ± 0.007, which is the same as the fits to eq 7. The Pearson correlation coefficient is 0.91, giving p < 0.001, showing that eq 8 gives a statistically significant representation of the surface viscosity over the almost three orders of magnitude change in surface viscosity (Figure 7B). For A0 ∼ 40 Å2,10,25 α ∼ 1500 Å2 (for B = 1/2) – 3000 Å2 (for B = 1). For pure DPPC, (L02L11)/ab ∼ 450, giving Af ∼ 3–6 Å2 from eq 6, which is consistent with the variation in area per molecule, A(x,Π) = A0 + Af(x,Π), measured from DPPC isotherms.10,25 Adding cholesterol decreases (L02L11)/ab to ∼100, thereby increasing the free area per molecule to 15–30 Å2, resulting in the dramatic decrease in surface viscosity. These values of Af are in agreement with the assumptions behind the Cohen and Turnbull free volume theory, which postulates that Vf ≪ V0, hence Af ≪ A0.
Conclusions
In summary, GIXD shows that increasing the Chol fraction at constant surface pressure, or increasing the surface pressure at constant Chol fraction, decreases the tilt of the DPPC lattice, while leaving the alkane chains close-packed with an invariant area per molecule normal to the alkane chain direction. This confirms AFM images that show cholesterol does not intercalate homogeneously into the DPPC lattice but is expelled to disordered nanodomains that break up the DPPC domains. The nanodomains evolve from isolated, circular 10–100 nm diameter domains to ∼10–50 nm wide linear nanodomain aggregates to an interconnected network structure with increasing cholesterol. However, the monolayer is homogeneous at micron-scale optical images; macroscopic phase separation does not occur as at lower surface pressure (Figure 6). Hence, the DPPC/cholesterol monolayer is better described as a nanostructured, single-phase monolayer, rather than a mixture of two distinct phases, similar to recently proposed two-dimensional microemulsions.6,41 As such, this system is analogous to 3-D nanostructured surfactant-oil-water bicontinuous microemulsions, or copolymer systems that separate into nanometer-scale regions more enriched in one or the other monomer, which are considered single phase.
Adding cholesterol does not change the local hexagonal DPPC chain packing, but does reduce the molecular tilt, suggesting that cholesterol relieves some of the packing frustration between the DPPC headgroup and tailgroups. Most important to the monolayer dynamics, the extent of order, or the number of correlated molecules, decreases with increasing cholesterol fraction at all surface pressures, suggesting an increased number of lattice defects that create free area for visco-diffusive transport. At all cholesterol fractions, the positional order is much shorter ranged than the orientational order, consistent with an overall hexatic organization.20 We show that a simple model that proposes that the “free” area available for visco-diffusive transport19 is inversely proportional to the number of correlated molecules, which collapses the surface viscosity data for all surface pressures and cholesterol fractions onto a single universal curve. Molecular defects and the associated decrease in domain size caused by the incompatibility of cholesterol packing into the alkane chain lattice enhance visco-diffusive transport in monolayers. Our model and data show that the extent of molecular correlations is an excellent predictor of the effects of the cholesterol on the surface viscosity of model lung surfactant monolayers. Future work should show if this relationship is universal to other phospholipid monolayers.
Acknowledgments
We thank Dr. Mati Meron for GIXD data analysis help. S.Q.C., K.H.K., C.F., T.M.S., and J.A.Z. were supported by National Institutes of Health (HL-51177). Additional support for S.Q.C. was provided by the Basic Science Research Program through the National Research Foundation of Korea (NRF- 2012R1A6A3A04040395). K.D.C. and K.Y.C.L. were supported by the National Science Foundation (MCB-0920316). ChemMatCARS is supported by NSF/DOE (CHE-0822838) and the Advanced Photon Source is supported by Department of Energy, BES (W-31-109-Eng-38).
Author Present Address
⊥ Information Electrical Research Institute, KAIST, Daejeon, Korea.
The authors declare no competing financial interest.
Funding Statement
National Institutes of Health, United States
References
- Jamieson G. A.; Robinson D. M.. Mammalian Cell Membranes; Butterworth: London, 1977; Vol. 2. [Google Scholar]
- Veatch S. L. From small fluctuations to large-scale phase separation: lateral organization in model membranes containing cholesterol. Seminars Cell Dev. Biol. 2007, 18, 573–582. [DOI] [PubMed] [Google Scholar]
- Simons K.; Ikonen E. Functional rafts in cell membranes. Nature 1997, 387, 569–572. [DOI] [PubMed] [Google Scholar]
- Lingwood D.; Simons K. Lipid rafts as a membrane-organizing principle. Science 2010, 327, 46–50. [DOI] [PubMed] [Google Scholar]
- Machta B. B.; Veatch S. L.; Sethna J. P. Critical Casimir forces in cellular membranes. Phys. Rev. Lett. 2012, 109, 138101. [DOI] [PMC free article] [PubMed] [Google Scholar]
- Meinhardt S.; Vink R. L. C.; Schmid F. Monolayer curvature stabilizes nanoscale raft domains in mixed lipid bilayers. Proc. Natl. Acad. Sci. U.S.A. 2013, 110, 4476–4481. [DOI] [PMC free article] [PubMed] [Google Scholar]
- Clements J. A.; Avery M. E. Lung surfactant and neonatal respiratory distress syndrome. Am. J. Respir. Crit. Care Med. 1998, 157, S59–S66. [DOI] [PubMed] [Google Scholar]
- Zasadzinski J. A.; Stenger P.; Shieh I.; Dhar P. Overcoming rapid inactivation of lung surfactant: analogies between competitive adsorption and colloid stability. Biochem. Biophys. Acta 2010, 1798, 801–828. [DOI] [PMC free article] [PubMed] [Google Scholar]
- Bernhard W.; Mottaghian J.; Gebert A.; Rau G. A.; von der Hardt H.; Poets C. F. Commercial versus native surfactants - Surface activity, molecular components, and the effect of calcium. Am. J. Respir. Crit. Care Med. 2000, 162, 1524–1533. [DOI] [PubMed] [Google Scholar]
- Kim K.; Choi S. Q.; Squires T. M.; Zasadzinski J. A. Cholesterol nanodomains: their effect on monolayer morphology and dynamics. Proc. Natl. Acad. Sci. U.S.A. 2013, 101, E3054–E3061. [DOI] [PMC free article] [PubMed] [Google Scholar]
- Pocivavsek L.; Dellsy R.; Kern A.; Johnson S.; Lin B.; Lee K. Y. C.; Cerda E. Stress and fold localization in thin elastic membranes. Science 2008, 320, 912–916. [DOI] [PubMed] [Google Scholar]
- Halpern D.; Gaver D. P. The influence of surfactant on the propagation of a semi-infinite bubble through a liquid-filled compliant channel. J. Fluid Mech. 2012, 698, 125–159. [DOI] [PMC free article] [PubMed] [Google Scholar]
- Spragg R. G.; Lewis J. F.; Walmrath H.; Johannigman J.; Bellingan G.; Laterre P.; Witte M. C.; Richards G. A.; Rippin G.; Rathgeb F.; Hafner D.; Taut F. J. H.; Seeger W. Effect of recombinant surfactant protein C-based surfactant on the acute respiratory distress syndrome. New Engl. J. Med. 2004, 351, 884–892. [DOI] [PubMed] [Google Scholar]
- Taeusch H. W. Treatment of acute (adult) respiratory distress syndrome - The holy grail of surfactant therapy. Biol. Neonate 2000, 77, 2–8. [DOI] [PubMed] [Google Scholar]
- Zuo Y. Y.; Veldhuizen R. A.; Neumann A. W.; Peterson N. O.; Possmayer F. Current perspectives in pulmonary surfactant - inhibition, enhancement and evaluation. Biochim. Biophys. Acta 2008, 1778, 1947–1977. [DOI] [PubMed] [Google Scholar]
- McIntyre R. C.; Pulido E. J.; Bensard D. D.; Shames B. D.; Abraham E. Thirty years of clinical trials in acute respiratory distress syndrome. Crit. Care Med. 2000, 28, 3314–3331. [DOI] [PubMed] [Google Scholar]
- Gunasekara L.; Schoel W. M.; Schürch S.; Amrein M. W. A comparitive study of mechanisms of surfactant inhibition. Biochim. Biophys. Acta 2008, 1778, 433–444. [DOI] [PubMed] [Google Scholar]
- Gunasekara L.; Schurch S.; Schoel W. M.; Nag K.; Leonenko Z.; Haufs M.; Amrein M. W. Pulmonary surfactant function is abolished by an elevated level of cholesterol. Biochim. Biophys. Acta 2005, 1737, 27–35. [DOI] [PubMed] [Google Scholar]
- Cohen M. H.; Turnbull D. Molecular transport in liquids and glasses. J. Chem. Phys. 1959, 31, 1164–1169. [Google Scholar]
- Zippelius A.; Halperin B. I.; Nelson D. R. Dynamics of two-dimensional melting. Phys. Rev. B 1980, 22, 2514–2541. [Google Scholar]
- Galla H. J.; Hartmann W.; Theilen U.; Sackmann E. On two-dimensional possible random walk in lipid bilayers and fluid pathways in biomembranes. J. Membr. Biol. 1979, 48, 215–236. [DOI] [PubMed] [Google Scholar]
- Sacchetti M.; Yu H.; Zografi G. Inplane steady shear viscosity of monolayers at the air-water interface and its dependence on free area. Langmuir 1993, 9, 2168–2171. [Google Scholar]
- McConnell H. M. Structures and Transitions in Lipid Monolayers at the Air-Water-Interface. Annu. Rev. Phys. Chem. 1991, 42, 171–195. [Google Scholar]
- Lin B. H.; Mero M.; J G.; Graber T.; Schlossman M. L.; Viccaro P. J. The liquid surface/interface spectrometer at ChemMatCARS synchrotron facility at the Advanced Photon Source. Physica B 2003, 336, 75–80. [Google Scholar]
- Kaganer V. M.; Mohwald H.; Dutta P. Structure and phase transitions in Langmuir monolayers. Rev. Mod. Phys. 1999, 71, 779–819. [Google Scholar]
- Jensen T. R.; Balashev K.; Bjornholm T.; Kjaer K. Novel methods for studying lipids and lipases and their mutual interaction at interfaces. Part II. Surface sensitive synchrotron X-ray scattering. Biochimie 2001, 83, 399–408. [DOI] [PubMed] [Google Scholar]
- Choi S. Y.; Steltenkamp S.; Pascall A. J.; Zasadzinski J. A.; Squires T. M. Active microrheology of phospholipid monolayers: seeing stretching, flowing, yielding and healing. Nat. Commun. 2011, 2, 312. [DOI] [PMC free article] [PubMed] [Google Scholar]
- Kim K.; Choi S. Q.; Zasadzinski J. A.; Squires T. M. Interfacial microrheology of DPPC monolayers at the air-water interface. Soft Matter 2011, 7, 7782–7789. [Google Scholar]
- Saffman P. G.; Delbruck M. Brownian motion in biological membranes. Proc. Natl. Acad. Sci. U.S.A. 1975, 72, 3111–3113. [DOI] [PMC free article] [PubMed] [Google Scholar]
- Wurlitzer S.; Schmiedel H.; Fischer T. M. , Electrophoretic relaxation dynamics of domains in Langmuir monolayers. Langmuir 2002, 18, 4393–4400. [Google Scholar]
- Hughes B. D.; Pailthorpe B. A.; White L. R. The translational and rotational drag on a cylinder moving in a membrane. J. Fluid Mech. 1981, 110, 349–372. [Google Scholar]
- Hermans E.; Vermant J. Interfacial shear rheology of DPPC under physiologically relevant conditions. Soft Matter 2014, 10, 175–186. [DOI] [PubMed] [Google Scholar]
- Lee K. Y. C.; Gopal A.; von Nahmen A.; Zasadzinski J. A.; Majewski J.; Smith G. S.; Howes P. B.; Kjaer K. Influence of palmitic acid and hexadecanol on the phase transition temperature and molecular packing of dipalmitoylphosphatidyl-choline monolayers at the air-water interface. J. Chem. Phys. 2002, 116, 774–783. [Google Scholar]
- Kitaigorodskii A. L.Organic Chemical Crystallography; Consultant Bureau: New York, 1961. [Google Scholar]
- Ivankin A.; Kuzmenko I.; Gidalevitz D. Cholesterol-phospholipid interactions: new insights from surface x-ray scattering data. Phys. Rev. Lett. 2010, 104, 108101. [DOI] [PMC free article] [PubMed] [Google Scholar]
- Ratajczak M. K.; Chi E. Y.; Frey S. L.; Cao K. D.; Luther L. M.; Lee K. Y. C.; Majewski J.; Kjaer K. Ordered Nanoclusters in Lipid-Cholesterol Membranes. Phys. Rev. Lett. 2009, 103, 028103. [DOI] [PubMed] [Google Scholar]
- Alonso C.; Waring A.; Zasadzinski J. A. Keeping lung surfactant where it belongs: Protein regulation of two-dimensional viscosity. Biophys. J. 2005, 89, 266–273. [DOI] [PMC free article] [PubMed] [Google Scholar]
- Weis R. M.; McConnell H. M. Cholesterol stabilizes the crystal-liquid interface in phospholipid monolayers. J. Phys. Chem. 1985, 89, 4453–4459. [Google Scholar]
- Lee D. W.; Min Y.; Dhar P.; Ramachandaran A.; Israelachvili J. N.; Zasadzinski J. A. Relating Domain Size Distribution to Line Tension and Molecualr Dipole Density in Model Cytoplasmic Lipid Monolayers. Proc. Natl. Acad. Sci. U.S.A. 2011, 108, 9425–9430. [DOI] [PMC free article] [PubMed] [Google Scholar]
- Peters R.; Beck K. Translational diffusion in phospholipid monolayers measured by fluorescence microphotolysis. Proc. Natl. Acad. Sci. U.S.A. 1983, 80, 7183–7187. [DOI] [PMC free article] [PubMed] [Google Scholar]
- Schick M. Membrane heterogeneity: Manifestation of a curvature-induced microemulsion. Phys. Rev. E 2012, 85, 031902. [DOI] [PubMed] [Google Scholar]
- Halperin B. I.; Nelson D. R. Theory of two-dimensional melting. Phys. Rev. Lett. 1978, 41, 121–124. [Google Scholar]
- Dierker S. B.; Pindak R.; Meyer R. B. Consequences of bond-orientational order on the macroscopic orientation patterns of thin tiltled hexatic liquid-crystal films. Phys. Rev. Lett. 1986, 56, 1819–1822. [DOI] [PubMed] [Google Scholar]
- Dreier J.; Brewer J.; Simonsen A. C. Texture defects in lipid membrane domains. Soft Matter 2012, 8, 4894–4904. [Google Scholar]
- Alonso C.; Zasadzinski J. A. Linear dependence of surface drag on surface viscosity. Phys. Rev. E 2004, 69, 0216021–0216026. [DOI] [PubMed] [Google Scholar]