

Abstract
Chemoresistance is a primary cause of treatment failure in cancer and a common property of tumor-initiating cancer stem cells. Overcoming mechanisms of chemoresistance, particularly in cancer stem cells, can markedly enhance cancer therapy and prevent recurrence and metastasis. This study demonstrates that the delivery of Epirubicin by nanodiamonds is a highly effective nanomedicine-based approach to overcoming chemoresistance in hepatic cancer stem cells. The potent physical adsorption of Epirubicin to nanodiamonds creates a rapidly synthesized and stable nanodiamond–drug complex that promotes endocytic uptake and enhanced tumor cell retention. These attributes mediate the effective killing of both cancer stem cells and noncancer stem cells in vitro and in vivo. Enhanced treatment of both tumor cell populations results in an improved impairment of secondary tumor formation in vivo compared with treatment by unmodified chemotherapeutics. On the basis of these results, nanodiamond-mediated drug delivery may serve as a powerful method for overcoming chemoresistance in cancer stem cells and markedly improving overall treatment against hepatic cancers.
Keywords: cancer stem cell, drug delivery, nanomedicine, nanodiamond, biomaterials, chemoresistance
Chemoresistance is the main reason for treatment failure in metastatic cancers, including hepatocellular carcinoma.1,2 Hepatocellular carcinoma is the seventh most common cancer and the second leading cause of cancer death worldwide with limited clinical treatment options.3,4 Cancer stem cells, which are identified by enhanced tumor-initiation as well as the ability to self-renew and differentiate into noncancer stem cells, are often capable of escaping chemotherapy and cause recurrence.5−7 One common mechanism of chemoresistance in cancer stem cells is due to ATP binding cassette (ABC) transporter proteins that are able to recognize and efflux drug molecules.8 Hoechst dye 33342, a dye substrate for ABC transporters, exploits this chemoresistance mechanism to identify cancer stem cells as poorly stained side-population cells due to enhanced Hoechst 33342 dye efflux in multiple cancers, including hepatic cancers.9−12 Chromosomal amplification of the MYC locus has been frequently observed in hepatocellular carcinoma.13 We have previously demonstrated that chemoresistant hepatic tumor cancer stem cells driven by the oncogene MYC were enriched in the side population fraction and exhibited enhanced tumor initiation capacity.14 Hence, identifying better methods for overcoming this mechanism of chemoresistance may be useful in effectively treating MYC-driven tumors and other tumor types through enhanced killing of cancer stem cells.
ABC transporters are able to efflux multiple classes of cancer drugs, including anthracyclines.15 One such anthracycline, Epirubicin, impairs DNA and RNA synthesis as well as DNA replication and is currently in clinical trials for hepatic cancer treatment and favored over its epimer, Doxorubicin, for its lower cardiotoxicity.16,17 As an ABC transporter substrate, Epirubicin can be recognized and effluxed by multiple ABC transporters. Attempts in using broad ABC transporter inhibitors to overcome multidrug resistance have yielded disappointing results in clinical trials, due to unacceptable toxicity, unpredictable pharmacokinetic interactions among various transporter family proteins as well as the suppression of physiologic roles in normal cells.18−20 Specific inhibitors, however, may lead to ineffectiveness where multiple ABC transporters coexpress and confer chemoresistance in tumors.21 The difficulty of this approach lies in balancing between toxicity and ABC transporter inhibition efficacy; hence, a nontoxic method for overcoming chemoresistance that is nondistinctive among various ABC transporters would be more ideal, such as nanotechnology-mediated drug delivery systems. The use of nanotechnology to improve therapeutic outcomes has been investigated in a number of biomedical applications, including cancer treatment, with great success.22−29 Nanomedical approaches may overcome this mechanism of chemoresistance, regardless of ABC transporter involved, while not relying on the use of highly specific small molecule inhibitors.
Nanodiamonds are truncated semioctahedral carbon structures with a diameter of approximately 5 nm.30 Nanodiamonds can be processed and functionalized to express a wide variety of chemical groups.31 When combined with unique multipolar facet-dependent variations in surface electrostatic potential, these properties allow nanodiamonds to be loaded with a wide range of compounds including small molecules, therapeutic and targeting biologics, genetic material as well as imaging agents such as gadolinium.32−44 The unique facet-dependent variations in surface electrostatic potential observed in nanodiamonds also promotes water molecule interaction with nanodiamond surfaces, a property that results in nanodiamond–gadolinium contrast agents producing among the highest per-gadolinium relaxivity increases ever reported.38,45 Compared to other nanocarbon materials, nanodiamonds also appear to be more biocompatible and well tolerated in a number of biological systems.46−50 Because of these properties, nanodiamonds have great potential as an enhanced drug-delivery platform against tumor cells and chemoresistant tumor cells alike, as has been previously demonstrated with other anthracyclines like Doxorubicin in liver and breast cancer.50−53
In this study, we evaluated the use of a nanodiamond–drug delivery platform to deliver the chemotherapeutic, Epirubicin, and impair tumor growth that arises from chemoresistant cancer stem cells. Nanodiamonds were reversibly bound to Epirubicin by physical adsorption, and the resulting nanodiamond–Epirubicin drug complex (EPND) was characterized to confirm successful drug loading and that EPND fit the size and surface charge requirements needed for passively targeted enhanced permeation and retention mediated drug delivery. Additionally, mechanisms that mediate nanodiamond–drug complex uptake as well as influence nanodiamond drug release were further elucidated. Most importantly, EPND exhibited higher efficacy compared to unmodified standard chemotherapeutic in killing both normal cancer cells and cancer stem cells, which resulted in effective inhibition of secondary tumor formation. This work suggests that an nanodiamond–drug delivery platform may have clinical potential in treating cancers driven by chemoresistant cancer stem cells.
Results and Discussion
Nanodiamond–Drug Synthesis and Characterization
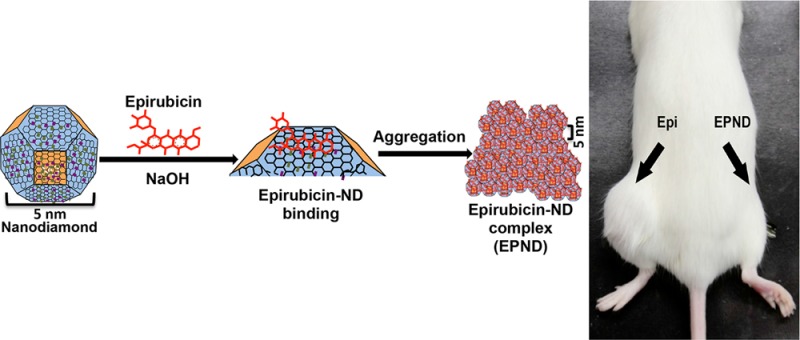
The passively targeted delivery of Doxorubicin by nanodiamonds can effectively enhance therapeutic efficacy and safety against multiple models of cancer.50 Compared to other nanoparticles, the simple preparation process is an advantage of nanodiamonds as a drug delivery platform. As shown in Figure 1a, EPND was prepared by mixing nanodiamonds and Epirubicin at a weight ratio of 5:1 (nanodiamond:Epirubicin) under base conditions and shaking. The nanodiamond surface could be deprotonated by NaOH and promoted the potent loading of Epirubicin onto nanodiamonds with an Epirubicin loading efficiency of 19.66 ± 0.2% (Epirubicin/nanodiamond wt %) (Supporting Information Figure S1b), which means that 1 mg of nanodiamond can adsorb 0.2 mg of Epirubicin. Further calculation showed that the number of Epirubicin per nanodiamond is approximately 15. The stable high loading efficiency of Epirubicin with minimal fabrication steps suggest that the optimized reaction conditions were appropriate for EPND synthesis and even scalable production.54
Figure 1.

Characterization of nanodiamond, Epirubicin, EPND complex and release profile of Epirubicin. (a) Schematic model showing surface and chemical structure of nanodiamond (ND) and Epirubicin (Epi), synthesis and aggregation of EPND. ND represented in truncated octahedron structure with different surface charge denoted with color. ND surface functional group indicated, including benzene ring, carboxyl group and hydrogen group. Molecular skeleton representing carbon, oxygen and nitrogen atoms in Epi molecule was shown in red. Synthesis of EPND was performed under basic condition of 2.5 mM NaOH through physical adsorption between Epi and ND. Aggregation around 90 nm was formed after EPND synthesis. (b) FTIR spectra of ND (black line), Epi (red line), and EPND (blue line) indicating surface functional groups. Black arrows indicating surface functional groups of O–H stretch signals between 3300 and 3500 cm–1 and C=C stretch signals between 1400 and 1600 cm–1 presenting aromatic rings of anthracyclines. (c) Size distribution of ND (10.9 ± 3.6 nm) and EPND (89.2 ± 3.3 nm) after Epirubicin loading analyzed via dynamic light scattering (DLS) analysis. Data are represented as mean ± SD. (d) Zeta-potential of ND (48.6 ± 3.3) and EPND (19.6 ± 1.1) indicating surface charge. Data are represented as mean ± SD; ***, p < 0.001; ****, p < 0.0001. (e) Release profile of Epi from EPND under various pH conditions. Epi elution was evaluated over a period of 7 d under pH 2, 4, 7, 10, and 12 conditions. Data are represented as mean ± SD. (f) Release profile of Epi from EPND under different FBS concentrations over a period of 7 d. Epi elution was the most in 10% FBS. Data are represented as mean ± SD; ***, p < 0.001. (g) Free Epi concentration in mice serum following Epi or EPND injection. Data are represented as mean ± SD; *, p < 0.05.
Prior to functional evaluation of EPND, successful drug loading onto nanodiamonds was assessed. Fourier transform infrared spectroscopy analysis was performed to determine the various surface functional groups on Epirubicin, nanodiamond and EPND (Figure 1b). The Epirubicin spectra showed C–H stretch signals around 2900 cm–1, C=O stretch signals around 1730 cm–1, as well as C=C stretch signals between 1400 and 1600 cm–1 that are characteristic of the aromatic rings of anthracyclines. The nanodiamond spectra showed O–H stretch vibrations around 3410 cm–1 and O–H bend vibrations around 1625 cm–1. Functional groups on EPND shared similar peak ranges of both benzene rings of Epi, as well as hydroxyl groups of nanodiamond. Thus, Fourier transform infrared spectroscopy analysis confirmed the successful loading of Epirubicin onto nanodiamonds, as the EPND complex gained the specific surface functional group of both Epirubicin and nanodiamonds. Nanodiamonds and EPND were also visualized using transmission electron microscopy.
The lattice structure, which was formed by regular alignment of carbon atom was clearly observed on nanodiamond surface but less visible on EPND after Epirubicin loading (Supporting Information Figure S2).
Nanoparticle–drug complex size and surface charge can greatly influence blood circulation, tissue distribution, clearance and passive targeting to tumor sites, all factors that will ultimately influence the success of a nanoparticle–drug delivery platform in the clinical setting.55−60 Dynamic light scattering analysis and zeta-potential analysis were applied to nanodiamond and EPND complexes to measure particle size and surface charge (Figure 1c and 1d). When distributed in water, nanodiamonds interact with water molecules and other nanodiamond particles through both negatively and positively charged surfaces and form aggregates.45,61 The average diameter of nanodiamond aggregates was 10.9 ± 3.6 nm, while the zeta potential analysis showed that the surface of nanodiamonds was positive charged with an average particle value of 48.6 ± 3.3 mV. After adsorbing Epirubicin on the nanodiamonds surface, the zeta potential of the particles decreased to 19.6 ± 1.1 mV, and the diameter increased to 89.2 ± 3.3 nm. The adsorption of Epirubicin leads to the decrease of zeta potential of nanopaticle, which further lead to an increase in complex diameter. A higher level of zeta potential results in greater electrostatic repulsion forces between the particles. This repulsion leads to greater separation distances between particles in the suspension, reducing aggregation/flocculation caused by van der Waals interactions. Inversely, the lower zeta potential of nanoparticles will lead to aggregation and further increase in the size of the complex.
Effect of pH and Protein on Nanodiamond–Drug Release
For the successful application of nanodiamonds as a drug delivery platform, it is important that specific and sustained drug release occur only upon reaching the target site. Premature release of Epirubicin will induce toxicity in the blood circulatory system, cause damage to normal cells and tissues or result in metabolic breakdown.62 The nanoparticles may interact with cells in the body, where the pH ranges from 7.4 to 4.5.63,64 Thus, understanding the effect of environmental pH stimuli on nanodiamond-mediated drug release is important when minimizing toxicity toward normal tissue and cells. Epirubicin release from EPND was analyzed in a series of pH conditions (Figure 1e). Epirubicin was released rapidly and abundantly (>80% within first 9 h) in extremely acidic conditions (pH = 2) while maintaining a sustained release in pH 4. In neutral pH conditions (pH = 7), release was significantly lower than that in pH 4 (p-value < 0.001) and pH 2 (p-value < 0.0001) and was strongly inhibited in pH 10 and 12 conditions. This data suggests that the release of Epirubicin is accelerated by acidic conditions and attenuated under neutral or basic conditions.
Besides pH, intracellular nanodiamond–protein interactions may also play an important role in the release of Epirubicin from nanodiamond surface as charged proteins have been demonstrated to competitively bind to nanodiamonds and affect surface charge as well as nanodiamond particle aggregation.65 In order to better understand the effect of proteins on drug release, Epirubicin release from EPND was measured following incubation in a series of fetal bovine serum (FBS) concentrations from 0.1 to 10%. Drug release was proportionally related to FBS concentration with higher concentration of FBS (10 and 5%) facilitating the release of Epirubicin compared to that of 0% FBS (Figure 1f, Supporting Information Figure S3) (p-value < 0.001). This data demonstrates that proteins can competitively bind to nanodiamonds and further enhance Epirubicin release.
While proteins may influence nanodiamond drug release, we investigated if this could affect premature nanodiamond drug release in serum in vivo. While Epirubicin drug was significantly detectable in serum at 1 and 6 h post-treatment (p-value < 0.05), free Epirubicin drug was not detectable in EPND-treated mice (Figure 1g). Under physiological conditions, the pH levels are strictly ordered and different among various organs, tissues, and even organelles. It is practical to apply the release profile of EPND onto various physiological conditions, such as in the blood circulation system where pH is among 7.35–7.45. Premature drug release in blood could contribute to toxic side-effects such as hematic disorder, cardiac failure or other damages to normal cells and tissues.66 Because of the pH-dependent nature of EPND drug release, the release of Epirubicin is likely inhibited in biological systems under neutral to basic pH, such as the blood circulatory system. The lack of active drug-release in the blood may serve as a contributing mechanism of the enhanced safety and lack of myelosuppression previously observed following preclinical nanodiamond–anthracycline treatment.29 Following uptake of EPND by tumor cells, intracellular proteins can facilitate the release of drug from nanodiamond platform, particularly in acidic conditions. Taken together, the acid/protein-promoted release profile of nanodiamond–drug should contribute to limiting systemic toxicity while mediating more tumor-specific intracellular drug release.
Mechanism of Nanodiamond–Drug Cellular Uptake
Following physical characterization of EPND, we investigated the mechanism by which EPND is taken up by tumor cells. Previous studies have found that endocytosis plays a key role in lipid nanoparticle uptake, particularly clathrin-mediated-endocytosis and macropinocytosis.67,68 The clathrin-mediated-endocytosis pathway involves the binding of cell-surface receptors with extracellular cargos, followed by sequestration through intracellular adaptors that help form endosomes that mature into lysosomal organelles after fusion with primary lysosomes.69 Macropinocytosis, another form of endocytosis, is processed through forming intracellular vesicles by closing the waving cell surface ruffles back to plasma membrane, which provides sufficient transportation for extracellular fluid bulks and macromolecules.70 Another clathrin-independent form of endocytosis is caveolae-mediated endocytosis, which is characterized as a caveolin-containing, clathrin-independent endocytosis pathway that is essential for transportation of certain molecules such as cholera and albumin.71 In order to investigate whether EPND complexes enter cells by one or more endocytic mechanisms, inhibitors of these pathways were used to test their effect on cellular EPND uptake in LT2-MYC, a cell line derived from liver tumors of Tet-o-MYC/LAP-tTA (LT2-MYC) mice.72,73
Contribution of clathrin-mediated-endocytosis in EPND uptake was evaluated by pretreating LT2-MYC cells with dynasore (100 nM), which is an inhibitor of GTPase required for clathrin-mediated-endocytosis, followed by 30 min treatment with 35 μM EPND.74 Normally, EPND is readily taken up by tumor cells, however, inhibition of clathrin-mediated-endocytosis impaired this uptake by 46.8% (p-value < 0.05) (Figure 2a and 2b). Similar steps were taken to evaluate the contribution of macropinocytosis in EPND uptake by treating cells with 5-(N-ethyl-N-isopropyl) amiloride, the inhibitor of macropinocytosis, and Filipin, the inhibitor of caveolae-mediated endocytosis.68,75 Following inhibition of macropinocytosis, no detectable levels of EPND were found in tumor cells (p-value < 0.01) suggesting that macropinocytosis is required for EPND uptake (Figure 2c and 2d). However, no significant change in Epirubicin signal was detected following Filipin inhibition, indicating that caveolae-mediated endocytosis likely does not play a role in EPND uptake (Figure 2e and 2f).
Figure 2.

EPND uptake is mediated by multiple endocytic pathways. (a) Representative images of cellular EPND uptake after dynasore treatment by fluorescent microscopy. LT2-MYC cells treated with or without dynasore (100 μM) for 30 min followed by 30 min treatment with 35 μM EPND (upper panels) or PBS control (bottom panels). Blue and red fluorescent signals represent diamidino-2-phenylindole (DAPI) staining and Epirubicin (Epi) respectively. Scale bar (white), 50 μm. (b) Quantification of percent cellular EPND uptake normalized to DAPI signal (n = 3 per treatment condition). Data are represented as mean ± SD; *, p < 0.05. N.D. denotes nondetectable signal. (c) Representative images of cellular EPND uptake after 5-(N-ethyl-N-isopropyl) amiloride (EIPA) treatment by fluorescent microscopy. LT2-MYC cells treated with or without EIPA (50 μM) for 30 min following by 30 min treatment with 35 μM EPND (upper panels) or PBS control (bottom panels). Blue and red fluorescent signals represent DAPI staining and Epi, respectively. Scale bar (white), 50 μm. (d) Quantification of percent cellular EPND uptake normalized to DAPI signal (n = 3 per treatment condition). Data are represented as mean ± SD; **, p < 0.01. N.D. denotes nondetectable signal. (e) Representative images of cellular EPND uptake after Filipin treatment by fluorescent microscopy. LT2-MYC cells treated with or without Filipin (50 μg/mL) for 30 min followed by 30 min treatment with 35 μM EPND (upper panels) or PBS control (bottom panel). Blue and red fluorescent signals represent DAPI staining and Epi, respectively. Scale bar (white), 50 μm. (f) Quantification of percent cellular EPND uptake normalized to DAPI signal (n = 3 per treatment condition). Data are represented as mean ± SD. N.D. denotes nondetectable signal.
These results suggest that while clathrin-mediated-endocytosis inhibitors can impair EPND uptake, macropinocytosis is critical to EPND uptake. Inhibition of clathrin-mediated-endocytosis has previously been shown to affect macropinocytosis.76 This could explain the partial inhibition of EPND uptake following dynasore treatment. During the process of macropinocytosis, the maturation of macropinosomes is accompanied by fusion with tubular lysosomes, and the internal pH decreases to 4–5.77 Upon entering cells through macropinocytosis, EPND particles are encapsulated by macropinosomes that fuse with lysosomes, resulting in an acidification of the nanodiamond–drug environment, which could stimulate a sustained release of drug according to nanodiamond–Epirubicin release profiles at pH 4 with the help of intracellular proteins.64 Although further studies are needed, the EPND release profile suggests that a low concentration of free drug molecule in serum can be expected, since Epirubicin would not be efficiently released from nanodiamond in a pH of 7.4.63 The ladder of pH from blood to lysosome should facilitate intracellular specific delivery of Epirubicin by nanodiamonds. Thus, the mechanisms of nanodiamond drug release and cellular uptake contribute to an improved drug delivery of Epirubicin by nanodiamonds by reducing extracellular drug concentration and stimulating a sustained and continuous drug release following nanodiamond–drug tumor cell uptake.
Enhanced Nanodiamond–Drug Cellular Retention
ABC transporters mediate chemoresistance by recognizing specific structure and charge properties on molecules such as Epirubicin and effluxing them out of tumor cells, thus impairing drug efficacy. When drug is bound to the nanodiamond surface, however, the nanodiamond–drug complex differs greatly from unmodified drug molecules in terms of both size and structure. The effect of nanodiamond–drug loading on cellular retention of Epirubicin was evaluated. LT2-MYC cells were treated with equal amounts of Epirubicin and EPND (35 μM) for 1 h, washed and subsequently allowed to efflux drugs for 12 h and Epirubicin signal was analyzed. While there was significant uptake of both Epirubicin and EPND within 1 h, there was significantly less intracellular Epirubicin in tumor cells and significantly more extracellular Epirubicin when treated with unmodified Epirubicin compared to EPND-treated cells when allowed to efflux for 12 h (Figure 3a and 3b, Supporting Information Figure S4). Additionally, the amount of intracellular Epirubicin in EPND-treated tumor cells was not significantly affected by the efflux period and no detectable Epirubicin was measured in the supernatant further demonstrating the potent enhanced drug retention mediated by nanodiamond drug-delivery (Figure 3a and 3b, Supporting Information Figure S4). Drug retention analysis demonstrates that Epirubicin loading onto nanodiamonds enhances retention in tumor cells. One possible explanation is that due to the structural constraints of EPND, the nanodiamond–drug complexes no longer meet the requirement for ABC transporter substrates; hence, the drug efflux by ABC transporter protein is restrained and the drug is able to remain within cells for longer period when bound to nanodiamond and released in a slow and sustained manner. Furthermore, this is a function that is specific to nanodiamond-mediated drug delivery as Epirubicin delivery by the broadly used nanomaterial liposomal vesicles (Liposomal–Epirubicin) failed to enhance drug retention when compared to unmodified Epirubicin or EPND (p-value < 0.01) (Figure 3a and 3b).
Figure 3.
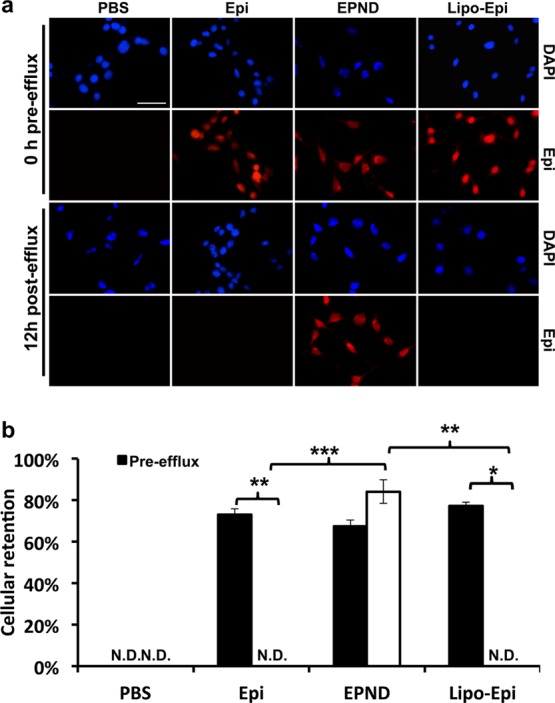
Cellular drug retention in hepatic tumor cell line of EPND and Epirubicin. (a) Representative images of cellular drug retention in LT2-MYC cells by fluorescent microscopy. LT2-MYC cells treated with Epirubicin (Epi) (35 μM), EPND (35 μM) or Liposomal–Epirubicin (Lipo-Epi) (35 μM) for 1 h before 12 h efflux. Blue and red fluorescent signals represent diamidino-2-phenylindole (DAPI) staining and Epirubicin, respectively. Scale bar (white), 50 μm. (b) Cellular retention is quantified by percent of drug retention normalized to DAPI signal (n = 3). Data are represented as mean ± SD; *, p < 0.05; **, p < 0.01; ***, p < 0.001. N.D. denotes nondetectable signal.
In Vitro Evaluation of Nanodiamond–Drug Efficacy Against Cancer Stem Cells
Apoptosis induced by Epirubicin and other anthracycline drugs is achieved through intercalating of anthracyclines between DNA and RNA base pairs resulting in interference of transcription and translation as well as the generation of reactive oxygen species.78 In order to validate the biological function of drug released from nanodiamond platform, cellular proliferation and apoptosis analysis of EPND was performed. Following treatment of LT2-MYC cells with a range of Epirubicin and EPND concentrations, we determined the half maximal inhibitory concentration (IC50) values of Epirubicin and EPND to be 16 nM and 450 nM respectively (Figure 4a). The 30-fold increase in IC50 for EPND as compared to Epirubicin in a closed in vitro system is a result of slow and sustained release of Epirubicin from EPND, which may contribute to enhanced Epirubicin retention in tumor cells. Longer-term treatment of LT2-MYC cells confirmed this delayed apoptotic effect. While there is significant difference in cell viability between Epirubicin and EPND treated cells at day 2 and day 3 (p-value <0.05), Epirubicin and EPND both caused more than 90% cell death by day 5 suggesting that although the drug release from nanodiamonds was sustained and slow, it eventually caused equivalent cell death in a closed system (Figure 4b). Induction of apoptosis by Epirubicin and EPND was confirmed by terminal deoxynucleotidyl transferase–mediated deoxyuridine triphosphate nick end labeling (TUNEL) staining (Figure 4c). Apoptosis and growth inhibition detected following nanodiamond–drug treatment demonstrated that drug had been released from the nanodiamond vehicle and the biological function of Epirubicin was not impaired or altered by its adsorption onto the nanodiamond platform.
Figure 4.
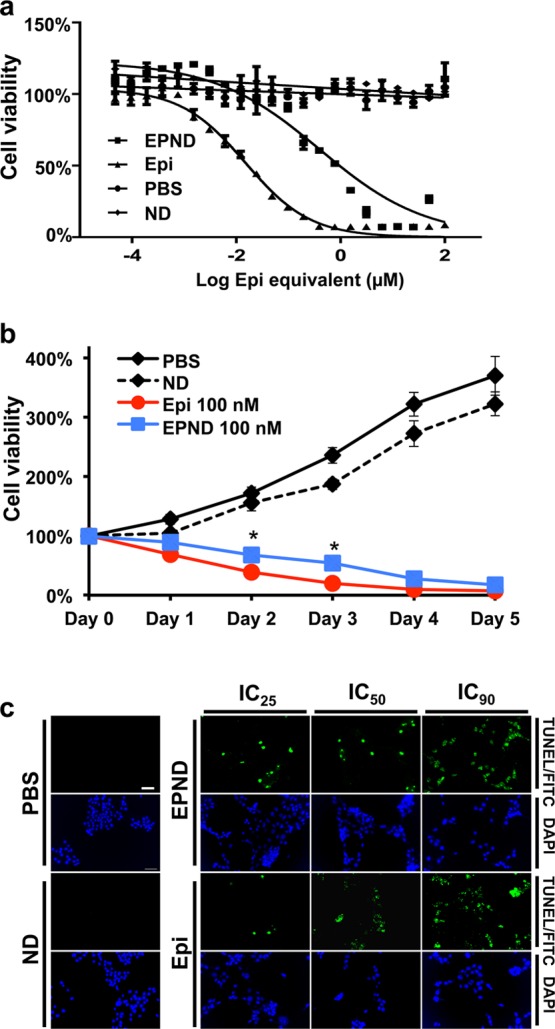
Evaluation of EPND efficacy in vitro. (a) Dose response curves of LT2-MYC cells after exposure to PBS, nanodiamond (ND) and a range of Epirubicin (Epi) and EPND concentrations. IC50 of Epi =16 nM, IC50 of EPND = 450 nM. Data are represented as mean ± SD. (b) Live cell number counting during 5 days of PBS, ND, Epi (100 nM) and EPND (100 nM) treatment. Data are represented as mean ± SD, *, p < 0.05. (c) TUNEL analysis of LT2-MYC cells after Epi and EPND treatment at IC25, IC50, and IC90 concentrations respectively with ND and PBS as control. Green and blue fluorescent signals representing apoptosis by fluorescein isothiocyanate (FITC)/TUNEL staining and diamidino-2-phenylindole (DAPI) staining, respectively. Scale bar (white), 50 μm.
Following confirmation that EPND can enhance retention of Epirubicin in tumor cells and induce apoptosis, the effect of EPND on chemoresistant cancer stem cells was evaluated. Previously, we demonstrated that MYC-driven hepatic tumors have a strong side population cell population that is enriched for cancer stem cells with tumor-initiation ability.14 The effect of Epirubicin and EPND treatment on side population cells in these MYC-driven hepatic tumors was analyzed. LT2-MYC cells were treated with Epirubicin and EPND for 48 h prior side population analysis. Epirubicin treatment of LT2-MYC cells resulted in a significant increase in side population cells compared to control treated cells (p-value <0.01), while EPND treatment resulted in a significant decrease in side population percentage (p-value < 0.05) (Figure 5a and 5b). In order to confirm that the side population and nonside population were cells and not cellular debris following drug treatment, LT2-MYC cells were sorted and analyzed with live cell-specific Calcein AM dye to confirm that viable surviving cells were gated and analyzed (Supporting Information Figure S5). The increase in side population cell percentage following Epirubicin treatment suggests that Epirubicin treatment preferentially kills nonside population cells while sparing chemoresistant side population cells. In contrast, the lack of increase in side population cell percentage following EPND treatment suggests that the enhanced retention of EPND in tumor cells allows for equal, if not greater, killing of chemoresistant side population cells. Because tumor-initiation is a hallmark of cancer stem cells, the ability of Epirubicin and EPND to impair colony formation in vitro was evaluated. While sorted side population cells could form more colony forming units compared to nonside population and unsorted LT2-MYC cells, EPND treatment at both 50 and 100 nM resulted in a significant reduction in both size and total of number of colony forming units by side population cells compared to phosphate buffered saline (PBS) (p-value < 0.01, p-value < 0.001) (Figure 5c and 5d). Meanwhile, the number and size of colony forming units of Epirubicin-treated side population cells were not significantly affected compared to PBS and were significantly more than EPND-treated side population cells (p-value < 0.001), suggesting that side population-enriched cancer stem cells could escape and survive in Epirubicin 50 nM treatment and continue to proliferate (Figure 5c and 5d). This data provides evidence that nanodiamond–drug delivery may be an effective method for overcoming chemoresistance in cancer stem cells and target both bulk tumor cells as well as tumor-initiating cancer stem cells.
Figure 5.

Enhanced efficacy of EPND against side population cells in vitro. (a) Representative images of flow cytometry analysis of side-population (SP) in LT2-MYC cell line after 48 h of Epirubicin (Epi) (100 nM and 200 nM) or EPND (100 nM and 200 nM) treatment using Hoechst dye 33342 staining, PBS and nanodiamond (ND) as control. SP gate was determined by absence of cell population after addition of 500 μM verapamil in PBS control. The percentages of SP cells in the total live cells gated are shown. (b) Quantitative analysis of SP cells in LT2-MYC cell line after 48 h of Epi, EPND, PBS and ND treatment (n = 3). Data are represented as mean ± SD, *, p < 0.05; **, p < 0.01. (c) Colony-forming units (CFU) spheroid assay of sorted SP cell, non-SP cells and total cells performed in serum free DMEM 7 days after PBS, ND, Epi (50 nM and 100 nM) and EPND (50 nM and 100 nM) treatment (n = 5). Data are represented as mean ± SD, **, p < 0.01; ***, p < 0.001. (d) Representative images of colony spheroids formed by SP cells treated with PBS, ND, Epi and EPND. Scale bar, 50 μM.
In Vivo Evaluation of Nanodiamond–Drug Efficacy Against Cancer Stem Cells
After confirming that EPND can enhance cellular drug retention and effectively target chemoresistant cancer stem cells in MYC-driven tumor cells in vitro, the effect of EPND compared to unmodified Epirubicin was evaluated in vivo in a murine model of MYC-induced hepatic cancer that we previously demonstrated enriched for tumor-initiating chemoresistant cancer stem cells in the side population population.14 Following induction of MYC-driven tumors, tumor-bearing mice were treated with either Epirubicin (5 mg/kg) or EPND (5 mg/kg Epirubicin equivalent) or controls over a 12 d period and tumors were subsequently isolated for side population analysis (Figure 6a). Consistent with in vitro experiments, Epirubicin treatment resulted in an increase in the percentage of side population cells while EPND treatment resulted in a decrease in the side population percentage (Figure 6b and 6c). Thus, EPND can effectively target and kill both nonside population and side population cells in primary hepatic tumors, while unmodified Epirubicin preferentially kills nonside population cells.
Figure 6.

Nanodiamond delivery of Epirubicin can effectively target side population cells in murine liver tumor models. (a) Schematic diagram showing the murine model for MYC-driven tumor induction, long-term drug treatment and experimental workflow. MYC-driven tumor was induced in 6-week old female FVB/N mice by hydrodynamic transfection. Six weeks after transfection, mice were treated with PBS (n = 4), nanodiamond (ND) (1 mg/kg, n = 5), Epirubicin (Epi) (5 mg/kg, n = 5) or EPND (5 mg/kg, n = 5) via tail vein (i.v.) injection every 3 d. Tumors were isolated for further analysis 3 d after the final drug treatment. (b) Representative images of flow cytometry analysis of side population (SP) cells in MYC-driven tumor tissue after Epi, EPND63 and ND treatment using Hoechst dye 33342 staining, PBS as control. SP gate was determined by absence of cell population after addition of 100 μM verapamil in PBS control. The percentages of SP cells in the total live cells gated are shown. (c) Quantitative analysis of SP cells in MYC-driven tumor tissue after Epi, EPND, ND and PBS treatment (n = 3). Data are represented as mean ± SD; *, p < 0.05. (d) Representative microscopic images showing histological morphology and apoptotic response in normal liver tissue and MYC-driven tumor tissue after drug treatment: hematoxylin and eosin staining (H&E) (top row), bright-field (BF) image (second from the top row), fluorescein isothiocyanate (FITC) signal indicating apoptosis by TUNEL staining (third from the top row), and diamidino-2-phenylindole (DAPI) staining (bottom row). White dotted line denotes boundaries between tumor and adjacent normal liver tissue. Scale bar, 100 μm. (e) Quantification of percent apoptosis signal over DAPI staining (n = 3). Data are represented as mean ± SD; *, p < 0.05; **, p < 0.01.
Apoptosis analysis was performed to determine if the alterations in side population percentages in vivo were due to effective killing of primary hepatic tumor cells. A strong apoptotic response was detected in both Epirubicin and EPND treated tumors while nanodiamond and PBS treated tumors showed minimal apoptosis (Figure 6d and 6e). Additionally, apoptosis following EPND treatment was limited to tumor tissue and not adjacent normal hepatic tissue, suggesting that nanodiamonds can serve as an effective and safe drug-delivery platform to target and eliminate noncancer stem cells as well as chemoresistant cancer stem cells (Figure 6d). Furthermore, bodyweight analysis in tumor-bearing mice during the treatment demonstrated that while systemic toxic effects of Epirubicin result in notable weight-loss and PBS and nanodiamond treatment resulted in ineffective therapy and continuous tumor growth seen in notable weight-gain, EPND treatment resulted in no weight loss due to both a lack of systemic toxicity as well as effective tumor treatment (Figure 7a). The effect of Epirubicin loading onto nanodiamonds on overall toxicity was also evaluated by analyzing bodyweight and survival of FVB/N mice following high dosage treatment of Epirubicin or EPND (20 mg/kg). High Epirubicin dosages caused significant decrease in bodyweight and acute chemotherapy-related death where equivalent concentration of EPND resulted in no difference compared to PBS control (Figure 7b and 7c) (p < 0.001). Moreover, administration of the nanodiamond vehicle alone showed no effect in side population proportion (Figure 5a, 5b, 6b and 6c), cell viability (Figure 4a and 4b), bodyweight and survival (Figure 7b and 7c) as well as in apoptotic response (Figure 4c, 6d and 6e) in vitro and in vivo suggesting that this carbon nanoparticle can serve as a safe drug delivery platform.
Figure 7.
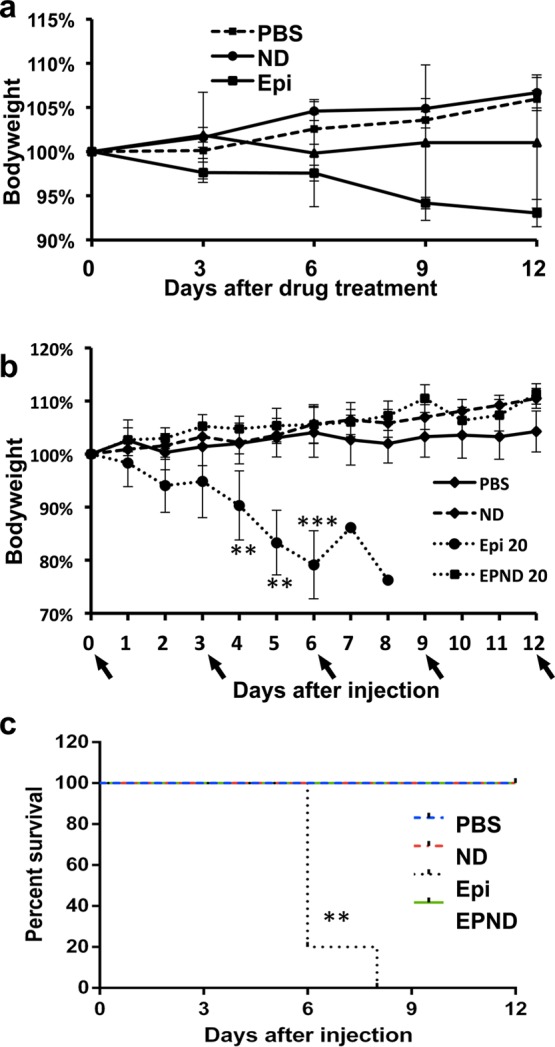
EPND is less toxic than Epirubicin. (a) Bodyweight analysis of MYC-tumor bearing mice injected with PBS, nanodiamond (ND), Epirubicin (Epi) (5 mg/kg) and EPND (5 mg/kg) (n = 5) every 3 days. Black arrow denotes injection day. Data are presented as mean ± SD. (b) Bodyweight analysis of healthy FVB/N mice injected with PBS, ND, Epi (20 mg/kg) and EPND (20 mg/kg) (n = 5) every 3 days. Black arrow denotes injection day. Data are presented as mean ± SD; **, p < 0.01; ***. p < 0.001. (c) Kaplan–Meier survival plot of healthy FVB/N mice injected with PBS, ND, Epi 20 (20 mg/kg) and EPND 20 (20 mg/kg) (n = 5) every 3 days. Mice were sacrificed once bodyweight loss exceeded 20%. **, p < 0.01.
We have previously demonstrated that treatment with unmodified drugs that are ABC transporter substrates results in the preferential elimination of nonside population cells and an increased selection for tumor-initiating side population cells among the surviving tumor cells.14 Tumor-initiation of surviving tumor cells following Epirubicin and EPND treatment was analyzed to determine if EPND treatment can more effectively overcome this selection for chemoresistant cancer stem cells that are required for secondary tumor formation and recurrence. While Epirubicin treatment resulted in enhanced tumor-initiation in allografts when seeded at 300 cells per injection, EPND treatment successfully prevented secondary allograft tumor formation (Figure 8a, 8b and 8c). These results demonstrate that EPND can serve as an effective method for overcoming chemoresistance in cancer stem cells and prevent the characteristic tumor-initiation of surviving cancer stem cells that contribute to recurrence and metastasis.
Figure 8.

EPND can inhibit tumor-initiation in murine hepatic tumor allografts. (a) Representative image of FVB/N mouse seeded in hindquarters with cells from PBS, nanodiamond (ND), Epirubicin (Epi) or EPND treated MYC-driven tumors 58 days after allograft transplantation. Two mice in each panel were under same treatment conditions. Black arrows indicate treatment condition and number. (b) Quantitative analysis of percentage allograft tumor formation in FVB/N mice injected with cells from drug treated MYC-driven tumors (n = 10 per treatment condition). Data are represented as mean. N.D. denotes nondetectable tumor. (c) Quantitative analysis of allograft tumor volumes in FVB/N mice injected with cells from drug treated MYC-driven tumor (n = 10 per treatment condition). Data are represented as mean ± SD. N.D. denotes nondetectable tumor.
Conclusion
Our study provides strong evidence that nanodiamonds can serve as an excellent platform for enhanced chemotherapeutic delivery, particularly in the treatment of chemoresistant cancer stem cells. Under optimized synthesis conditions, nanodiamonds are able to load anthracycline drugs such as Epirubicin with high affinity and efficiency. The resulting nanodiamond–drug complex, EPND, possesses the necessary properties in size and surface charge to facilitate passively targeted delivery into tumor tissues as well as avoid clearance by phagocytic cells. Moreover, the mechanisms of EPND drug release and uptake likely play an important role in enhancing intratumoral drug release. When the nanodiamond–drug complex encounters an acidic environment, the affinity between Epirubicin and nanodiamond decreases so that Epirubicin disassociates from nanodiamond surface. Intracellular charged proteins can also stimulate the detachment of Epirubicin from nanodiamond. These drug release mechanisms coordinates with macropinocytosis-mediated cellular uptake to ensure intracellular-specific drug release, minimizing toxic side-effects associated with high levels of free anthracycine in the blood circulatory system.
The association of Epirubicin to nanodiamonds prevents efflux of Epirubicin by ABC transporters, allowing for enhanced cellular retention that leads to cell death in both chemoresistant cancer stem cells and noncancer stem cells and effective impairment of cancer stem cell-mediated tumor-initiation. While more preclinical work in murine and large animal models are needed before nanodiamond–anthracycline drug delivery can be translated into the clinic, the work presented here demonstrates the benefits of an nanodiamond-based drug delivery platform in biomedical applications, particularly against chemoresistant cancer stem cells. Because of the versatility of an nanodiamond-based drug delivery platform, future application of nanodiamonds could expand its conjugations and functional modifications including the addition of other ABC transporter effluxed drugs as well as active targeting components such as antibodies or peptides against tumor cell surface proteins for targeted drug release.43,79−81 Additionally, the application of a nanodiamond–drug delivery system is not limited to hepatocellular carcinoma and likely will be of benefit to various malignant cancer types where chemoresistance is commonly associated with ABC transporter overexpression.82,83 Compared to small molecule ABC transporter inhibitors, this nanodiamond drug-delivery platform can reduce toxicity primarily through passive targeting to increase tumor-specific drug concentration and improve efficacy by enhancing retention of the drugs within the correct cell compartments. As such, a nanodiamond drug-delivery platform is a promising nanomedical approach to treating a broad range of difficult cancers, particularly those driven by chemoresistant cancer stem cells.
Materials and Methods
Materials
NanoAmando Soft Hydrogel containing nanodiamonds was purchased from NanoCarbon Research Institute (Nagano, Japan). Epirubicin, Verapamil, 5-(N-ethyl-N-isopropyl) amiloride, Propidium Iodide, Hoechst Dye 33342, Filipin and Dynasore was purchased from Sigma-Aldrich (MO, USA). Roswell Park Memorial Institute 1640 (RPMI-1640) and Calcein AM dye were purchased from Thermo Scientific (MA, USA). Fetal Bovine Serum (FBS) was purchased from Biowest (Nuaillé, France). Penicillin/Streptomycin was purchased from Life Technologies (CA, USA). (3-(4,5-Dimethylthiazol-2-yl)-5-(3-carboxymethoxyphenyl)-2-(4-sulfophenyl)-2H-tetrazolium) MTS assay was purchased from Promega (WI, USA). Red Blood Cell lysis buffer was purchased from eBioscience (CA, USA). Spectra/Por Dialysis membrane tubing (MWCO 6–8000 kDa) was purchased from Spectrum Laboratories (Shanghai, China).
Preparation of Nanodiamond–Drug Complex
NanoAmando Soft Hydrogel was freeze-dried to obtain nanodiamond powder. nanodiamond powder was resuspended in deionized water to form nanodiamond solution (5 mg/mL) and autoclaved. To form nanodiamond–drug complex, nanodiamond solution (5 mg/mL) and Epirubicin (1 mg/mL) were mixed at a weight ratio of 5:1 (nanodiamond:Epirubicin), and NaOH solution was added to until the final concentration of NaOH is 2.5 mM. Following reaction at room temperature, the mixture was centrifuged for 15 min at 15,000 rpm, room temperature. Subsequently, the pelleted EPND was resuspended in deionized water. Unbound Epirubicin remaining in the supernatant was quantified by measuring absorbance at 485 nm using the Infinite 200 PRO (Tecan, Zurich, Switzerland). Loading efficiency of Epirubicin was then calculated from the absorbance of Epirubicin at 485 nm wavelength which linearly correlated with Epirubicin concentration. A standard curve was established by serial dilution of Epirubicin ranging from 0 to 1 mM to attribute absorbance measurements to Epirubicin concentration. The calculation of the number of Epirubicin per nanodiamond is based on the molecular weight of eprrubicin (MW = 579.98) and nanodiamonds (MW = 46,583).84
Nanodiamond–Drug Characterization
Nanodiamonds and EPND (0.1–0.2 mg/mL, nanodiamond concentration) were suspended in deionized water within disposable micro cuvettes. Hydrodynamic size and ζ-potential measurements were performed on a Zetasizer Nano (Malvern, UK). Final values were averages of three or more separate measurements of each sample. Fourier transform infrared spectroscopy was performed using a PerkinElmer FTIR spectrum 2000 over a range of 400–4000 cm–1. Samples were dried using a rotary evaporator. Five mg of sample was mixed with 0.1 g of KBr powder using mortar and pestle before pressing the sample to a thin film of which the spectra were taken. Transmission electronic microscopy was performed using a JEOL JEM-2010 transmission electron microscope. The nanodiamond and EPND were sonicated in water at a concentration of 0.5 mg/mL, and the suspension was dropped on the copper grid (coated with carbon film), then dried overnight at room temperature prior to imaging.
Preparation and Characterization of Liposomal–Drug Complex
Liposomal–Epirubicin synthesis was performed as previously described using ammonium sulfate gradients and dialysis tubing (MWCO 6000–8000 kDa).85,86 Lipid (Egg Phosphatidylcholine/Cholesterol molar ratio 2:1) was dissolved in chloroform and dried overnight using a rotary evaporator. Dried lipid was rehydrated with ammonium sulfate solution and dialyzed overnight. Epirubicin solution was then added to lipid solution followed by 3 h of further dialysis. Liposomal–Epirubicin was then filtrated through a 400 μM filter. Loading efficiency of Epirubicin was Epirubicin concentration was quantified according to an Epirubicin standard curve in lipid solution. Liposomal–Epirubicin hydrodynamic size and ζ-potential measurements were performed on Zetasizer Nano (Malvern, UK) with a diameter of 162.8 ± 3.1 nm and a negative zeta-potential of −4.4 ± 1.2 mV (Supporting Information Table S1). Final values were averages of three or more separate measurements of each sample.
Nanodiamond–Drug Release
Epirubicin release was investigated under a range of pH and protein concentrations in physiological condition of 37 °C. For different pH conditions of pH 2, 4, 7, 10 and 12, pH of deionized water solutions was adjusted using HCl and NaOH and tested by pH meter. For different protein concentrations, 10, 5, 2.5, 1.25, 0.63, 0.3, 0.1 and 0% FBS was added to RPMI as stock solutions. For both pH and protein concentrations, EPND was resuspended in the solutions and incubated at 37 °C until indicated time points. At each time point, EPND was centrifuged for 15 min at 15 000 rpm and the supernatant containing unbound epirubicin was collected for quantification. Quantification was done by measuring the absorbance wavelength of Epirubicin at 485 nm using the Infinite 200 PRO (Tecan, Zurich, Switzerland). Two standard curves were established by serial dilution of Epirubicin in water or RPMI, ranging from 0 to 1 mM to attribute absorbance measurements due to Epirubicin concentration (Figure S2a). After collection of supernatant at indicated time points, EPND was resuspended in 1 mL of the previously made stock solution and sonicated for twice at 20 s each before incubation at 37 °C until the next time point. Nanodiamond–drug release was also measured in vivo. FVB/N mice were injected with 5 mg/kg Epirubicin or EPND. At different time points (1, 6, 12, 24 and 48 h), whole blood was collected by cardiac puncture. Serum was collected from supernatant following incubation of blood on ice for 30 min followed by 30 min of centrifugation at 6000 rpm. Serum Epirubicin concentration was quantified according to an Epirubicin standard curve in PBS-treated mice serum (Figure S1a).
Cell Line and Murine Tumor Model
LT2-MYC cell line was derived from Tet-O-MYC/LAP-tTA (LT2-MYC) murine hepatoblastoma tumor model from Professor J. Michael Bishop’s lab (University of California, San Francisco), which has been previously described.72,73 LT2-MYC cell line was cultured in RPMI-1640 supplemented with 10% FBS and 1% Penicillin/Streptomycin in 37 °C with 5% CO2. MYC-induced tumor model was induced through hydrodynamic transfection as previously described.14,87 Briefly, 6-week-old female FVB/N mice (InVivos, Singapore) were injected with 20 μg of pT3-EF1a-flox-MYC plasmids which encodes MYC, together with 2 μg of pCMV-HSB2 plasmids which encodes Sleeping Beauty transposase mixing in 2 mL of 0.9% NaCl. All animal studies were done according to approved protocols by the NUS Institutional Animal Care and Use Committee, Singapore.
Evaluation of Nanodiamond–Drug Uptake and Efflux
For EPND uptake assay, 1 × 10⁴ LT2-MYC cells per well were seeded on a Nunc Lab-Tek 2-well chamber slide and cultured for 24 h at 37 °C with 5% CO2 and then pretreated with 100 μM dynasore, 50 μM 5-(N-ethyl-N-isopropyl) amiloride or 5 μg/mL Filipin for 30 min. 20 μM of EPND was then added and treated for 30 min with culture media as negative control. Cells were then gently washed with 1 × PBS thrice and fixed with 4% paraformaldehyde for 10 min at 37 °C. Subsequently, fixed cells were stained with DAPI for 5 min and visualized using an Olympus BX60 fluorescence microscope (Tokyo, Japan). Epirubicin was visualized with the Rhodamine channel at an excitation/emission wavelength of 482/570 nm. Quantification of fluorescent signal was performed through ImageJ. Images are converted to binary color, a threshold for particle counting was set and then the particle number was counted by ImageJ Analyze particles function. Triplicate images are analyzed to obtain mean value and SD.
For EPND cellular retention assay, 1 × 10⁴ LT2-MYC cells per well were seeded on a Nunc Lab-Tek 2-well chamber slide and cultured for 24 h at 37 °C with 5% CO2 and then pretreated with 35 μM of Epirubicin, EPND and Liposomal-Epi. PBS was added as negative control. For pre-efflux, cells were gently washed with 1 × PBS thrice and fixed with 4% paraformaldehyde (PFA) for 10 min at 37 °C. Subsequently, fixed cells were stained with DAPI for 5 min and visualized using an Olympus BX60 fluorescence microscope (Tokyo, Japan). Epirubicin was visualized with the Rhodamine channel at an excitation/emission wavelength of 482/570 nm. For 12 h postefflux, cells were incubated for another 12 h after 1 h treatment, with 2 to 3 times of PBS washing. Cells were then fixed and visualized as described in pre-efflux step.
Evaluating Cell Viability
For cell viability assays, 1.5 × 10³ LT2-MYC cells were seeded per well in Nunc 96-well plates and cultured for 24 h at 37 °C with 5% CO2. Cells were treated with a range of Epirubicin or EPND concentrations (0.00005 to 100 μM) for 72 h where PBS and equivalent nanodiamond were used as control. Cells were washed once with 1 × PBS. Cell viability was quantified using 20% MTS solution in clear RPMI media after 1 h, at absorbance wavelength of 490 nm in accordance to manufacturer’s protocol. Background absorbance (wells without any cells) was subtracted from each sample before calculating the final absorbance value. Dose–response curves were then generated by fitting the final absorbance ratios using Prism 6 software (Graphpad, CA, USA). Additionally, 2 × 10⁴ LT2-MYC cells were seeded per well in Nunc 6-well plates and cultured for 24 h at 37 °C with 5% CO2. Cells were then treated with PBS, nanodiamond, 100 nM of Epirubicin and EPND respectively. Live cell numbers were determined following Trypan blue staining every day for 5 days.
Side Population Analysis by Flow Cytometry
For in vitro side population analysis, 0.7 × 10⁶ LT2-MYC cells were seeded in Nunc 10 cm cell culture dishes. The following day, PBS, nanodiamond, 100 nM and 200 nM of Epirubicin or EPND were added to each plate respectively and treated for 1 h following by washing with 1 × PBS, replacing with fresh RPMI media and incubating in 37 °C for 48 h, with washing using 1 × PBS at every 24 h. Live cells were counted using trypan blue staining at 48 h. Subsequently, cells were collected and filtered through a 40 μm cell strainer (BD Bioscience, NJ, USA) to obtain single-cell suspensions and aliquoted in 1 mL of RPMI media at 0.5 × 10⁶ cells/mL. Pretreatment of verapamil was done by incubating cells in 37°C water bath with 100 mM fresh-made verapamil 15 min before staining Hoechst Dye.
Hoechst Dye staining was performed by incubating cells in 37°C water bath with 5 μL Hoechst dye 33342 (1 mg/mL) for exactly 90 min. After staining, cells were washed with 7 mL HBSS+, collected by centrifuging at 1000 rpm, 5 min. Cells were resuspended in 500 μL HBSS+. PI was then added at 0.2 μg/mL right before analysis to exclude dead cells. Hoechst 33342 was excited with the ultraviolet laser of LSRII (BD Bioscience, NJ, USA) at 350 nm and fluorescence emission was measured with 405/BP30 (Hoechst blue) and 570/BP20 (Hoechst red) optical filters. PI labeling was measured through the 630/BP30 filter for the discrimination of dead cells. side population gating was identified as the absence of cell population by verapamil addition in PBS control. Calcein AM dye staining was performed by incubating cells with 10 μM calcein AM dye for 30 min. Calcein AM will only be taken up and metabolized by live cells and then emit florescent signal at 520 nm. For colony formation spheroid assay, SP, Nonside population and total live cells were sorted using Verapamil gating by BD FacsAria II. Thirty cells of each population were seeded into 1 well of 96-well plate following by treatment of PBS, nanodiamond, Epirubicin (50 nM and 100 nM), EPND (50 nM and 100 nM). Colony forming units were counted following 7, 14, and 21 days of growth in supplemented serum-free DMEM media (Supporting Information Table S2).
For in vivo side population analysis, liver tumor tissues were isolated and diced into 1–3 mm pieces before treating with 2 mg/mL of collagenase/Dispase (Roche, IN, USA) for 15 min at 37 °C. After which, tumor cell solution was sieved through sterile medical gauze (Supplier, location) and centrifuged for 5 min at 1000 rpm, 4 °C. Cells were then resuspended with PBS containing 2% FBS and filtered through a 70 μm cell strainer (Fisher Scientific, MA, USA) and then a 40 μm cell strainer. Thereafter, cells were centrifuged and resuspended in 1 × red blood cell lysis buffer, incubated on ice for 10 min and then washed three times with PBS containing 2% FBS. Aliquots of 0.5 × 10⁶ cells/mL from each tumors were resuspended in 1 mL of RPMI media. Flow cytometry analysis for in vivo cells from MYC-driven tumors were performed in the same manner as in vitro experiments.
In Vivo Drug Treatment and Tumor-initiation Evaluation
MYC-induced hepatic tumor-bearing mice were treated with Epirubicin or EPND at 5 mg/kg, using PBS and nanodiamond as controls through lateral tail vein injection 6 weeks after hydrodynamic transfection. Drug treatment was carried out 4 times at every 3 d interval. Three days after the last dose, mice were sacrificed and tumors were isolated for secondary tumor-initiation allograft experiments and TUNEL staining. For allograft experiments, live cells from excised tumors were sorted using BD FACSAria (BD Bioscience, NJ, USA) based on PI stain exclusion. 300 cells from Epirubicin and EPND-treated mice were injected into the hindquarters of 6-week-old FVB/N mice with reduced-growth factor Matrigel (BD Bioscience, NJ, USA). Tumors were observed on a weekly basis until approximately 1.5 cm in diameter before they were isolated. Sizes of tumors were measured using a caliper and calculated using the equation V = (a·b·b)/2, where a indicated the length (mm) and b indicated the width (mm) of the tumor, and V is the final volume (mm3). Survival study was performed using 6-week old healthy FVB/N mice. PBS, nanodiamond, Epirubicin (20 mg/kg) and EPND (20 mg/kg) were injected respectively through tail vein every 3 days. Bodyweight was measured daily and Kaplan–Meier survival analysis was performed following study. All animal studies were done according to approved protocols by the NUS Institutional Animal Care and Use Committee, Singapore.
Apoptosis Assay
For in vitro apoptosis, 1 × 10⁴ LT2-Myc cells were seeded per well on a Nunc Lab-Tek 2-well chamber slide and cultured for 24 h at 37 °C with 5% CO2. Cells were subsequently treated with IC25, IC50 or IC90 concentrations of Epirubicin or EPND for 48 h. For in vivo apoptosis, treated tissues were embedded in paraffin and cut into slides. Staining was done using ApopTag Fluoresein In Situ Apoptosis Detection Kit (Cat. No. S7110) (Millipore, MA, USA) for detection of apoptotic cells in liver tissue samples from the mice that were sacrificed. The slides were deparaffinized, pretreated with Proteinase K, then treated with Tdt Enzyme at 37 °C for 1 h and last stained with antidigoxigenin antibody. This assay utilizes an antidigoxigenin antibody conjugated to a Fluorescein reporter molecule, providing an indirect TUNEL staining method.
Statistical Analysis
All experimental data were at least performed in triplicates, the results averaged, and the standard deviation (SD) or standard error of the mean (SEM) calculated. Unpaired Student’s t test was used for statistical comparison of 2 different independent groups. A probability value of p < 0.05 was accepted as statistically significant.
Acknowledgments
E. K. Chow gratefully acknowledges support from the National Research Foundation Cancer Science Institute of Singapore RCE Main Grant, National Medical Research Council (NMRC/BNIG/2012/2013) and Ministry of Education Academic Research Fund (MOE AcRF Tier 1 T1-2012 Oct-11). D. Ho gratefully acknowledges support from the National Science Foundation CAREER Award (CMMI-0846323), Center for Scalable and Integrated NanoManufacturing (DMI-0327077), CMMI-0856492, DMR-1105060, V Foundation for Cancer Research Scholars Award, Wallace H. Coulter Foundation Translational Research Award, Society for Laboratory Automation and Screening (SLAS) Endowed Fellowship, Beckman Coulter Life Sciences, and National Cancer Institute Grant U54CA151880. The content is solely the responsibility of the authors and does not necessarily represent the official views of the National Cancer Institute or the National Institutes of Health.
Supporting Information Available
Epirubicin measurement and loading efficiency; Transmission electron microscopy of nanodiamond and EPND; Epirubicin release under different FBS concentrations; Quantification of effluxed Epirubicin in vitro; Fluorescent microscopy analysis of side-population, nonside population and total cell population; Diameter and zeta-potential of Liposomal Epirubicin; Components of serum-free DMEM media with growth factors for colony forming units assay. This material is available free of charge via the Internet at http://pubs.acs.org.
Author Contributions
⊥ X.W. and X.C.L. contributed equally to this work.
The authors declare no competing financial interest.
Funding Statement
National Institutes of Health, United States
Supplementary Material
References
- Vivarelli M.; Montalti R.; Risaliti A. Multimodal Treatment of Hepatocellular Carcinoma on Cirrhosis: An Update. World J. Gastroenterol. 2013, 19, 7316–7326. [DOI] [PMC free article] [PubMed] [Google Scholar]
- Longley D.; Johnston P. Molecular Mechanisms of Drug Resistance. J. Pathol. 2005, 205, 275–292. [DOI] [PubMed] [Google Scholar]
- Globocan 2012: Estimated Cancer Incidence, Mortality and Prevalence Worldwide in 2012. http://globocan.iarc.fr/Default.aspx (accessed April 03, 2014).
- Siegel R.; Naishadham D.; Jemal A. Cancer Statistics, 2013. Ca-Cancer J. Clin. 2013, 63, 11–30. [DOI] [PubMed] [Google Scholar]
- Lapidot T.; Sirard C.; Vormoor J.; Murdoch B.; Hoang T.; Caceres-Cortes J.; Minden M.; Paterson B.; Caligiuri M. A.; Dick J. E. A Cell Initiating Human Acute Myeloid Leukaemia after Transplantation into Scid Mice. Nature 1994, 367, 645–648. [DOI] [PubMed] [Google Scholar]
- Abdullah L. N.; Chow E. K.-H. Mechanisms of Chemoresistance in Cancer Stem Cells. Clin. Transl. Med. 2013, 2, 1–9. [DOI] [PMC free article] [PubMed] [Google Scholar]
- Al-Hajj M.; Wicha M. S.; Benito-Hernandez A.; Morrison S. J.; Clarke M. F. Prospective Identification of Tumorigenic Breast Cancer Cells. Proc. Natl. Acad. Sci. U. S. A. 2003, 100, 3983–3988. [DOI] [PMC free article] [PubMed] [Google Scholar]
- Chen C.-j.; Chin J. E.; Ueda K.; Clark D. P.; Pastan I.; Gottesman M. M.; Roninson I. B. Internal Duplication and Homology with Bacterial Transport Proteins in the Mdr1 (P-Glycoprotein) Gene from Multidrug-Resistant Human Cells. Cell 1986, 47, 381–389. [DOI] [PubMed] [Google Scholar]
- Marquardt J. U.; Raggi C.; Andersen J. B.; Seo D.; Avital I.; Geller D.; Lee Y.-H.; Kitade M.; Holczbauer A.; Gillen M. C.; et al. Human Hepatic Cancer Stem Cells Are Characterized by Common Stemness Traits and Diverse Oncogenic Pathways. Hepatology 2011, 54, 1031–1042. [DOI] [PMC free article] [PubMed] [Google Scholar]
- Hirschmann-Jax C.; Foster A.; Wulf G.; Nuchtern J.; Jax T.; Gobel U.; Goodell M.; Brenner M. A Distinct “Side Population” of Cells with High Drug Efflux Capacity in Human Tumor Cells. Proc. Natl. Acad. Sci. U. S. A. 2004, 101, 14228–14233. [DOI] [PMC free article] [PubMed] [Google Scholar]
- Haraguchi N.; Utsunomiya T.; Inoue H.; Tanaka F.; Mimori K.; Barnard G. F.; Mori M. Characterization of a Side Population of Cancer Cells from Human Gastrointestinal System. Stem Cells 2006, 24, 506–513. [DOI] [PubMed] [Google Scholar]
- Wu C.; Wei Q.; Utomo V.; Nadesan P.; Whetstone H.; Kandel R.; Wunder J. S.; Alman B. A. Side Population Cells Isolated from Mesenchymal Neoplasms Have Tumor Initiating Potential. Cancer Res. 2007, 67, 8216–8222. [DOI] [PubMed] [Google Scholar]
- Chan K. L.; Guan X. Y.; Ng I. O. High-Throughput Tissue Microarray Analysis of C-Myc Activation in Chronic Liver Diseases and Hepatocellular Carcinoma. Hum. Pathol. 2004, 35, 1324–1331. [DOI] [PubMed] [Google Scholar]
- Chow E. K. H.; Fan L. l.; Chen X.; Bishop J. M. Oncogene—Specific Formation of Chemoresistant Murine Hepatic Cancer Stem Cells. Hepatology 2012, 56, 1331–1341. [DOI] [PMC free article] [PubMed] [Google Scholar]
- Eckford P. D.; Sharom F. J. Abc Efflux Pump-Based Resistance to Chemotherapy Drugs. Chem. Rev. 2009, 109, 2989–3011. [DOI] [PubMed] [Google Scholar]
- Ryberg M.; Nielsen D.; Skovsgaard T.; Hansen J.; Jensen B. V.; Dombernowsky P. Epirubicin Cardiotoxicity: An Analysis of 469 Patients with Metastatic Breast Cancer. J. Clin. Oncol. 1998, 16, 3502–3508. [DOI] [PubMed] [Google Scholar]
- National Cancer Institute; Northwestern University. Epirubicin and Celecoxib in Treating Patients with Hepatocellular Carcinoma. http://www.clinicaltrials.gov/ct2/show/NCT00057980. NLM Identifier: NCT00057980 (accessed April 03, 2014).
- Dalton W. S.; Crowley J. J.; Salmon S. S.; Grogan T. M.; Laufman L. R.; Weiss G. R.; Bonnet J. D. Phase III, A Randomized Study of Oral Verapamil as a Chemosensitizer to Reverse Drug Resistance in Patients with Refractory Myeloma. A Southwest Oncology Group Study. Cancer 1995, 75, 815–820. [DOI] [PubMed] [Google Scholar]
- Leonard G. D.; Fojo T.; Bates S. E. The Role of Abc Transporters in Clinical Practice. Oncologist 2003, 8, 411–424. [DOI] [PubMed] [Google Scholar]
- Sonneveld P.; Suciu S.; Weijermans P.; Beksac M.; Neuwirtova R.; Solbu G.; Lokhorst H.; Van Der Lelie J.; Dohner H.; Gerhartz H. Cyclosporin a Combined with Vincristine, Doxorubicin and Dexamethasone (Vad) Compared with Vad Alone in Patients with Advanced Refractory Multiple Myeloma: An Eortc–Hovon Randomized Phase III Study (06914). Br. J. Haematol. 2001, 115, 895–902. [DOI] [PubMed] [Google Scholar]
- Gottesman M. M.; Fojo T.; Bates S. E. Multidrug Resistance in Cancer: Role of ATP–Dependent Transporters. Nat. Rev. Cancer 2002, 2, 48–58. [DOI] [PubMed] [Google Scholar]
- Chan J. M.; Rhee J. W.; Drum C. L.; Bronson R. T.; Golomb G.; Langer R.; Farokhzad O. C. In Vivo Prevention of Arterial Restenosis with Paclitaxel-Encapsulated Targeted Lipid-Polymeric Nanoparticles. Proc. Natl. Acad. Sci. U. S. A. 2011, 108, 19347–19352. [DOI] [PMC free article] [PubMed] [Google Scholar]
- Xiao Z.; Levy-Nissenbaum E.; Alexis F.; Luptak A.; Teply B. A.; Chan J. M.; Shi J.; Digga E.; Cheng J.; Langer R.; et al. Engineering of Targeted Nanoparticles for Cancer Therapy Using Internalizing Aptamers Isolated by Cell-Uptake Selection. ACS Nano 2012, 6, 696–704. [DOI] [PMC free article] [PubMed] [Google Scholar]
- Zhang X. Q.; Xu X.; Lam R.; Giljohann D.; Ho D.; Mirkin C. A. Strategy for Increasing Drug Solubility and Efficacy through Covalent Attachment to Polyvalent DNA-Nanoparticle Conjugates. ACS Nano 2011, 5, 6962–6270. [DOI] [PMC free article] [PubMed] [Google Scholar]
- Gil P. R.; Parak W. J. Composite Nanoparticles Take Aim at Cancer. ACS Nano 2008, 2, 2200–2205. [DOI] [PubMed] [Google Scholar]
- Perrault S. D.; Chan W. C. In Vivo Assembly of Nanoparticle Components to Improve Targeted Cancer Imaging. Proc. Natl. Acad. Sci. U. S. A. 2010, 107, 11194–11199. [DOI] [PMC free article] [PubMed] [Google Scholar]
- Shin S. R.; Bae H.; Cha J. M.; Mun J. Y.; Chen Y. C.; Tekin H.; Shin H.; Farshchi S.; Dokmeci M. R.; Tang S.; et al. Carbon Nanotube Reinforced Hybrid Microgels as Scaffold Materials for Cell Encapsulation. ACS Nano 2012, 6, 362–372. [DOI] [PMC free article] [PubMed] [Google Scholar]
- Eltoukhy A. A.; Chen D.; Alabi C. A.; Langer R.; Anderson D. G. Degradable Terpolymers with Alkyl Side Chains Demonstrate Enhanced Gene Delivery Potency and Nanoparticle Stability. Adv. Mater. 2013, 25, 1487–1493. [DOI] [PMC free article] [PubMed] [Google Scholar]
- Chow E. K.-H.; Ho D. Cancer Nanomedicine: From Drug Delivery to Imaging. Sci. Transl. Med. 2013, 5, 216rv4. [DOI] [PubMed] [Google Scholar]
- Mochalin V. N.; Shenderova O.; Ho D.; Gogotsi Y. The Properties and Applications of Nanodiamonds. Nat. Nanotechnol. 2011, 7, 11–23. [DOI] [PubMed] [Google Scholar]
- Mochalin V.; Osswald S.; Gogotsi Y. Contribution of Functional Groups to the Raman Spectrum of Nanodiamond Powders. Chem. Mater. 2008, 21, 273–279. [Google Scholar]
- Gibson N. M.; Luo T. J.; Brenner D. W.; Shenderova O. Immobilization of Mycotoxins on Modified Nanodiamond Substrates. Biointerphases 2011, 6, 210–217. [DOI] [PubMed] [Google Scholar]
- Liu Z.; Robinson J. T.; Sun X.; Dai H. Pegylated Nanographene Oxide for Delivery of Water-Insoluble Cancer Drugs. J. Am. Chem. Soc. 2008, 130, 10876–10877. [DOI] [PMC free article] [PubMed] [Google Scholar]
- Gobin A. M.; Lee M. H.; Halas N. J.; James W. D.; Drezek R. A.; West J. L. Near-Infrared Resonant Nanoshells for Combined Optical Imaging and Photothermal Cancer Therapy. Nano Lett. 2007, 7, 1929–1934. [DOI] [PubMed] [Google Scholar]
- Chen M.; Pierstorff E. D.; Lam R.; Li S. Y.; Huang H.; Osawa E.; Ho D. Nanodiamond-Mediated Delivery of Water-Insoluble Therapeutics. ACS Nano 2009, 3, 2016–2022. [DOI] [PubMed] [Google Scholar]
- Kim H. J.; Zhang K.; Moore L.; Ho D. Diamond Nanogel-Embedded Contact Lenses Mediate Lysozyme-Dependent Therapeutic Release. ACS Nano 2014, 8, 2998–3005. [DOI] [PMC free article] [PubMed] [Google Scholar]
- Smith A. H.; Robinson E. M.; Zhang X. Q.; Chow E. K.; Lin Y.; Osawa E.; Xi J.; Ho D. Triggered Release of Therapeutic Antibodies from Nanodiamond Complexes. Nanoscale 2011, 3, 2844–2848. [DOI] [PMC free article] [PubMed] [Google Scholar]
- Manus L. M.; Mastarone D. J.; Waters E. A.; Zhang X. Q.; Schultz-Sikma E. A.; Macrenaris K. W.; Ho D.; Meade T. J. Gd(III)-Nanodiamond Conjugates for Mri Contrast Enhancement. Nano Lett. 2010, 10, 484–489. [DOI] [PMC free article] [PubMed] [Google Scholar]
- Shimkunas R. A.; Robinson E.; Lam R.; Lu S.; Xu X.; Zhang X. Q.; Huang H.; Osawa E.; Ho D. Nanodiamond-Insulin Complexes as pH-Dependent Protein Delivery Vehicles. Biomaterials 2009, 30, 5720–5728. [DOI] [PubMed] [Google Scholar]
- Huang H.; Pierstorff E.; Osawa E.; Ho D. Active Nanodiamond Hydrogels for Chemotherapeutic Delivery. Nano Lett. 2007, 7, 3305–3314. [DOI] [PubMed] [Google Scholar]
- Zhang X. Q.; Chen M.; Lam R.; Xu X.; Osawa E.; Ho D. Polymer-Functionalized Nanodiamond Platforms as Vehicles for Gene Delivery. ACS Nano 2009, 3, 2609–2616. [DOI] [PubMed] [Google Scholar]
- Simpson D. A.; Thompson A. J.; Kowarsky M.; Zeeshan N. F.; Barson M. S.; Hall L.; Yan Y.; Kaufmann S.; Johnson B. C.; Ohshima T. In Vivo Imaging and Tracking of Individual Nanodiamonds in Drosophila Melanogaster Embryos. Biomed. Opt. Express 2014, 20, 1250–1261. [DOI] [PMC free article] [PubMed] [Google Scholar]
- Sharpe M. A.; Marcano D. C.; Berlin J. M.; Widmayer M. A.; Baskin D. S.; Tour J. M. Antibody-Targeted Nanovectors for the Treatment of Brain Cancers. ACS Nano 2012, 6, 3114–3120. [DOI] [PubMed] [Google Scholar]
- Chao J.-I.; Perevedentseva E.; Chung P.-H.; Liu K.-K.; Cheng C.-Y.; Chang C.-C.; Cheng C.-L. Nanometer-Sized Diamond Particle as a Probe for Biolabeling. Biophys. J. 2007, 93, 2199–2208. [DOI] [PMC free article] [PubMed] [Google Scholar]
- O̅sawa E.; Ho D.; Huang H.; Korobov M. V.; Rozhkova N. N. Consequences of Strong and Diverse Electrostatic Potential Fields on the Surface of Detonation Nanodiamond Particles. Diamond Relat. Mater. 2009, 18, 904–909. [Google Scholar]
- Zhang X.; Hu W.; Li J.; Tao L.; Wei Y. A Comparative Study of Cellular Uptake and Cytotoxicity of Multi-Walled Carbon Nanotubes, Graphene Oxide, and Nanodiamond. Toxicol. Res. 2012, 62–68. [Google Scholar]
- Li H. C.; Hsieh F. J.; Chen C. P.; Chang M. Y.; Hsieh P. C.; Chen C. C.; Hung S. U.; Wu C. C.; Chang H. C. The Hemocompatibility of Oxidized Diamond Nanocrystals for Biomedical Applications. Sci. Rep. 2013, 3, 3044. [DOI] [PMC free article] [PubMed] [Google Scholar]
- Kuo Y.; Hsu T. Y.; Wu Y. C.; Chang H. C. Fluorescent Nanodiamond as a Probe for the Intercellular Transport of Proteins in Vivo. Biomaterials 2013, 34, 8352–8360. [DOI] [PubMed] [Google Scholar]
- Moore L.; Chow E. K.; Osawa E.; Bishop J. M.; Ho D. Diamond-Lipid Hybrids Enhance Chemotherapeutic Tolerance and Mediate Tumor Regression. Adv. Mater. 2013, 25, 3532–3541. [DOI] [PMC free article] [PubMed] [Google Scholar]
- Chow E. K.; Zhang X.-Q.; Chen M.; Lam R.; Robinson E.; Huang H.; Schaffer D.; Osawa E.; Goga A.; Ho D. Nanodiamond Therapeutic Delivery Agents Mediate Enhanced Chemoresistant Tumor Treatment. Sci. Transl. Med. 2011, 3, 73ra21. [DOI] [PubMed] [Google Scholar]
- Liu K.-K.; Zheng W.-W.; Wang C.-C.; Chiu Y.-C.; Cheng C.-L.; Lo Y.-S.; Chen C.; Chao J.-I. Covalent Linkage of Nanodiamond-Paclitaxel for Drug Delivery and Cancer Therapy. Nanotechnology 2010, 21, 315106. [DOI] [PubMed] [Google Scholar]
- Man H. B.; Kim H.; Kim H.-J.; Robinson E.; Liu W. K.; Chow E. K.-H.; Ho D. Synthesis of Nanodiamond–Daunorubicin Conjugates to Overcome Multidrug Chemoresistance in Leukemia. Nanomedicine 2013, 10, 359–369. [DOI] [PMC free article] [PubMed] [Google Scholar]
- Toh T. B.; Lee D.-K.; Hou W.; Abdullah L. N.; Nguyen J.; Ho D.; Chow E. Nanodiamond-Mitoxantrone Complexes Enhance Drug Retention in Chemoresistant Breast Cancer Cells. Mol. Pharmaceutics 2014, 10.1021/mp5001108. [DOI] [PMC free article] [PubMed] [Google Scholar]
- Chang Y.-R.; Lee H.-Y.; Chen K.; Chang C.-C.; Tsai D.-S.; Fu C.-C.; Lim T.-S.; Tzeng Y.-K.; Fang C.-Y.; Han C.-C. Mass Production and Dynamic Imaging of Fluorescent Nanodiamonds. Nat. Nanotechnol. 2008, 3, 284–288. [DOI] [PubMed] [Google Scholar]
- Storm G.; Belliot S. O.; Daemen T.; Lasic D. D. Surface Modification of Nanoparticles to Oppose Uptake by the Mononuclear Phagocyte System. Adv. Drug Delivery Rev. 1995, 17, 31–48. [Google Scholar]
- Alexis F.; Pridgen E.; Molnar L. K.; Farokhzad O. C. Factors Affecting the Clearance and Biodistribution of Polymeric Nanoparticles. Mol. Pharmaceutics 2008, 5, 505–515. [DOI] [PMC free article] [PubMed] [Google Scholar]
- Illum L.; Davis S.; Müller R.; Mak E.; West P. The Organ Distribution and Circulation Time of Intravenously Injected Colloidal Carriers Sterically Stabilized with a Blockcopolymer-Poloxamine 908. Life Sci. 1987, 40, 367–374. [DOI] [PubMed] [Google Scholar]
- Wang Y. M.; Sato H.; Adachi I.; Horikoshi I. Preparation and Characterization of Poly (Lactic-Co-Glycolic Acid) Microspheres for Targeted Delivery of a Novel Anticancer Agent, Taxol. Chem. Pharm. Bull. 1996, 44, 1935–1940. [DOI] [PubMed] [Google Scholar]
- Choi H. S.; Liu W.; Misra P.; Tanaka E.; Zimmer J. P.; Ipe B. I.; Bawendi M. G.; Frangioni J. V. Renal Clearance of Quantum Dots. Nat. Biotechnol. 2007, 25, 1165–1170. [DOI] [PMC free article] [PubMed] [Google Scholar]
- Tan J.; Butterfield D.; Voycheck C.; Caldwell K.; Li J. Surface Modification of Nanoparticles by Peo/Ppo Block Copolymers to Minimize Interactions with Blood Components and Prolong Blood Circulation in Rats. Biomaterials 1993, 14, 823–833. [DOI] [PubMed] [Google Scholar]
- Chang L. Y.; Osawa E.; Barnard A. S. Confirmation of the Electrostatic Self-Assembly of Nanodiamonds. Nanoscale 2011, 3, 958–962. [DOI] [PubMed] [Google Scholar]
- Allen T. M.; Cullis P. R. Drug Delivery Systems: Entering the Mainstream. Science 2004, 303, 1818–1822. [DOI] [PubMed] [Google Scholar]
- Ohkuma S.; Poole B. Fluorescence Probe Measurement of the Intralysosomal pH in Living Cells and the Perturbation of pH by Various Agents. Proc. Natl. Acad. Sci. U. S. A. 1978, 75, 3327–3331. [DOI] [PMC free article] [PubMed] [Google Scholar]
- Mellman I.; Fuchs R.; Helenius A. Acidification of the Endocytic and Exocytic Pathways. Annu. Rev. Biochem. 1986, 55, 663–700. [DOI] [PubMed] [Google Scholar]
- Wang H. D.; Niu C. H.; Yang Q.; Badea I. Study on Protein Conformation and Adsorption Behaviors in Nanodiamond Particle-Protein Complexes. Nanotechnology 2011, 22, 145703. [DOI] [PubMed] [Google Scholar]
- Coates A.; Abraham S.; Kaye S.; Sowerbutts T.; Frewin C.; Fox R.; Tattersall M. On the Receiving End—Patient Perception of the Side-Effects of Cancer Chemotherapy. Eur. J. Cancer Clin. Oncol. 1983, 19, 203–208. [DOI] [PubMed] [Google Scholar]
- Yeh T. C.; Zhang W.; Ildstad S. T.; Ho C. Intracellular Labeling of T-Cells with Superparamagnetic Contrast Agents. Magn. Reson. Med. 1993, 30, 617–625. [DOI] [PubMed] [Google Scholar]
- Gilleron J.; Querbes W.; Zeigerer A.; Borodovsky A.; Marsico G.; Schubert U.; Manygoats K.; Seifert S.; Andree C.; Stöter M. Image-Based Analysis of Lipid Nanoparticle-Mediated siRNA Delivery, Intracellular Trafficking and Endosomal Escape. Nat. Biotechnol. 2013, 31, 638–646. [DOI] [PubMed] [Google Scholar]
- Kaksonen M.; Toret C. P.; Drubin D. G. Harnessing Actin Dynamics for Clathrin-Mediated Endocytosis. Nat. Rev. Mol. Cell Biol. 2006, 7, 404–414. [DOI] [PubMed] [Google Scholar]
- Swanson J. A.; Watts C. Macropinocytosis. Trends Cell Biol. 1995, 5, 424–428. [DOI] [PubMed] [Google Scholar]
- Schnitzer J. E.; Oh P.; Pinney E.; Allard J. Filipin-Sensitive Caveolae-Mediated Transport in Endothelium: Reduced Transcytosis, Scavenger Endocytosis, and Capillary Permeability of Select Macromolecules. J. Cell Biol. 1994, 127, 1217–1232. [DOI] [PMC free article] [PubMed] [Google Scholar]
- Shachaf C. M.; Kopelman A. M.; Arvanitis C.; Karlsson Å.; Beer S.; Mandl S.; Bachmann M. H.; Borowsky A. D.; Ruebner B.; Cardiff R. D. Myc Inactivation Uncovers Pluripotent Differentiation and Tumour Dormancy in Hepatocellular Cancer. Nature 2004, 431, 1112–1117. [DOI] [PubMed] [Google Scholar]
- Goga A.; Yang D.; Tward A. D.; Morgan D. O.; Bishop J. M. Inhibition of Cdk1 as a Potential Therapy for Tumors over-Expressing Myc. Nat. Med. 2007, 13, 820–827. [DOI] [PubMed] [Google Scholar]
- Macia E.; Ehrlich M.; Massol R.; Boucrot E.; Brunner C.; Kirchhausen T. Dynasore, a Cell-Permeable Inhibitor of Dynamin. Dev. Cell 2006, 10, 839–850. [DOI] [PubMed] [Google Scholar]
- Anderson R. G.; Kamen B. A.; Rothberg K. G.; Lacey S. W. Potocytosis: Sequestration and Transport of Small Molecules by Caveolae. Science 1992, 255, 410–411. [DOI] [PubMed] [Google Scholar]
- Doherty G. J.; McMahon H. T. Mechanisms of Endocytosis. Annu. Rev. Biochem. 2009, 78, 857–902. [DOI] [PubMed] [Google Scholar]
- Racoosin E. L.; Swanson J. A. Macropinosome Maturation and Fusion with Tubular Lysosomes in Macrophages. J. Cell Biol. 1993, 121, 1011–1020. [DOI] [PMC free article] [PubMed] [Google Scholar]
- Ling Y.-H.; Priebe W.; Yang L.-Y.; Burke T. G.; Pommier Y.; Perez-Soler R. In Vitro Cytotoxicity, Cellular Pharmacology, and DNA Lesions Induced by Annamycin, an Anthracycline Derivative with High Affinity for Lipid Membranes. Cancer Res. 1993, 53, 1583–1589. [PubMed] [Google Scholar]
- Mochalin V. N.; Pentecost A.; Li X.-M.; Neitzel I.; Nelson M.; Wei C.; He T.; Guo F.; Gogotsi Y. Adsorption of Drugs on Nanodiamond: Toward Development of a Drug Delivery Platform. Mol. Pharmaceutics 2013, 10, 3728–3735. [DOI] [PubMed] [Google Scholar]
- Zhang X. Q.; Lam R.; Xu X.; Chow E. K.; Kim H. J.; Ho D. Multimodal Nanodiamond Drug Delivery Carriers for Selective Targeting, Imaging, and Enhanced Chemotherapeutic Efficacy. Adv. Mater. 2011, 23, 4770–4775. [DOI] [PubMed] [Google Scholar]
- Mo R.; Jiang T.; DiSanto R.; Tai W.; Gu Z. ATP-Triggered Anticancer Drug Delivery. Nat. Commun. 2014, 5, 3364. [DOI] [PubMed] [Google Scholar]
- Szotek P. P.; Pieretti-Vanmarcke R.; Masiakos P. T.; Dinulescu D. M.; Connolly D.; Foster R.; Dombkowski D.; Preffer F.; MacLaughlin D. T.; Donahoe P. K. Ovarian Cancer Side Population Defines Cells with Stem Cell-Like Characteristics and Mullerian Inhibiting Substance Responsiveness. Proc. Natl. Acad. Sci. U. S. A. 2006, 103, 11154–11159. [DOI] [PMC free article] [PubMed] [Google Scholar]
- Haraguchi N.; Inoue H.; Tanaka F.; Mimori K.; Utsunomiya T.; Sasaki A.; Mori M. Cancer Stem Cells in Human Gastrointestinal Cancers. Hum. Cell 2006, 19, 24–29. [DOI] [PubMed] [Google Scholar]
- O̅sawa E.; Ho D. Nanodiamond and Its Application to Drug Delivery. J. Med. Allied Sci. 2012, 2, 31–40. [Google Scholar]
- Northfelt D. W.; Dezube B. J.; Thommes J. A.; Miller B. J.; Fischl M. A.; Friedman-Kien A.; Kaplan L. D.; Du Mond C.; Mamelok R. D.; Henry D. H. Pegylated-Liposomal Doxorubicin versus Doxorubicin, Bleomycin, and Vincristine in the Treatment of Aids-Related Kaposi’s Sarcoma: Results of a Randomized Phase III Clinical Trial. J. Clin. Oncol. 1998, 16, 2445–2451. [DOI] [PubMed] [Google Scholar]
- O’brien M.; Wigler N.; Inbar M.; Rosso R.; Grischke E.; Santoro A.; Catane R.; Kieback D.; Tomczak P.; Ackland S. Reduced Cardiotoxicity and Comparable Efficacy in a Phase III Trial of Pegylated Liposomal Doxorubicin Hcl (Caelyx/Doxil®) versus Conventional Doxorubicin for First-Line Treatment of Metastatic Breast Cancer. Ann. Oncol. 2004, 15, 440–449. [DOI] [PubMed] [Google Scholar]
- Yant S. R.; Meuse L.; Chiu W.; Ivics Z.; Izsvak Z.; Kay M. A. Somatic Integration and Long-Term Transgene Expression in Normal and Haemophilic Mice Using a DNA Transposon System. Nat. Genet. 2000, 25, 35–41. [DOI] [PubMed] [Google Scholar]
Associated Data
This section collects any data citations, data availability statements, or supplementary materials included in this article.