

Abstract
Maple syrup has nutraceutical potential given the macronutrients (carbohydrates, primarily sucrose), micronutrients (minerals and vitamins), and phytochemicals (primarily phenolics) found in this natural sweetener. We conducted compositional (ash, fiber, carbohydrates, minerals, amino acids, organic acids, vitamins, phytochemicals), in vitro biological, and in vivo safety (animal toxicity) studies on maple syrup extracts (MSX-1 and MSX-2) derived from two declassified maple syrup samples. Along with macronutrient and micronutrient quantification, thirty-three phytochemicals were identified (by HPLC-DAD), and nine phytochemicals, including two new compounds, were isolated and identified (by NMR) from MSX. At doses of up to 1000 mg/kg/day, MSX was well tolerated with no signs of overt toxicity in rats. MSX showed antioxidant (2,2-diphenyl-1-picrylhydrazyl (DPPH) assay) and anti-inflammatory (in RAW 264.7 macrophages) effects and inhibited glucose consumption (by HepG2 cells) in vitro. Thus, MSX should be further investigated for potential nutraceutical applications given its similarity in chemical composition to pure maple syrup.
Keywords: maple syrup, extract, nutraceutical, phytochemicals, biological, safety
1. Introduction
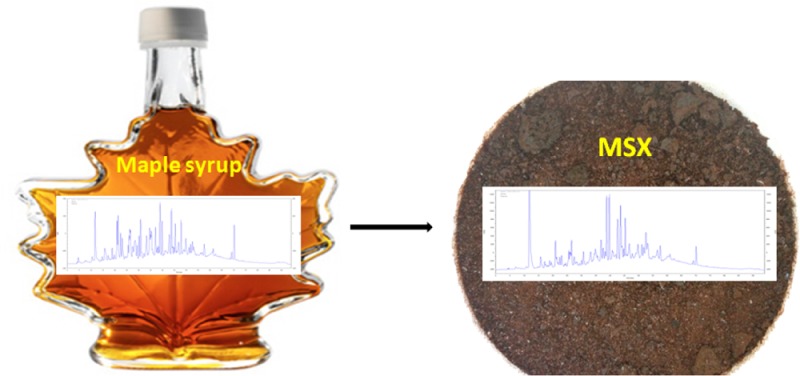
Maple syrup is a natural sweetener produced by boiling sap collected from the sugar maple (Acer saccharum L.) tree and certain other maple species.1 The large-scale commercial production of maple syrup occurs primarily in eastern North America, in Canada and the United States, with the province of Quebec (in Canada) responsible for the majority of the world’s supply (ca. 80%). Maple syrup has different grades based on light transmittance (e.g., five grades in Canada are no. 1 extra light, no. 1 light, no. 1 medium, no. 2 amber, and no. 3 dark) and meets strict food quality standards that are regulated by state, provincial, and/or federal agencies in Canada and the United States. The maple syrup industry is of significant economic importance to this region of the world, with millions of gallons of syrup produced every year with price ranging from ca. $40.59 per gallon in 2013 in Canada alone (data available from Statistics Canada, Table 001-0008: Production and farm value of maple products annually). During the production of maple syrup, declassified maple syrup samples are generated which are economical raw materials for the generation of extracts with functional food and nutraceutical applications. However, to date, there have been no chemical compositional, biological, and safety studies conducted on food-grade extracts derived from maple syrup.
Maple syrup is a widely consumed food product, and its macronutrient and micronutrient constituents are well established. The major carbohydrate found in maple syrup is sucrose (range of ca. 60–66%) along with lesser amounts of glucose and fructose and complex carbohydrates, including high molecular weight polysaccharides.2 Maple syrup also contains minerals (K, Ca, Mg, Na, Mn, Al, Zn, Fe, etc.), vitamins (riboflavin, niacin, thiamine, etc.), amino acids (arginine, threonine, proline, etc.), organic acids (fumaric acid, malic acid, etc.), and phytohormones (abscisic acid and phaseic acid and their metabolites).1,3 A wide range of phytochemicals, most of which are phenolics (belonging to lignan, phenolic acid, stilbene, coumarin, and flavonoid subclasses) have also been identified in maple syrup.4−9 Apart from these chemical compositional studies on maple syrup, both in vitro and in vivo biological studies have been reported on this natural sweetener. For instance, animal studies suggest that pure maple syrup may have liver-protective effects10 and the ability to reduce plasma glucose levels compared to a sucrose solution alone.11 In addition, in vitro biological studies of phenolic-enriched maple syrup extracts suggest potential anticancer, antioxidant, α-glucosidase enzyme inhibitory, and anti-inflammatory effects.12−14 Therefore, the chemical composition and biological effects attributed to this natural sweetener warrant further investigation into its derived extracts for functional food ingredient and nutraceutical applications.
Our laboratory has been involved in the isolation and structure elucidation (by NMR) of phytochemicals from maple food products (sap and syrup)4−7 and also from maple plant parts.15−18 This overall program of study has resulted in the isolation and structure elucidation of more than 100 phytochemicals from maple. Given our laboratory’s extensive experience with maple phytochemicals, and our unique access to these chemical standards, we have established HPLC-DAD methods to identify compounds (on the basis of comparison of retention times and UV spectra) in a wide variety of maple materials. Also, our laboratory has established standard operating protocols for the detection and quantification of carbohydrates (sucrose, glucose, fructose, and complex carbohydrates), minerals (K, Ca, Mg, Na, Mn, Al, Zn, Fe, etc.), amino acids (arginine, threonine, proline, etc.), vitamins (riboflavin, niacin, thiamine, etc.), and organic acids (fumaric acid, malic acid, etc.) in maple materials.7 Therefore, given our ongoing research interest in maple products, the primary objective of this project was to investigate the nutraceutical potential of a novel maple syrup derived extract (named MSX) produced under food-grade conditions starting from declassified maple syrup generated by the industry. Here we report (1) chemical compositional (quantification of sugars, minerals, amino acids, organic acids, vitamins, fiber, and ash), (2) phytochemical identification (by HPLC-DAD methods as well as by isolation and subsequent structure elucidation by NMR), (3) in vitro biological (antioxidant, anti-inflammatory, and glucose consumption bioassays), and (4) in vivo safety (acute animal toxicity) studies on MSX. This is the first chemical and biological study of a food-grade extract derived from maple syrup.
2. Materials and Methods
2.1. General Experimental Procedures
All 1D nuclear magnetic resonance (1H and 13C NMR) and 2D NMR [1H–1H correlation spectroscopy (COSY), heteronuclear single-quantum coherence (HSQC), heteronuclear multiple-bond coherence (HMBC)] experiments were acquired either on a Bruker 300 MHz or a Varian 500 MHz instrument. Unless otherwise stated, deuterated methanol (CD3OD) was used as the solvent for all of the NMR experiments. HR-ESIMS data were acquired using a Waters SYNAPT G2-S QTOFMS system. High-performance liquid chromatography (HPLC) was performed on a Hitachi Elite LaChrom system (Pleasanton, CA) consisting of an L-2130 pump, L-2200 autosampler with L-2455 diode array detector (DAD), and L-2490 refractive index (RI) and L-2485 fluorescence (FL) detectors, all operated by EZChrom Elite software. Medium-pressure liquid chromatography (MPLC) was carried out on prepacked C18 columns. Optical rotation was performed on an AutoPol III automatic polarimeter (Rudolph Research, Flanders, NJ) with samples dissolved in methanol at room temperature. CD spectra were recorded on a JASCO J-810 spectropolarimeter.
2.2. Chemicals and Reagents
All solvents were either ACS or HPLC grade and were obtained from Pharmco-AAPER through Wilkem Scientific (Pawcatuck, RI). Sephadex LH-20, XAD-16 Amberlite resin, 2,2-diphenyl-1-picrylhydrazyl (DPPH), the Folin–Ciocalteau reagent, and all of the cell culture supplies were purchased from Sigma-Aldrich (St. Louis, MO). Standards of compounds used to aid in the phytochemical characterization of MSX were previously isolated and identified (by NMR) from maple syrup and maple sap by our laboratory.4−7
2.3. Production of MSX
In collaboration with the Federation of Maple Syrup Producers of Quebec (FPAQ), our laboratory has previously investigated the chemical constituents present in maple sap and syrup4−7 and maple plant parts,15−18 which has resulted in the isolation and identification (by NMR) of more than 100 compounds. Maple syrup is classified into different grades (light to dark) on the basis of light transmission. Notably, maple syrup with light transmission of <26.9% is classified as no. 3 dark (Canadian classification), and these products are not used for normal table consumption but rather as commercial ingredients. For the current project, we used two “declassified” grades of maple syrup samples named T15 and T21 (provided by FPAQ; T15 and T21 represent the degree of light transmission) which are also not suitable for normal table maple syrup consumption. With the ultimate goal of developing a food-grade maple syrup extract that would be suitable for human consumption, we initially developed laboratory-scale methods using an FDA food-grade approved resin, Amberlite XAD-16, and food-grade solvents (water and denatured ethanol) according to previously published methods.19 Briefly, each of the maple syrup (T15 and T21) starting materials were separately adsorbed onto the XAD-16 resin column and eluted with copious amounts of water to predominantly remove sugars. The adsorbed extract was subsequently eluted from the resin with denatured ethanol to yield MSX-1 (from T15) and MSX-2 (from T21) as dark brown free-flowing powders after solvent removal in vacuo. This small-scale laboratory method was then scaled-up to the pilot level (by SiliCycle Inc., Quebec City, Canada) using a glass column (height 6 feet, diameter 6 in.) filled with XAD-16 resin (ca. 6.7 kg of dry mass). The resin column was prewashed with deionized water (2 × 10 L) and then loaded with a 5 L portion of the declassified maple syrup sample diluted with 2.1 L of deionized water. Once the mixture was adsorbed, a second 5 L portion of the maple syrup sample (in 2.1 L of deionized water) was adsorbed onto the resin column, and sugars were eluted from the column with six consecutive 15 L portions of deionized water. Afterward, the adsorbed extract was eluted with three consecutive 15 L portions of denatured ethanol. The combined ethanol fractions were dried in vacuo on a rotary evaporator (temperature of the water bath <40 °C) to afford dark brown free-flowing solids of the MSX samples with yields of ca. 1.53–1.55 g/kg of the respective starting maple syrup sample. The XAD-16 resin column was then reconditioned with two 10 L portions of deionized water, and the process was repeated with fresh declassified maple syrup samples to yield additional samples of MSX-1 and MSX-2, ca. 300 g each. A portion of each of the MSX-1 and MSX-2 samples (ca. 100 g each) was shipped frozen to our laboratory and immediately stored at −20 °C on receipt.
2.4. Identification of Compounds 1–33 (by HPLC-DAD) in MSX
We have established HPLC-DAD methods to identify compounds (on the basis of comparison of retention times and UV spectra) in a variety of maple-derived materials using authentic standards previously isolated from maple sap and maple syrup by our group.4−7 Therefore, on the basis of comparison of the HPLC-DAD profiles to that of pure maple syrup (chromatogram shown in Figure 2A), we were able to identify 33 compounds (1–33; compound identities shown in Table 1 and chemical structures shown in Figure 1) in phenolic-enriched extracts of each of the MSX samples (see Figure 2B,C). To accomplish this, phenolic-enriched extracts of the MSX samples (1.5 g each) were prepared as previously reported for pure maple syrup by liquid–liquid partitioning with ethyl acetate (40 mL × 3).5,7 The combined ethyl acetate extracts were dried under reduced pressure in vacuo (water bath kept at 40 °C), and accurate masses were obtained as follows: 282 mg (for MSX-1) and 310 mg (for MSX-2). All samples were dissolved in dimethyl sulfoxide (DMSO), standardized to solid content (50 mg/mL), and then subjected to HPLC-DAD analyses using an Alltima C18 column (250 × 4.6 mm i.d., 5 μM; Alltech) with a flow rate of 0.75 mL/min and an injection volume of 20 μL. A linear gradient solvent system consisting of solvent A (0.1% aqueous trifluoroacetic acid) and solvent B (methanol) at room temperature was used as follows: 0–30 min, from 5% to 33.4% B; 30–80 min, from 33.4% to 71% B; 80–85 min, from 71% to 100% B; 85–86 min, from 100% to 5% B; 86–94 min, 5% B.
Figure 2.

HPLC-DAD chromatograms of maple syrup (A), MSX-1 (B), and MSX-2 (C) at a detection wavelength of 280 nm. Peaks labeled 1–9 and 11–33 were identified by comparison to phenolic standards previously isolated from maple syrup.4−6 Peak 10 was identified by comparison to phenolic standard previously isolated from maple sap.7 Peaks S1–S9 were isolated and identified (by NMR) from MSX for the first time. The names of the compounds are listed in Table 1, and their chemical structures are shown in Figure 1
Table 1. Compounds Identified in MSX and Their UV Absorbance.
| peak | compd | UV (nm) |
|---|---|---|
| S1 | (6R)-6-hydroxy-3-(hydroxymethyl)-2-cyclohexenone | 238 |
| S2 | 3,4-dihydro-5-(hydroxymethyl)pyran-2-one | 228, 284 |
| S3 | 4,4′-dihydroxy-3,3′,5,5′-tetramethoxystilbene | 222, 331 |
| S4 | 4,4′-dihydroxy-3,3′,5′-trimethoxystilbene | 222, 331 |
| S5 | 4-hydroxy-2-(hydroxymethyl)-5-methyl-3(2H)- furanone | 271 |
| S6 | benzenemethanol | 229, 284 |
| S7 | 5-(hydroxymethyl)furfural | 229, 284 |
| S8 | 4-methyl-1,2-venzenediol | 210, 288 |
| S9 | 4-(hydroxymethyl)-1,2-benzenediol | 228, 276, 308 |
| 1 | 2-hydroxy-3,4-dihydroxyacetophenone | 229, 276, 307 |
| 2 | catechol | 210, 276 |
| 3 | C-veratroylglycol | 231, 280, 310 |
| 4 | threo,threo-1-[4-(2-hydroxy-2-(4-hydroxy-3-methoxyphenyl)-1-(hydroxymethyl)ethoxy)-3-methoxyphenyl]-1,2,3-propanetriol | 230, 279 |
| 5 | 2,3-dihydroxy-1-(4-hydroxy-3,5-dimethoxyphenyl)-1-propanone | 216, 306 |
| 6 | 4-acetylcatechol | 231, 280, 312 |
| 7 | tyrosol | 231, 280, 312 |
| 8 | catechaldehyde | 231, 280, 312 |
| 9 | 1,2-diguaiacyl-1,3-propanediol | 210, 226(s),a 280 |
| 10 | 3′,5′-dimethoxy-4′-hydroxy-2-hydroxyacetophenone | 228, 300 |
| 11 | leptolepisol D | 210, 229(s),a 280 |
| 12 | 3,4-dihydroxy-2-methylbenzadehyde | 233, 285 |
| 13 | vanillin | 229, 280, 309 |
| 14 | fraxetin | 229, 338 |
| 15 | syringaldehyde | 216, 307 |
| 16 | syringenin | 224, 273 |
| 17 | scopoletin | 229, 345 |
| 18 | threo-guaiacylglycerol-β-O-4′-dihydroconiferyl alcohol | 228, 279 |
| 19 | erythro-guaiacylglycerol-β-O-4′-dihydroconiferyl alcohol | 229, 279 |
| 20 | 3-[[4-[(6-deoxy-α-l-mannopyranosyl)oxy]-3-methoxyphenyl]methyl]-5-(3,4-dimethoxyphenyl)dihydro-3-hydroxy-4-(hydroxymethyl)-2(3H)-furanone | 231, 278 |
| 21 | 5-(3″,4″-dimethoxyphenyl)-3-hydroxy-3-(4′-hydroxy-3′-methoxybenzyl)-4-(hydroxymethyl)dihydrofuran-2-one | 232, 280 |
| 22 | 1-(2,3,4-trihydroxy-5-methylphenyl)ethanone | 230, 295 |
| 23 | erythro-1-(4-hydroxy-3-methoxyphenyl)-2-[4-(3-hydroxypropyl)-2,6-dimethoxyphenoxy]-1,3-propanediol | 228, 279 |
| 24 | icariside E4 | 225, 280 |
| 25 | 3′,4′,5′-trihydroxyacetophenone | 231, 284 |
| 26 | dehydroconiferyl alcohol | 211, 230(s),a 282 |
| 27 | sakuraresinol | 210, 236(s),a 280 |
| 28 | secoisolariciresinol | 231, 281 |
| 29 | acernikol | 210, 231, 280 |
| 30 | (1S,2R)-2-[2,6-dimethoxy-4-[(1S,3aR,4S,6aR)-tetrahydro-4-(4-hydroxy- 3,5-dimethoxyphenyl)-1H,3H-furo[3,4-c]furan-1-yl]phenoxy]-1-(4-hydroxy-3-methoxyphenyl)-1,3-propanediol | 210, 232(s),a 280 |
| 31 | buddlenol E | 210, 229(s),a 280 |
| 32 | 2-[4-[2,3-dihydro-3-(hydroxymethyl)-5-(3-hydroxypropyl)-7-methoxy-2-benzofuranyl]-2,6-dimethoxyphenoxy]-1-(4-hydroxy-3-methoxyphenyl)-1,3-propanediol | 211, 232(s),a 281 |
| 33 | (E)-3,3′-dimethoxy-4,4′-dihydroxystilbene | 222, 331 |
“s” indicates a shoulder peak.
Figure 1.

Chemical structures of compounds identified in MSX samples.
2.5. Isolation and Identification (by NMR) of Compounds S1–S9 from MSX
We pursued the isolation and structure elucidation (by NMR) of nine compounds (S1–S9; see Table 2) from the MSX samples which, despite their presence in pure maple syrup as evident from the HPLC-DAD profile (see Figure 2), were not obtained from our previous isolation studies.4−6 Given the similarities in the HPLC-DAD profiles of the MSX-1 and MSX-2 samples (see parts B and C, respectively, of Figure 2), we sought to increase the quantity of initial starting material for our planned isolation studies by combining the MSX samples (1:1, w/w; total of 140.0 g). The combined MSX sample was subjected to liquid–liquid partitioning with ethyl acetate (700 mL × 3) to yield a dried MSX ethyl acetate extract (MSX–EtOAc; 29.0 g) after solvent removal in vacuo. The MSX–EtOAc (29.0 g) extract was subjected to C18 MPLC eluting with a gradient system of MeOH/H2O (5:95 to 100:0, v/v) to afford eight major fractions (A1–A8). Fraction A1 (1.2 g) was chromatographed over a Sephadex LH-20 column (4 × 65 cm) with MeOH/H2O (1:1, v/v) and was further purified by reversed-phase semipreparative HPLC with MeOH/0.1% TFA in water (0.8:99.2, v/v) to afford compound S1 (9.2 mg, tR = 19.5 min). Fraction A2 (1.5 g) was chromatographed over a Sephadex LH-20 column (4 × 65 cm) with MeOH/H2O (1:1, v/v) and was further purified by reversed-phase semipreparative HPLC with MeOH/0.1% TFA in water (4:96, v/v) to afford compounds S2 (2 mg, tR = 29.8 min) and S5 (10.1 mg, tR = 19.4 min) and then with MeOH/0.1% TFA in water (2.6:97.4, v/v) to afford compound S7 (9.8 mg, tR = 37.1 min). Fraction A3 (0.5 g) was chromatographed over a Sephadex LH-20 column (4 × 65 cm) with MeOH/H2O (1:1, v/v) and was then further purified by reversed-phase semipreparative HPLC with MeOH/0.1% TFA in water (10:90, v/v) to afford compounds S6 (4 mg, tR = 43.0 min) and S8 (3.8 mg, tR = 26.8 min) and with MeOH/0.1% TFA in water (5:95, v/v) to afford compound S9 (5.1 mg, tR = 34.7 min). Similarly, fraction A7 (0.9 g) was chromatographed over a Sephadex LH-20 column (4 × 65 cm) with MeOH/H2O (1:1, v/v) and was then further purified by reversed-phase semipreparative HPLC with MeOH/0.1% TFA in water (41:59, v/v) to afford compounds S3 (3 mg, tR = 75.3 min) and S4 (12.6 mg, tR = 80.2 min).
Table 2. Compounds S1–S9 Isolated from MSX and Identified by NMR.
| compd | identity | ref for NMR data |
|---|---|---|
| S1 | (6R)-6-hydroxy-3-(hydroxymethyl)-2-cyclohexenone | |
| S2 | 3,4-dihydro-5-(hydroxymethyl)pyran-2-one | |
| S3 | 4,4′-dihydroxy-3,3′,5,5′-tetramethoxystilbene | (20) |
| S4 | 4,4′-dihydroxy-3,3′,5′-trimethoxystilbene | (20) |
| S5 | 4-hydroxy-2-(hydroxymethyl)-5-methyl-3(2H)-furanone | (21) |
| S6 | benzenemethanol | (22) |
| S7 | 5-(hydroxymethyl)furfural | (23) |
| S8 | 4-methyl-1,2-benzenediol | (24) |
| S9 | 4-(hydroxymethyl)-1,2-benzenediol | (25) |
2.5.1. Data for (6R)-6-hydroxy-3-(hydroxymethyl)-2-cyclohexenone (S1):
yellow oil; [α]D20 +27.8 (c 0.9, MeOH); CD (MeOH) 232 (Δε −4.62), 247 (Δε −10.49), 323 (Δε −0.39) nm; HR-ESIMS m/z 141.0557 [M – H]− (calcd for C7H9O3, 141.0552); 1H and 13C NMR data shown in Table 3.
Table 3. 1H NMR and 13C NMR Data for Compounds S1 and S2a.
|
S1 |
S2 |
|||
|---|---|---|---|---|
| position | δC | δH | δC | δH |
| 1 | 200.3 | |||
| 2 | 120.0 | 6.00 s | 176.5 | |
| 3 | 167.0 | 21.7 | 2.53 m | |
| 4 | 25.1 | 2.32 m | 21.7 | 2.53 m |
| 5 | 31.0 | 1.78 m | 133.1 | |
| 2.19 m | ||||
| 6 | 72.3 | 4.05 m | 148.3 | 7.33 s |
| 7 | 63.3 | 4.07 br s | 72.1 | 4.76 s |
1H NMR (500 MHz) and 13C NMR (125 MHz) for S1; 1H NMR (300 MHz) and 13C NMR (75 MHz) for S2.
2.5.2. Data for 3,4-dihydro-5-(hydroxymethyl)pyran-2-one (S2):
white amorphous powder; HR-ESIMS m/z 127.0396 [M – H]− (calcd for C6H7O3, 127.0395); 1H and 13C NMR data shown in Table 3.
2.5.3. Data for 4,4′-dihydroxy-3,3′,5,5′-tetramethoxystilbene (S3):
purple amorphous powder; (+)ESIMS m/z 355.1076 [M + Na]+, calcd for molecular formula C18H20O6; 1H NMR (300 MHz, CD3OD) δ 3.83 (12H, s, 3,3′,5,5′-OCH3), 6.76 (4H, s, H-2,2′,4,4′), 6.88 (2H, s, H-7,7′). The NMR data are consistent with those in the previous literature report.20
2.5.4. Data for 4,4′-dihydroxy-3,3′,5-trimethoxystilbene (S4):
yellow amorphous powder; (+)ESIMS m/z 325.0977 [M + Na]+, calcd for molecular formula C17H18O5; 1H NMR (300 MHz, CD3OD) δ 3.81 (6H, s, 3,5-OCH3), 3.83 (3H, s, 3′-OCH3), 6.71 (1H, d, J = 8.0 Hz, H-5′), 6.74 (2H, s, H-2,6), 6.86 (2H, s, H-7,7′), 6.91 (1H, d, J = 8.0 Hz, H-6′), 7.05 (1H, s, H-2′). The NMR data are consistent with those in the previous literature report.20
2.5.5. Data for 4-hydroxy-2-(hydroxymethyl)-5-methyl-3(2H)-furanone (S5):
yellow oil; (+)ESIMS m/z 167.0240 [M + Na]+, calcd for molecular formula C6H8O4; 1H NMR (300 MHz, CD3OD) δ 3.97 (1H, dd, J = 10.5 Hz, H-2), 4.03 (1H, dd, J = 10.5 Hz, J = 4.3 Hz, −CH2), 4.18 (1H, dd, J = 10.5 Hz, J = 4.3 Hz, −CH2), 1.89 (3H, s, −CH3); 13C NMR (300 MHz, CD3OD) δ 15.5 (C-6), 68.9 (C-7), 72.5 (C-2), 132.6 (C-5), 161.1 (C-4), 189.1 (C-3). The NMR data are consistent with those in the previous literature report.21
2.5.6. Data for benzenemethanol (S6):
colorless oil; (+)ESIMS m/z 131.0392 [M + Na]+, calcd for molecular formula C7H8O; 1H NMR (300 MHz, CDCl3) δ 7.36 (2H, d, J = 7.5 Hz, H-2,6), 7.31 (3H, m, H-3,4,5), 4.67 (2H, s, H-7). The NMR data are consistent with those in the previous literature report.22
2.5.7. Data for 5-(hydroxymethyl)-2-furaldehyde, also known as 5-(hydroxymethyl)furfural (HMF; S7):
yellow oil; (+)ESIMS m/z 149.0132 [M + Na]+, calcd for molecular formula C6H6O3; 1H NMR (300 MHz, CD3OD) δ 9.48 (1H, s, −CHO), 7.33 (1H, d, J = 3.5 Hz, H-3), 6.53 (1H, d, J = 3.5 Hz, H-4), 4.56 (2H, s, −CH2). The NMR data are consistent with those in the previous literature report.23
2.5.8. Data for 4-methyl-1,2-benzenediol (S8):
colorless amorphous powder; (+)ESIMS m/z 147.0342 [M + Na]+, calcd for molecular formula C7H8O2; 1H NMR (300 MHz, CD3OD) δ 6.52 (1H, d, J = 8.4 Hz, H-5), 6.47 (1H, s, H-3), 6.39 (1H, d, J = 8.4 Hz, H-6), 2.06 (3H, s, −CH3). The NMR data are consistent with those in the previous literature report.24
2.5.9. Data for 4-(hydroxymethyl)-1,2-benzenediol (S9):
colorless amorphous powder; (+)ESIMS m/z 163.0290 [M + Na]+, calcd for molecular formula C7H8O3; 1H NMR (300 MHz, CD3OD) δ 7.33 (1H, s, H-3), 7.33 (1H, d, J = 8.1 Hz, H-6), 6.79 (1H, d, J = 8.1 Hz, H-5), 4.73 (2H, s, −CH2). The NMR data are consistent with those of the previous literature report.25
2.6. Quantification of Compounds S5 and S7 in MSX Samples
Because compounds S5 and S7 appeared as major compounds in the MSX-2 sample (HPLC-DAD chromatogram shown in Figure 2C), the levels of these compounds were quantified in both MSX samples. HPLC-DAD analyses were conducted using an Alltima C18 column (250 × 4.6 mm i.d., 5 μM; Alltech) with a flow rate of 0.75 mL/min and an injection volume of 20 μL. A linear gradient solvent system consisting of solvent A (0.1% TFA in water) and solvent B (methanol) at room temperature was used as follows: 0–19 min, from 5% to 23% B; 20–21 min, from 23% to 100% B; 22–23 min, from 100% to 5% B; 23–41 min, 5% B. For quantification purposes, calibration curves were constructed for each of the pure compounds, S5 and S7, as follows: S5 [y = (4 × 10⁸)x + 102305 with r2 = 1]; S7 [y = (4 × 10⁸)x + 3 × 10⁶ with r2 = 0.9974].
2.7. Quantification of the Total Phenolic Content of MSX Samples
The MSX samples were quantified for total phenolic content using the Folin–Ciocalteau method on the basis of gallic acid equivalents (GAEs) as previously reported.26 Briefly, each MSX sample (3.1 mg) was dissolved in 10 mL of methanol/H2O (1:1, v/v), and 200 μL of each sample was incubated with 3 mL of methanol/H2O (1:1, v/v) and 200 μL of Folin–Ciocalteau reagent for 10 min at 25 °C. After this, 600 μL of a 20% sodium carbonate (Na2CO3) solution was added to each tube and the resulting solution vortexed. The tubes were then further incubated for an additional 20 min at 40 °C and then immediately cooled in an ice bath to room temperature. The samples and standard (gallic acid) were processed identically. The absorbance was determined at 755 nm, and the final results were calculated from the standard curve obtained from a Spectramax plate reader (Molecular Devices, Sunnyvale, CA).
2.8. Antioxidant Activity of MSX Samples
The antioxidant potentials of the MSX samples were determined by the DPPH free radical scavenging assay as previously reported.27 The assay was conducted in a 96-well format using serial dilutions of 100 μL aliquots of test samples (ranging from 26 to 2500 μg/mL), and then DPPH (150 μL) was added to each well to yield a final DPPH concentration of 137 μM. The absorbance was determined after 30 min at 515 nm, and the scavenging capacity (SC) was calculated as SC (%) = [(A0 – A1/A0)] × 100, where A0 is the absorbance of the reagent blank and A1 is the absorbance of the test samples. The control contained all reagents except the compounds, and all tests were performed in triplicate. IC50 values denote the concentration (μg/mL) of sample required to scavenge 50% of the DPPH free radicals (Table 4).
Table 4. Total Phenolic Contents of MSX Samples and Their DPPH Free Radical Scavenging Activities.
| sample | total phenolic content of MSXa (mg/100 g of gallic acid equivalents) | total phenolic content of MSX–EtOAc (mg/100 g of gallic acid equivalents) | DPPH free radical scavenging activity of MSXa,b (IC50, μg/mL) |
|---|---|---|---|
| MSX-1 | 16648.15 | 26278.28 | 97.6 ± 4.73 |
| MSX-2 | 16337.83 | 27441.33 | 102.4 ± 7.25 |
Assay conducted with neat samples of original MSX samples.
Positive controls, ascorbic acid and BHT, have IC50 values of 40 and 3000 μM, respectively.5
2.9. Cell Culture
The RAW 264.7 mouse macrophage cells (ATCC, Manassas, VA) were cultured in Dulbecco’s modified Eagle’s medium (DMEM) supplemented with 10% fetal bovine serum (FBS), penicillin G (100 U/mL), and streptomycin (100 μg/mL) (Sigma-Aldrich) and maintained at 37 °C in 5% CO2 humidified air. Lipopolysaccharide (LPS) was purchased from Sigma-Aldrich. The cultured human hepatoma HepG2 cell line (ATCC) was grown in DMEM (Lonza, Allendale, NJ) containing normal glucose (4.5 mmoL/L d-glucose) supplemented with 10% FBS, 100 units/mL penicillin, and 100 μg/mL streptomycin. Cells were incubated in a humidified atmosphere of 5% CO2 at 37 °C.
2.10. Assay for Nitrite Concentration
The nitrite concentration assay was conducted according to methods previously described by our group for an ethyl acetate extract of pure maple syrup (MS–EtOAc).14 Briefly, RAW 264.7 macrophages were seeded (1 × 10⁵ cells/100 μL) in 96-well plates. After 24 h of incubation, the RAW 264.7 cells were stimulated with 100 ng/mL LPS followed by treatment with ethyl acetate extracts of the MSX samples (50 and 100 μg/mL solubilized in DMSO) for 24 h. The final DMSO concentration in the cell culture medium was <0.1%. After 24 h of incubation, cell culture supernatants were collected for nitrite (NO) and prostaglandin E2 (PGE2) measurements (further described below). Cell culture supernatants were incubated with an equal volume of modified Griess reagent (Sigma-Aldrich) for 20 min at room temperature. The optical densities were measured at 540 nm, and the nitrite levels were determined by comparison to a standard curve. The assay was performed using three individual wells for each sample.
2.11. Assay for PGE2 Release
PGE2 was determined using the above cell supernatants as previously described.14 Briefly, PGE2 levels were measured using an enzyme immunosorbent (EIA) kit (Cayman Chemical, Ann Arbor, MI) according to the manufacturer’s protocol. The experiment was performed with three individual samples per treatment.
2.12. Glucose Assay
The glucose assay was performed as described previously28 with some modifications. Briefly, HepG2 cells were cultured in complete medium with 10% FBS to ∼80% cell confluence in 96-well plates and subjected to the assays. After the cells were confluent, the medium was replaced with medium containing 1% FBS and low glucose (1 mmol/L). After overnight incubation, the cells were treated with the MSX samples dissolved in DMSO (each at 50 and 100 μg/mL concentrations) for 7 h. The cell supernatants were assayed for glucose concentration using a glucose assay kit (Eton Bioscience Inc., Charlestown, MA). The absorbance was measured at 490 nm. The experiment was performed in triplicate.
2.13. Amino Acid Contents of MSX Samples by HPLC-FL
The amino acid contents of the MSX samples were determined by using the AccQ Tag amino acid analysis assay from Waters Corp. (Milford, MA) as previously reported.7 Briefly, this assay uses the Waters AccQ Fluor reagent to derivatize amino acids which are subsequently separated by reverse-phase HPLC and quantitated by fluorescence detection (FL) using a Waters AccQ Tag column. Peaks were identified by comparison of their retention times to amino acid reference standards.
2.14. Organic Acid Contents of MSX Samples by HPLC-DAD
The organic acid contents of the MSX samples were determined by HPLC-DAD analyses using an Allure organic acid column (150 × 4.6 mm) purchased from Restek Corp. (Bellefonte, PA) as reported.7 Peaks were identified on the basis of comparison of their retention times to those of organic acid standards. Each sample was injected in triplicate.
2.15. Vitamin Contents of MSX Samples by HPLC-DAD
The vitamin contents of the MSX samples were determined by HPLC-DAD analyses using a Luna 5 μm C18 column (250 × 4.6 mm) purchased from Phenomenex (Torrance, CA) with a flow rate of 1.0 mL/min and column temperature of 25 °C. A linear gradient solvent system consisting of solvent A (0.1% TFA in water) and solvent B (acetonitrile) was used as follows: 0–5 min, 0% B; 5–11 min, from 0% to 25% B; 11–17 min, from 25% to 40% B; 17–18 min, from 40% to 60% B; 18–20 min, from 60% to 0% B; 20–28 min, 0% B. For quantification purposes, calibration curves were constructed for each vitamin standard as follows: riboflavin (B2) [y = 143176x + 8066.6 with r2 = 0.9981]; niacin (B3) [y = 56212x – 813.11 with r2 = 0.9975]. Aliquots of each MSX sample (a 10-fold dilution of a stock solution of 100 mg/mL) were centrifuged at 10 000 rpm for 5 min, and then the supernatant (30 μL aliquots) was injected directly for HPLC-DAD analyses. Peaks were identified on the basis of comparison of their retention times to those of vitamin standards. Each sample was injected in triplicate.
2.16. Sugar Contents of MSX Samples by HPLC-RI
The sugar contents of the MSX samples were determined by HPLC-RI analyses using a Waters Sugar-Pak I column (300 × 6.5 mm, 10 μm) purchased from Waters Corp. according to methods previously reported.7 The isocratic solvent system consisted of ethylenediaminetetraacetic acid calcium disodium salt (EDTA; 50 mg/L) over 15 min. The standard for the complex sugars (6.0 mg) eluted before sucrose and was isolated as a single peak after repeated injections of pure maple syrup using the same HPLC conditions as previously reported7 except that pure deionized (DI) water was substituted for EDTA. For quantification purposes, calibration curves were constructed for each sugar standard (dissolved in DI water) as follows: sucrose [y = 527830x + 312928 with r2 = 0.9999]; glucose [y = 572734x + 1703 with r2 = 1]; fructose [y = 545540x + 5351.5 with r2 = 1]; complex sugars [y = 511030x + 93196 with r2 = 1]. Peaks were identified on the basis of comparison of their retention times to that of each of the standards. Each sample was injected in triplicate.
2.17. Mineral Contents of MSX Samples by Inductively Coupled Plasma Mass Spectrometry (ICP-MS)
The analyses of the mineral contents of the MSX samples were conducted by using ICP-MS on a Thermo Scientific iCAP Qa instrument coupled to an ASX-510 HS high-speed autosampler (Thermo Scientific, West Palm Beach, FL) as previously reported.7 Calibration standards of the minerals Na, Mg, Al, K, Ca, Fe, Mn, Cu, Zn, As, Se, Mo, and Cd and the internal standard, Y, were purchased from Ultra Scientific (North Kingstown, RI). A MARS5Microwave digestion system and reaction vessels for digestion of MSX samples were purchased from CEM Corp. (Matthews, NC). Each MSX sample (10 mg) was combined with nitric acid (1 mL; ICP-MS grade) and digested in reaction vessels in the microwave. The digested solutions were transferred to 1.5 mL centrifuge tubes and centrifuged for 10 min at 10 000 rpm at 4 °C. An aliquot of each digested solution (200 μL) was further diluted to 10 mL with DI water and then submitted for ICP-MS analysis. Standard curves for each of the minerals were obtained on the day of the analysis, and the internal standard, Y, was added to every sample to ensure the accuracy of the method.
2.18. Animal Toxicity Studies on MSX Samples
The animal toxicity studies were conducted by ITR Laboratories Canada Inc. (Quebec City, Canada) under a contract with FPAQ. The study followed a well-established protocol of a 7 day oral toxicity study in Sprague–Dawley rats (n = 10 consisting of 5 males and 5 females per treatment group) to determine the toxicity of the MSX samples. The test samples and control/vehicle treatments were administered once daily by oral gavage (using a gavage needle attached to a syringe) for 7 consecutive days at doses of 100, 300, and 1000 mg/kg/day for each MSX sample. Therefore, animals of group 1 were administered the vehicle item (0.5% carboxymethyl cellulose) alone, animals of groups 2, 3, and 4 were administered MSX-1 (at doses of 100, 300, and 1000 mg/kg/day, respectively), and animals of groups 5, 6, and 7 were administered MSX-2 (at doses of 100, 300, and 1000 mg/kg/day, respectively). The dose volume was 10 mL/kg for all animals, and the actual volume administered to each rat was calculated and adjusted on the basis of the body mass of each animal. All animals were euthanized upon completion of the treatment period (day 8), and following an overnight period without food, the animals were anesthetized with isoflurane to allow collection of blood samples for clinical pathology evaluation, followed by exsanguination. To avoid autolytic changes, the necropsy examination of the carcass was conducted as soon as possible on all animals. Gross pathology consisted of an external examination, including identification of all clinically recorded lesions, as well as a detailed internal examination. A staff pathologist was available for consultation during all necropsies. For animals euthanized at termination, organs identified in the tissue preservation section were dissected, trimmed free of fat, and weighed, and the body mass to relative organ masses were calculated. The study plan was reviewed and assessed by the Animal Care Committee (ACC) of ITR, and the ACC acceptance of the study plan was maintained on file at ITR. All animals used in the study were cared for in accordance with the principles outlined in the current Guide to the Care and Use of Experimental Animals as published by the Canadian Council on Animal Care and the Guide for the Care and Use of Laboratory Animals, an NIH publication.
2.19. Ash and Fiber Contents of MSX samples
The ash and fiber contents of the MSX samples were carried out by Covance Laboratories (Madison, WI) using approved standard operating procedures (SOPs) that followed the Official Methods of Analysis of AOAC International (for ash and fiber contents).
3. Results and Discussion
3.1. Preparation of MSX
Maple syrup is a popular and widely consumed natural sweetener, but to date, there are no reported studies of any food-grade extracts derived from this sweetener. Many plant food industries have expanded and diversified their product portfolios with commercial botanical extracts, e.g., grape seed and cranberry extracts (derived from the squeezed fruit pulp and seeds after juicing), which are widely used as functional food and nutraceutical ingredients. Notably, many of these generally regarded as safe (GRAS) extracts have grown in consumer acceptance and are being increasingly studied in both academic and industrial research laboratories for their chemical compositional and biological effects. Therefore, all of the aforementioned factors, in addition to our group’s ongoing interest in maple products, prompted the initiation of this project, which sought to develop a proprietary maple syrup extract (named MSX). For this project, two declassified maple syrup samples (see the Materials and Methods for details) were used to generate the MSX samples, named MSX-1 and MSX-2. The MSX samples were produced in a pilot-scale facility using adsorption chromatography with an FDA food-grade approved resin (Amberlite XAD-16) and food-grade solvents (water and denatured ethanol). MSX appears as a dark brown free-flowing dried powder after solvent removal.
3.2. Chemical Composition of MSX
3.2.1. Phytochemicals
A total of 42 phytochemicals (the compound structures are shown in Figure 1, and the identities are listed in Table 1) were identified in MSX using a combination of (1) HPLC-DAD methods (by comparison to chemical standards previously isolated by our laboratory from maple sap and syrup)4−7 and (2) isolation (by various chromatographic methods) and structure elucidation (by NMR) of those compounds for which chemical standards were lacking. Therefore, among the 42 compounds, 33 (1–33) compounds were identified by HPLC-DAD and 9 (S1–S9) compounds were isolated and identified by NMR. Notably, among the nine isolates, two compounds (S1 and S2) are new compounds, and a detailed description of their structure elucidation is being reported here for the first time. Details of the phytochemical characterization of MSX are provided below.
3.2.1.1. Identification of Compounds 1–33 in MSX by HPLC-DAD
Figure 2A shows the HPLC-DAD chromatogram of an ethyl acetate extract of pure maple syrup from which compounds 1–33 were identified on the basis of comparison of their HPLC-DAD retention times and UV spectra (see Table 1) to those of authentic standards previously isolated from maple sap and syrup by our laboratory.4−7 The HPLC profiles of the MSX-1 and MSX-2 samples (see parts B and C, respectively, of Figure 2) showed close similarities to the HPLC profile of pure maple syrup (Figure 2A), allowing for the identification of compounds 1–33 therein. The striking similarities of the HPLC profile of the pure maple syrup sample to the HPLC profiles of the MSX samples suggest that phytochemicals present in pure maple syrup persist in these declassified maple syrup samples. While it was not possible to determine the levels of all of the individual phytochemicals present in the MSX sample given the complex overlapping peaks in the HPLC-DAD profiles, we conducted quantitative studies based on two major compounds, namely, S5 and S7 (further described below; see Table 5) present therein. In addition, we quantified the MSX samples to total polyphenol contents (further described below).
Table 5. Levels (%) of Compounds S5 and S7 in the MSX Samples.
| sample | compd S5 | compd S7 |
|---|---|---|
| MSX-1 | 0.095 | 0.004 |
| MSX-2 | 0.132 | 0.049 |
3.2.1.2. Identification of Compounds S1–S9 in MSX Samples by Isolation and Structure Elucidation (by NMR)
In the current study, apart from the identification of compounds 1–33 (by HPLC-DAD methods), an additional nine compounds (compounds S1–S9; Table 2) were isolated and identified (using mass spectral and NMR data and by comparison to literature data when available). Notably, all of these nine compounds were originally present in pure maple syrup (peaks are apparent in the HPLC chromatogram shown in Figure 2A), but these compounds were not isolated in our previous phytochemical studies.4−7 Among the nine isolates, two are new compounds, (6R)-6-hydroxy-3-(hydroxymethyl)-2-cyclohexenone (S1) and 3,4-dihydro-5-(hydroxymethyl)pyran-2-one (S2), two are stilbene derivatives, 4,4′-dihydroxy-3,3′,5,5′-tetramethoxystilbene (S3) and 4,4′-dihydroxy-3,3′,5′-trimethoxystilbene (S4), two are furan derivatives, 4-hydroxy-2-(hydroxymethyl)-5-methyl-3(2H)-furanone (S5) and 5-(hydroxymethyl)furfural (S7), and three are Ar–C1 derivatives (S6, S8, and S9). Among these nine isolates, only S7, a known product of the Maillard reaction, has previously been reported from maple syrup,29 and thus, all of the other eight isolates are being reported from maple syrup herein for the first time. Also, the isolation and structure elucidation of two additional stilbenoids (compounds S3 and S4) supports our previous report of the occurrence of the stilbene phenolic subclass in maple syrup [where (E)-3,3′-dimethoxy-4,4′-dihydroxystilbene was previously reported4]. The NMR data for all nine isolates (S1–S9) are provided herein (see the Materials and Methods), but only the detailed structure elucidation of the two new compounds (S1 and S2) is discussed below.
3.2.1.2.1. Elucidation of Compound S1
Compound S1 was obtained as a yellow oil with a molecular formula of C7H10O3 as determined by the HR-ESIMS m/z 141.0557 [M – H]− (calcd for C7H9O3, 141.0552) data with 3 degrees of unsaturation. The 1H and 13C NMR data (Table 3) of compound S1 revealed the presence of an α,β-unsaturated ketone moiety [δC 120.0, 167.0 and 200.3; δH 6.00 (1H, s)], one oxygenated methine group [δC 72.3; δH 4.05 (1H, m)], and three methylene groups (δC 25.1, 31.0, and 63.3). The aforementioned NMR data and the HMBC correlations (see Figure 3) from H-2 (δH 6.00) to C-6, C-7, and C-4, along with the C-4–C-5–C-6 spin system (from the 1H–1H COSY data) implied that the planar structure of compound S1 was 6-hydroxy-3-(hydroxymethyl)-2-cyclohexenone. The only chiral center (C-6) in the structure of compound S1 was assigned an R configuration on the basis of a negative Cotton effect at 323 nm (Δε −0.39, n → π* transition of the α,β-unsaturated ketone) in the CD spectrum.30 Notably, while this is the first reported occurrence of compound S1, its methoxylated derivative, 6-hydroxy-3-(methoxymethyl)-2-cyclohexenone, has been previously reported, but the latter compound was obtained by synthesis and not as an isolated natural product.31
Figure 3.
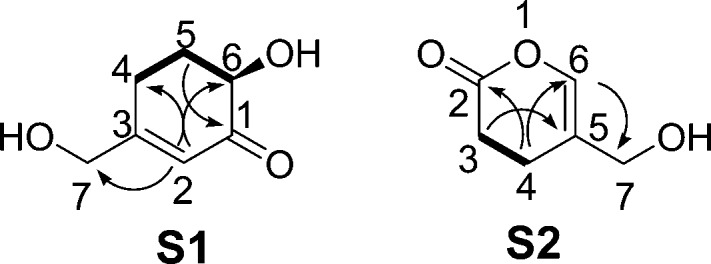
Key 1H–1H COSY (−) and HMBC (H → C) correlations of compounds S1 and S2.
3.2.1.2.2. Elucidation of Compound S2
Compound S2 was isolated as an amorphous powder with a molecular formula of C6H8O3 as established by the HR-ESIMS m/z 127.0396 [M – H]− (calcd for C6H7O3, 127.0395) data with 3 degrees of unsaturation. The 13C NMR data of compound S2 showed resonance signals typical of an ester carbonyl group at δC 176.5, a single C–C double bond (δC 148.3 and 133.1), and three methylene groups (δC 21.7, 21.7 and 72.1). The linkage from C-2 to C-4 was determined by the 1H–1H COSY correlation of H-3/H-4 and the HMBC correlations (see Figure 3) from H-4 and H-3 to C-2. The HMBC correlation between H-4 and C-6 and between H-3 and C-5 and the carbon resonance signal of C-2 (δC 176.5) revealed the connection between C-2 and C-6 was via an oxygen. The HMBC correlations from H2-7 (δH 4.76) to C-5 and C-6 indicated that an oxygenated methylene (CH2-7) was attached to C-5. Therefore, the structure of S2 was elucidated as that of the new compound 3,4-dihydro-5-(hydroxymethyl)pyran-2-one.
3.2.1.3. Quantification Studies of MSX Based on Total Polyphenol Content
Given that maple syrup is known to contain phenolics,4 the MSX-1 and MSX-2 samples were evaluated for total polyphenol content (see Table 4). As expected, because these are extracts, the polyphenol contents of the MSX samples were far greater than that of the original pure maple syrup (ca. 16% vs 0.04% GAEs). However, the polyphenol levels of MSX–EtOAc extracts (ca. 27% GAEs) were in a range similar to that of MS–EtOAc (ca. 30% GAEs) which we have recently reported shows anti-inflammatory effects in an LPS-stimulated RAW264.7 macrophage model14 (further discussed below). However, the aforementioned MS–EtOAc extract was not produced under food-grade conditions, unlike the MSX samples which are being investigated in the current study for human consumption (i.e., for nutraceutical applications).
3.2.1.4. Quantification Studies of MSX Based on the Levels of Compounds S5 and S7
Several furan derivatives, in particular, 5-(hydroxymethyl)furfural (HMF; compound S7), are well-known Maillard products formed during heat-processing of sugary foods, including the natural sweeteners honey and maple syrup.28,32 Interestingly, HMF has been a subject of debate due to reports of its potential toxicity, although this is still a controversial issue as this compound has been shown to exert antioxidant, antitumor, and anti-inflammatory effects.33,34 Thus, since the two furan derivatives isolated in this study, namely, compounds S5 and S7, appeared as major peaks in the HPLC-DAD chromatogram of the MSX-2 sample (see Figure 2C), we sought to determine their levels in both of the MSX samples (see Table 5). Of the two MSX samples, MSX-2 contained higher levels of both compounds S5 and S7 (0.132% and 0.049%, respectively), and among the two compounds, S5 was present in higher levels than S7 in both of the MSX samples. We did not attempt to correlate the levels of any individual constituents present in the MSX samples to their overall biological activities (further discussed in section 3.4). However, given the occurrence of the furan derivatives therein, and the aforementioned controversial reports of the potential toxicity of HMF,33,34 we also evaluated the MSX samples for toxicity using an animal model (further discussed in section 3.3). Moreover, animal toxicity studies are especially relevant if the MSX samples are to be utilized for future nutraceutical applications.
3.2.2. Sugars
The sugar contents (sucrose, glucose, fructose, and complex sugars) of the MSX samples were quantitated in this study (see Table 6). The MSX samples contained similar levels of total sugars (ca. 50%), and similar to pure maple syrup, sucrose was the most abundant sugar. Apart from sucrose, the MSX samples also contained complex sugars, glucose, and fructose. The detection of complex sugars in the MSX samples is not surprising considering that the presence of these constituents has been previously reported in pure maple syrup.2 Complex polysaccharides are being increasingly used as functional food ingredients and have interesting biological effects,35,36 and thus, their presence in MSX, beyond sucrose alone, is interesting from a human health perspective.
Table 6. Average Sugar and Vitamin Contents of MSX Samples.
| sugar contenta (mg/100 g) |
vitamin contenta (mg/100 g) |
|||||
|---|---|---|---|---|---|---|
| sample | sucrose | glucose | fructose | complex sugar | B2 | B3 |
| MSX-1 | 38635.18 ± 63.04 | 63.76 ± 9.25 | 6.99 ± 0.82 | 16231.72 ± 20.68 | 410.26 ± 0.43 | 7.13 ± 0.01 |
| MSX-2 | 41136.41 ± 67.21 | 284.10 ± 11.16 | 233.65 ± 19.01 | 8927.52 ± 9.12 | 290.45 ± 0.06 | 9.83 ± 0.03 |
Assay conducted with neat samples of original MSX samples.
3.2.3. Amino Acids
The levels of amino acids, namely, arginine, threonine, proline, and histidine, in the MSX samples are shown in Table 7. Among these amino acids, proline was the most abundant, reaching levels of ca. 19 mg/100 g of the MSX samples.
Table 7. Average Amino Acid and Organic Acid Contents of MSX Samples.
| amino
acid contenta (mg/100 g) |
organic
acid contenta (mg/100 g) |
||||
|---|---|---|---|---|---|
| sample | arginine + threonine | proline | histidine | malic acid | fumaric acid |
| MSX-1 | 10.06 ± 0.18 | 19.13 ± 0.32 | 2.52 ± 0.05 | 780.99 ± 0.39 | 15.92 ± 0.02 |
| MSX-2 | 9.93 ± 0.09 | 19.29 ± 0.28 | 0.80 ± 0.05 | 341.85 ± 0.17 | 7.51 ± 0.02 |
Assay conducted with neat samples of original MSX samples.
3.2.4. Organic Acids
The levels of the organic acids, malic acid and fumaric acid in the MSX samples are shown in Table 7. Among the two organic acids, malic acid was the most abundant, reaching levels of ca. 781 and 341 mg/100 g in the MSX-1 and MSX-2 samples, respectively.
3.2.5. Minerals
The mineral contents of the MSX samples are shown in Table 8, and among the two samples, MSX-1 had greater mineral levels compared to the MSX-2 sample, which is in agreement with the ash data for the two MSX samples (see Table 9, further described below). Among the minerals that were quantitated, magnesium, potassium, calcium, and zinc were the most abundant, reaching levels of ca. 124, 128, 380, and 90 mg/100 g in the MSX-1 sample.
Table 8. Average Mineral Contents of MSX Samples.
| mineral
contenta (mg/100 g) |
||||||||
|---|---|---|---|---|---|---|---|---|
| sample | K | Ca | Mg | Na | Mn | Al | Zn | Fe |
| MSX-1 | 128.35 ± 6.66 | 380.48 ± 33.10 | 124.51 ± 9.54 | 4.86 ± 1.23 | 58.45 ± 4.06 | 0.32 ± 0.04 | 90.98 ± 8.08 | 0.70 ± 0.07 |
| MSX-2 | 70.50 ± 7.68 | 212.78 ± 17.41 | 48.79 ± 3.94 | 3.52 ± 1.52 | 53.19 ± 4.43 | 0.46 ± 0.11 | 23.81 ± 2.59 | 0.44 ± 0.08 |
Assay conducted with neat samples of original MSX samples.
Table 9. Ash Contents of MSX Samples.
| sample | ash contenta (%) |
|---|---|
| MSX-1 | 2.21 |
| MSX-2 | 1.10 |
Assay conducted with neat samples of original MSX samples.
3.2.6. Vitamins
Similar to pure maple syrup,1 the MSX samples contained two major vitamins, namely, riboflavin (B2) and niacin (B3), and their levels are shown in Table 6. Among the two vitamins, riboflavin was the most abundant, reaching levels of 410 and 290 mg/100 g in the MSX-1 and MSX-2 samples, respectively.
3.2.7. Ash and Fiber
The ash and fiber contents of the MSX samples (assays conducted by Covance) are shown in Tables 9 and 10, respectively. The ash content of the MSX-1 sample was greater than that of the MSX-2 sample (ca. 2.2% vs 1.1%), which correlated with the higher mineral content of the MSX-1 sample compared to the MSX-2 sample (Table 8, discussed above). Interestingly, both of the MSX samples contained ca. 11% total dietary fiber, which was present primarily as soluble fiber (Table 10).
Table 10. Fiber Contents of MSX Samples.
| total
dietary fiber contenta (%) |
||||
|---|---|---|---|---|
| sample | insoluble dietary fiber | sum of measured fibers | high molecular weight soluble dietary fiber | low molecular weight soluble dietary fiber |
| MSX-1 | <0.75 | 10.9 | 5.59 | 5.31 |
| MSX-2 | <0.75 | 10.9 | 5.59 | 5.31 |
Assay conducted with neat samples of original MSX samples.
3.3. Animal Toxicity Studies in Sprague–Dawley Rat
Animal safety studies were conducted to determine the toxicity of the MSX-1 and MSX-2 samples following once daily oral gavage administration for 7 consecutive days to Sprague–Dawley rat. Parameters monitored during the study included mortality, clinical observations, body masses, and food consumption. In addition, hematology, coagulation, clinical chemistry, and urinalysis parameters were evaluated on day 8. At termination (day 8), all animals were euthanized and subjected to a gross necropsy examination and organ mass measurements. Subsequently, a complete list of tissues were retained and examined microscopically. There were no deaths, no clinical signs, and no changes in body masses, food consumption hematology, coagulation, clinical chemistry, urinalysis, or organ masses that could be attributed to the administration of either the MSX-1 or MSX-2 sample at doses of up to 1000 mg/kg/day. Similarly, there were no microscopic or macroscopic findings which could be attributed to the test samples. Thus, the daily oral administration of the MSX samples for 7 consecutive days to the Sprague–Dawley rat was well tolerated and did not result in any signs of overt toxicity.
3.4. In Vitro Biological Studies of MSX Samples
3.4.1. MSX Samples Show DPPH Free Radical Scavenging Activity
In the nutraceutical and functional food industry, many extracts which contain phenolic compounds are well-known to exhibit antioxidant activities. Moreover, published studies have shown that phenolic-enriched extracts of maple sap and maple syrup, as well as their purified phenolic constituents, show antioxidant effects.4,5,13 Therefore, the MSX-1 and MSX-2 samples were evaluated for their antioxidant effects in the DDPH free radical scavenging assay, and they showed IC50 values of ca. 97 and 102 μg/mL, respectively (see Table 4), which were comparable to that of a phenolic-enriched ethyl acetate extract of pure maple syrup (further discussed below; IC50 = 75.5 μg/mL).5 While these samples are all extracts and cannot be compared, on the basis of molar equivalents, to well-known antioxidants commonly used as positive controls, such as ascorbic acid (vitamin C) and butylated hydroxytoluene (BHT; a commercial synthetic antioxidant), we did evaluate the latter compounds in the DPPH assay, and they showed IC50 values of ca. 40 and 3000 μM, respectively.5
3.4.2. MSX Samples Lowered Nitrite and PGE2 Concentrations in RAW 246.7 Cell Culture Media
Phenolic-enriched extracts of maple sap and maple syrup, derived by partitioning with ethyl acetate (EtOAc), have been reported to lower nitrite levels [measured as nitric oxide (NO) levels] in cell culture media in LPS-stimulated RAW 264.7 macrophages,13 a bioassay which is widely used to evaluate the anti-inflammatory effects of natural products. Using the same RAW 264.7 macrophage model, our group has recently investigated the anti-inflammatory effects of an EtOAc extract of pure maple syrup (MS−EtOAc) which showed inhibition of both NO and PGE2.14 In that study, we also evaluated the anti-inflammatory effects of several individual phenolic constituents present in the MS–EtOAc, and among these pure compounds, a stilbenoid, namely, 3,3′-dimethoxy-4,4′-dihydroxystilbene (compound 33),4 was the most active compound in the anti-inflammatory assay. However, overall, we observed that the anti-inflammatory effect of the total extract was greater than any of its single purified constituent alone. Notably, the MS–EtOAc extract that we studied in that previous project14 is not suitable for human consumption (i.e., was not produced under food-grade conditions), unlike the MSX samples which are being studied here. Therefore, in the current study we additionally sought to evaluate the anti-inflammatory effects of phenolic-enriched MSX–EtOAc extracts (see Figure 4). As previously discussed, since we had found that a stilbene (compound 33) was the most active among the various subclasses of phenolic compounds in the anti-inflammatory assay,14 and since we isolated two additional stilbene derivatives from the MSX samples reported herein, namely, 4,4′-dihydroxy-3,3′,5,5′-tetramethoxystilbene (S3) and 4,4′-dihydroxy-3,3′,5′-trimethoxystilbene (S4), we evaluated the two latter compounds for their ability to inhibit the NO level in the RAW 264.7 macrophages. Interestingly, while compound S3 (at 25 and 50 μM concentrations) did not show any significant decrease in NO levels in the LPS-stimulated macrophages (approximately 2% inhibition), compound S4 (at 25 and 50 μM concentrations) inhibited the NO levels by 38.8% ± 2.5% and 78.3% ± 2.8%, respectively. Similar to our previous report,14 we confirmed that compound 33 significantly reduced the NO concentration in the LPS-treated macrophage media by almost 100% ± 1.3%. While it is difficult to make conclusive structure–activity-related (SAR) observations on the basis of data accumulated from only these three stilbenoids, it would appear that substitution of a methoxyl (OCH3) group at position 5′ (i.e., the R2 position as in compound S3) leads to a significant reduction in bioactivity in this assay.
Figure 4.

Effects of MSX ethyl acetate extracts on (A) nitrite and (B) PGE2 production in LPS-stimulated RAW 264.7 cells. Cells were cotreated with LPS (100 ng/mL) and samples (50 and 100 μg/mL) for 24 h. MSX extracts inhibited NO and PGE2 levels in LPS-stimulated macrophages in a concentration-dependent manner. The values are expressed as the means ± SD of three individual samples. Three asterisks indicate P < 0.001 as compared with the LPS-treated macrophages; significant differences between groups were determined using a one-way ANOVA test followed by Dunnett’s multiple comparison test. A pound sign indicates P < 0.001 for the solvent control compared with the LPS-treated cells; the significant difference was determined using unpaired Student’s t test.
Similar to our recent published data with MS–EtOAc, both of the MSX–EtOAc extracts significantly inhibited nitrite levels in cell media (Figure 4A). The MSX-1 ethyl acetate extract significantly reduced nitrite production by 25.1% (at 50 μg/mL) and 67.1% (at 100 μg/mL). Also, treatment with 50 and 100 μg/mL concentations of the MSX-2 ethyl acetate extract inhibited nitrite levels by 24.8% and 41.3%, respectively. Thus, the current results show that the MSX–EtOAc extracts lowered nitrite production in a concentration-dependent manner in LPS-stimulated RAW 264.7 cells similar to our previous report for MS–EtOAc.14
As a follow-up to the nitrite assay, we also evaluated the levels of PGE2 in cell media. As shown in Figure 4B, PGE2 levels were elevated following LPS treatment (263.3 ± 26.5 ng/mL), whereas in the absence of LPS, the PGE2 levels were close to baseline. The levels of PGE2 were markedly reduced to 147.4 and 62.9 ng/mL by 50 and 100 μg/mL MSX-1 ethyl acetate extract treatment, respectively. Similarly, treatment with 50 and 100 μg/mL MSX-2 ethyl acetate extract lowered PGE2 levels in LPS-stimulated macrophages to 149.7 and 126.1 ng/mL, respectively. Therefore, taken together, these results suggest that the MSX–EtOAc extracts were capable of reducing NO and PGE2 in LPS-induced macrophages.
3.4.3. MSX Samples Decreased Glucose Levels in HepG2 Cell Media
Recent published data in a diabetic animal model have shown that pure maple syrup has the ability to reduce plasma glucose levels compared to sucrose solution alone.11 It has been reported that plant extracts, such as rosemary extract, can regulate glucose and lipid metabolism in HepG2 liver hepatocytes.27 Therefore, using this cell-culture model, we examined the potential of the MSX samples to regulate glucose consumption, along with the clinical drug metformin, a well-known AMP-dependent protein kinase (AMPK) activator. As shown in Figure 5, the MSX-1 and MSX-2 samples significantly decreased glucose levels in the cell supernatants. The glucose levels in the media with 50 and 100 μg/mL MSX-1 treatment were lowered by almost 16% compared to that of the control group. Similarly, the MSX-2 treatment, at 50 and 100 μg/mL concentrations, reduced media glucose levels by about 16% and 18% respectively. Metformin, at 1 mM concentration, also dramatically decreased glucose levels by 23% as compared to that of the control in the HepG2 cell culture media. Therefore, our preliminary in vitro studies reported here lend support to the recent published in vivo study with maple syrup.11
Figure 5.

Effects of MSX samples on glucose consumption by HepG2 cells.
In summary, in this project we have conducted chemical compositional, in vitro biological, and in vivo animal safety studies of a novel maple syrup derived extract for potential functional food and nutraceutical applications. To the best of our knowledge, this is the first reported study of a food-grade maple syrup extract.
This project was supported by Agriculture and Agri-Food Canada (AAFC) through the AgriInnovation program under the Growing Forward policy framework. The animal toxicity study was conducted by ITR Canada and was funded by the Federation of Maple Syrup Producers of Quebec (FPAQ) and AAFC. The large-scale production of the MSX samples was conducted by Silicycle Inc. and was funded by FPAQ. The NMR data were acquired at a research facility at the University of Rhode Island supported in part by National Science Foundation EPSCoR Cooperative Agreement No. EPS-1004057. The ICP mass spectral data were acquired on an instrument located at the University of Rhode Island in the RI-INBRE core facility obtained with Grant No. P20RR016457 from the National Center for Research Resources (NCRR), a component of the National Institutes of Health (NIH).
The authors declare no competing financial interest.
Funding Statement
National Institutes of Health, United States
References
- Perkins T. D.; van den Berg A. K. Maple syrup-production, composition, chemistry, and sensory characteristics. Adv. Food Nutr. Res. 2009, 56, 101–143. [DOI] [PubMed] [Google Scholar]
- Storz G.; Darvill A. G.; Albersheim P. Characterization of polysaccharides isolated from maple syrup. Phytochemistry 1986, 25, 437–441. [Google Scholar]
- Ball D. W. The chemical composition of maple syrup. J. Chem. Educ. 2007, 84, 1647–1650. [Google Scholar]
- Li L.; Seeram N. P. Maple syrup phytochemicals include lignans, coumarins, a stilbene and other previously unreported antioxidant phenolic compounds. J. Agric. Food Chem. 2010, 58, 11673–11679. [DOI] [PubMed] [Google Scholar]
- Li L.; Seeram N. P. Further investigation into maple syrup yields three new lignans, a new phenylpropanoid, and twenty-six other phytochemicals. J. Agric. Food Chem. 2011, 59, 7708–7716. [DOI] [PMC free article] [PubMed] [Google Scholar]
- Li L.; Seeram N. P. Quebecol, a novel phenolic compound isolated from Canadian maple syrup. J. Funct. Foods 2011, 3, 125–128. [Google Scholar]
- Yuan T.; Li L.; Zhang Y.; Seeram N. P. Pasteurized and sterilized maple sap as functional beverages: Chemical composition and antioxidant activities. J. Funct. Foods 2013, 5, 1582–1590. [Google Scholar]
- Kermasha S.; Goetghebeur M.; Dumont J. Determination of phenolic compound profiles in maple products by high performance liquid chromatography. J. Agric. Food Chem. 1995, 43, 708–716. [Google Scholar]
- Abou-Zaid M. M.; Nozzolillo C.; Tonon A.; Coppens M.; Lombardo A. D. A. High performance liquid chromatography characterization and identification of antioxidant polyphenols in maple syrup. Pharm. Biol. 2008, 46, 117–125. [Google Scholar]
- Watanabe Y.; Kamei A.; Shinozaki F.; Ishijima T.; Iida K.; Nakai Y.; Arai S.; Abe K. Ingested maple syrup evokes a possible liver-protecting effect-physiologic and genomic investigations with rats. Biosci., Biotechnol., Biochem. 2011, 75, 2408–2410. [DOI] [PubMed] [Google Scholar]
- Nagai N.; Ito Y.; Taga A. Comparison of the enhancement of plasma glucose levels in type 2 diabetes Otsuka Long-Evans Tokushima fatty rats by oral administration of sucrose or maple syrup. J. Oleo Sci. 2013, 62, 737–743. [DOI] [PubMed] [Google Scholar]
- González-Sarrías A.; Li L.; Seeram N. P. Effects of maple (Acer) plant part extracts on proliferation, apoptosis and cell cycle arrest of human tumorigenic and non-tumorigenic colon cells. Phytother. Res. 2012, 26, 995–1002. [DOI] [PubMed] [Google Scholar]
- Legault J.; Girard-Lalancette K.; Grenon C.; Dussault C.; Pichette A. Antioxidant activity, inhibition of nitric oxide overproduction, and in vitro antiproliferative effect of maple sap and syrup from Acer saccharum. J. Med. Food 2010, 13, 460–468. [DOI] [PubMed] [Google Scholar]
- Nahar P. P.; Driscoll M. V.; Li L.; Slitt A. L.; Seeram N. P. Phenolic mediated anti-inflammatory properties of a maple syrup extract in RAW 264.7 murine macrophages. J. Funct. Foods 2014, 6, 126–136. [Google Scholar]
- Yuan T.; Wan C.; Gonzalez-Sarrias A.; Kandhi V.; Cech N. B.; Seeram N. P. Phenolic glycosides from sugar maple (Acer saccharum) bark. J. Nat. Prod. 2011, 74, 2472–2476. [DOI] [PubMed] [Google Scholar]
- Wan C.; Yuan T.; Xie M.; Seeram N. P. Acer rubrum phenolics include A-type procyanidins and a chalcone. Biochem. Syst. Ecol. 2012, 44, 1–3. [Google Scholar]
- Wan C.; Yuan T.; Li L.; Kandhi V.; Cech N. B.; Xie M.; Seeram N. P. Maplexins, a-glucosidase inhibitors from red maple (Acer rubrum) stems. Bioorg. Med. Chem. Lett. 2012, 22, 597–600. [DOI] [PubMed] [Google Scholar]
- Yuan T.; Wan C.; Liu K.; Seeram N. P. New maplexins F-I and phenolic glycosides from red maple (Acer rubrum) bark. Tetrahedron 2012, 68, 959–964. [Google Scholar]
- Seeram N. P.; Lee R.; Hardy M. L.; Heber D. Rapid large-scale purification of ellagitannins from pomegranate husk, a by-product of the commercial juice industry. Sep. Purif. Technol. 2005, 41, 49–55. [Google Scholar]
- Gierer J.; Nilvebrant N. Lignin chromophores. Part III. Syntheses of hydroxy- and alkoxystilbenes via aryl migration. J. Wood Chem. Technol. 1991, 11, 171–193. [Google Scholar]
- Ames J. M.; Bailey R. G.; Mann J. Analysis of furanone, pyranone, and new heterocyclic colored compounds from sugar-glycine model Maillard systems. J. Agric. Food Chem. 1999, 47, 438–443. [DOI] [PubMed] [Google Scholar]
- Hu K.; Wu X.; Shen J.; Zhou Y.; Jiang Z.; Cheng G. 1H NMR spectrum simplification of phenyl compounds containing electronegative groups by intermolecular interactions. Tetrahedron Lett. 2008, 49, 2324–2328. [Google Scholar]
- Li G.; Chen F.; Shen L.; Shen S.; Zhang J.; Si J. Chemical constituents from roots and rhizomes of Acorus tatarinowii. Zhongcaoyao 2013, 44, 808–811. [Google Scholar]
- Xie S.; Li G.; Zhang K.; Wang H.; Tan Y.; Wang J. Isolation and identification of chemical constituents from Cynomorium songaricum. Shenyang Yaoke Daxue Xuebao 2012, 29, 525–528. [Google Scholar]
- Du X.; Zhao B.; Zheng Z.; Xu Q.; Su W. Study on the isolation identification and antitumor activity of a phenol derivative from mangrove fungus BYY-1. Jimei Daxue Xuebao, Ziran Kexueban 2011, 16, 424–428. [Google Scholar]
- Singleton V. L.; Rossi J. A. Colorimetry of total phenolics with phosphomolybdic-phosphotungstic acid reagents. Am. J. Enol. Vitic. 1965, 16, 144–158. [Google Scholar]
- Nanjo F.; Goto K.; Seto R.; Suzuki M.; Sakai M.; Hara Y. Scavenging effects of tea catechins and their derivatives on 1,1-diphenyl-2-picrylhydrazyl radical. Free Radical Biol. Med. 1996, 21, 895–902. [DOI] [PubMed] [Google Scholar]
- Tu Zh.; Moss-Pierce T.; Ford P.; Jiang T. A. Rosemary (Rosmarinus officinalis L.) extract regulates glucose and lipid metabolism by activating AMPK and PPAR pathways in HepG2 cells. J. Agric. Food Chem. 2013, 61, 2803–2810. [DOI] [PubMed] [Google Scholar]
- Filipic V. J.; Underwood J. C.; Dooley C. J. Trace components of the flavor fraction of maple syrup. J. Food Sci. 1969, 34, 105–110. [Google Scholar]
- Snatzke G. Circular dichroismus-IX: Modifizierung der octantenregel für α,β- ungesättigte ketone: Transoide enone. Tetrahedron 1965, 21, 421–438. [Google Scholar]
- Tamura Y.; Yakura T.; Terashi H.; Haruta J.; Kita Y. Hypervalent iodine oxidation of α,β-unsaturated carbonyl compounds. Chem. Pharm. Bull. 1987, 35, 570–577. [Google Scholar]
- Hošt’álková A.; Klingelhöfer I.; Morlock G. E. Comparison of an HPTLC method with the reflectoquant assay for rapid determination of 5-hydroxymethylfurfural in honey. Anal. Bioanal. Chem. 2013, 405, 9207–9218. [DOI] [PubMed] [Google Scholar]
- Zirbes L.; Nguyen B. K.; De Graaf D. C.; De Meulenaer B.; Reybroeck W.; Haubruge E.; Saegerman C. Hydroxymethylfurfural: A possible emergent cause of honey bee mortality?. J. Agric. Food Chem. 2013, 61, 11865–11870. [DOI] [PubMed] [Google Scholar]
- Kim H. K.; Choi Y. W.; Lee E. N.; Park J. K.; Kim S. G.; Park D. J.; Kim B. S.; Lim Y. T.; Yoon S. 5-Hydroxymethylfurfural from black garlic extract prevents TNFα-induced monocytic cell adhesion to HUVECs by suppression of vascular cell adhesion molecule-1 expression, reactive oxygen species generation and NF-κB activation. Phytother. Res. 2011, 25, 965–974. [DOI] [PubMed] [Google Scholar]
- Zhang L.; Koyyalamudi S. R.; Jeong S. C.; Reddy N.; Bailey T.; Longvah T. Immunomodulatory activities of polysaccharides isolated from Taxillus chinensis and Uncaria rhyncophylla. Carbohydr. Polym. 2013, 98, 1458–1465. [DOI] [PubMed] [Google Scholar]
- Giavasis I. Bioactive fungal polysaccharides as potential functional ingredients in food and nutraceuticals. Curr. Opin. Biotechnol. 2014, 26, 162–173. [DOI] [PubMed] [Google Scholar]