Results demonstrate that proton MR signal changes among different lung volumes are in good agreement with 3He MR ventilation imaging findings and can be successfully applied in both healthy volunteers and patients with obstructive lung disease.
Abstract
Purpose
To introduce a method based on multivolume proton (hydrogen [1H]) magnetic resonance (MR) imaging for the regional assessment of lung ventilatory function, investigating its use in healthy volunteers and patients with obstructive lung disease and comparing the outcome with the outcome of the research standard helium 3 (3He) MR imaging.
Materials and Methods
The institutional review board approved the HIPAA-compliant protocol, and informed written consent was obtained from each subject. Twenty-six subjects, including healthy volunteers (n = 6) and patients with severe asthma (n = 11) and mild (n = 6) and severe (n = 3) emphysema, were imaged with a 1.5-T whole-body MR unit at four lung volumes (residual volume [RV], functional residual capacity [FRC], 1 L above FRC [FRC+1 L], total lung capacity [TLC]) with breath holds of 10–11 seconds, by using volumetric interpolated breath-hold examination. Each pair of volumes were registered, resulting in maps of 1H signal change between the two lung volumes. 3He MR imaging was performed at FRC+1 L by using a two-dimensional gradient-echo sequence. 1H signal change and 3He signal were measured and compared in corresponding regions of interest selected in ventral, intermediate, and dorsal areas.
Results
In all volunteers and patients combined, proton signal difference between TLC and RV correlated positively with 3He signal (correlation coefficient R2 = 0.64, P < .001). Lower (P < .001) but positive correlation results from 1H signal difference between FRC and FRC+1 L (R2 = 0.44, P < .001). In healthy volunteers, 1H signal changes show a higher median and interquartile range compared with patients with obstructive disease and significant differences between nondependent and dependent regions.
Conclusion
Findings in this study demonstrate that multivolume 1H MR imaging, without contrast material, can be used as a biomarker for regional ventilation, both in healthy volunteers and patients with obstructive lung disease.
© RSNA, 2014
Introduction
Regional quantification of pulmonary ventilation is of critical importance in investigating lung function in healthy individuals and in patients with disease progression, in planning pulmonary interventions, and in evaluating parenchymal alterations induced by therapy. With these aims, multiple imaging techniques have been proposed in the past few decades. Nuclear imaging provides a direct ventilation measure but is limited by low resolution, low signal-to-noise ratio, and time-averaged acquisitions that do not necessarily reflect tidal breathing (1–3). Xenon-enhanced computed tomography (CT) provides thin-section ventilation images, but the xenon anesthetic properties and the requirement for special equipment are challenging (4). In the past decade, newer methods based on multivolume CT have been proposed as surrogates for regional ventilation in healthy individuals and in patients with disease (5–7), but the radiation exposure of the patients limits their use for repetitive follow-up examinations and for acquisition in young adults, children, or pregnant women.
In contrast to nuclear medicine and CT techniques, magnetic resonance (MR) imaging offers a radiation-free imaging modality. Hyperpolarized gas MR imaging has proven useful in imaging lung function and microstructure (8–11), but high costs and the use of non–Food and Drug Administration–approved gaseous tracers have thus far restricted translation to the clinic. Other methods based on paramagnetic T1-shortening contrast agent tracers have been proposed (12,13), but the long examination time impedes their routine use and limits most of the studies to two-dimensional sections. The use of proton MR imaging has historically been hampered by the combination of low proton density and short T2* of lung tissue (14,15), but it has regained attention with the development of short-acquisition-time techniques (16,17) and frequency-swept nuclear MR (18). Enhanced techniques developed with free-breathing MR imaging have been proposed to assess regional ventilation by using Fourier decomposition (19,20) and by using image registration (21,22).
Similar to multivolume CT–based studies (5–7), we hypothesize that proton signal change within the lung among different lung volumes (23) can be used to regionally investigate lung function. Therefore, the purpose of this study was to introduce a method based on multivolume proton (1H) MR imaging for the regional assessment of lung ventilatory function, investigating its use in healthy volunteers and patients with obstructive lung disease and comparing the outcome with the outcome of the research standard 3He MR imaging.
Materials and Methods
Study Subjects
The Institutional Review Board of Washington University in St Louis, Mo, approved the Health Insurance Portability and Accountability Act–compliant protocol, and informed written consent was obtained from each subject. In a total of 26 subjects, six were healthy volunteers, 11 were patients with severe asthma, six were patients with mild emphysema, and three were patients with severe emphysema. The subjects’ details are reported in Table 1.
Table 1.
Characteristics of 26 Healthy Volunteers and Patients with Disease

Note.—Data are medians, and numbers in parentheses are interquartile ranges (IQRs). FEV1 = forced expiratory volume in the first second of expiration, FVC = forced vital capacity.
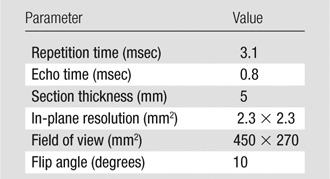
1H image acquisition.—Subjects were imaged with a 1.5-T whole-body MR unit (Avanto; Siemens, Erlangen, Germany) at four lung volumes (residual volume [RV], functional residual capacity [FRC], 1 L above FRC [FRC+1 L], total lung capacity [TLC]) with breath holds of 10–11 seconds by using volumetric interpolated breath-hold examination with the integrated body coil. Inflation volumes were determined by coaching the volunteers to TLC and RV. FRC was achieved by the end of expiration during tidal breathing, and FRC+1 L was achieved by inhalation of a 1-L gas mixture from FRC. Imaging parameters are listed in Table 2.
Table 2.
1H MR Imaging Parameters
3He image acquisition.—3He images were acquired at FRC+1 L of a 40% mixture of 3He in nitrogen (3He polarization, approximately 40%) by means of a homebuilt and/or commercial He polarizer (IGI.9600; GE Healthcare, Durham, NC) by using a two-dimensional gradient-echo sequence and eight-element receiver coil with a separate single-channel transmit coil (Stark Contrast MRI Coils Research, Erlangen, Germany). Imaging parameters (Table 3) were slightly different for each group because of physical or technical limitations.
Table 3.
3He MR Imaging Parameters

MR Image Processing
3He signal intensities were normalized to the maximum 3He pulmonary value in each subject; no corrections for B1 (relatively uniform) were implemented. 1H signal intensities were normalized to the mean heart signal (tissue plus blood) to eliminate the effect of sensitivity changes due to volume differences and are expressed as a percentage of that signal.
1H MR images were first segmented semiautomatically to separate lung parenchyma from the surrounding soft tissues (24). To follow 1H signal change between different inflation volumes, a deformable image registration algorithm, based on the Demons algorithm (25), was applied. Deformable image registration consists of finding the spatial mapping between corresponding voxels in two images (ie, the reference and the moving image) and was applied to deform TLC to RV and FRC+1 L to FRC, chosen arbitrarily as reference volumes. The Demons algorithm relies on the assumption that corresponding voxels on the images to be registered have the same image intensity. Thus, the input images were preprocessed by using a Laplacian filter (26) to make the registration process more sensitive to structure rather than to overall image intensity (which changes with lung volume).
The registered volume was subtracted from the reference, resulting in a map of 1H signal change between the two lung volumes.
All algorithms for image processing and quantitative analysis were performed by using the open-source Insight Segmentation and Registration Toolkit of the National Library of Medicine (27).
Image Analysis
Image analysis was performed by one author (F.P., with a PhD degree in bioengineering and 4 years of experience in pulmonary imaging).
1H signal at different lung volumes.—For each subject, median and IQR of the 1H signal within the overall lung were computed at each lung volume to evaluate the relationship between proton density and lung volume. Lung volume was estimated by counting the number of voxels within the segmented lung.
Comparison between 1H signal difference and 3He MR imaging.—1H signal difference and 3He signal were measured in corresponding regions of interest (ROIs). At four lung levels, six ROIs were chosen, by using software (Medical Image Processing, Analysis and Visualization; National Institutes of Health, Bethesda, Md [28]) to uniformly cover the overall lung, avoiding large blood vessels and airways. Corresponding ROIs were compared for each patient separately, taking into account variations in 3He polarization from patient to patient; in a second approach, corresponding ROIs in 3He MR imaging and 1H MR imaging were compared in the overall population. 1H MR signal difference was computed both for vital capacity (ie, RV − TLC) and tidal volume (ie, FRC − FRC+1 L) to identify the respiratory range that best correlates with 3He MR imaging.
Application in health and disease.—For each subject, the median and IQR of the 1H MR signal differences (computed as RV − TLC) within the overall lung were calculated to evaluate the proposed imaging technique in discriminating between patients with disease and healthy volunteers and in quantifying the stage of disease.
Gravity dependence analysis.—In each subject, the 1H MR signal difference map (computed as RV − TLC) was partitioned in 10 regions of equal vertical extent, and linear regression analysis was performed between vertical (anterior-posterior) height of the lung level (in centimeters) and median values of the 1H signal difference. To perform statistical analysis in larger lung regions, the median values of 1H signal change were computed within lung thirds of equal vertical extent, namely ventral, intermediate, and dorsal regions.
Statistical Analysis
Statistical analysis was performed by using software (SigmaStat version 11.0; Systat Software, San Jose, Calif).
One-way analysis of variance was applied to separately compare 1H signal median and IQR and signal change across inflation volumes (RV, FRC, FRC+1 L, TLC), disease states (healthy volunteers and patients with asthma and mild and severe emphysema) and vertical lung third. The Spearman correlation coefficient was used to correlate median 1H density to lung volume.
In cases in which the equal variance test and/or the normality test failed, the nonparametric Kruskal-Wallis analysis of variance on ranks was applied. Post hoc tests were based on Holm-Sidak and Dunn methods for parametric and nonparametric analysis of variance tests, respectively.
Values in the main body and tables are reported as medians (25th–75th percentiles). Significance was determined by using a difference with P < .05.
The correlation coefficients (R2) between 1H signal change and 3He MR imaging within corresponding ROIs were calculated by using linear regression for each subject, and the median (25th–75th percentiles) value for the overall population was reported. In the second analysis, the R2 between 1H signal change and 3He signal within corresponding ROIs was computed for the overall population, but excluding two subjects whose 3He signal intensity data were severely clipped by the digital buffer.
Results
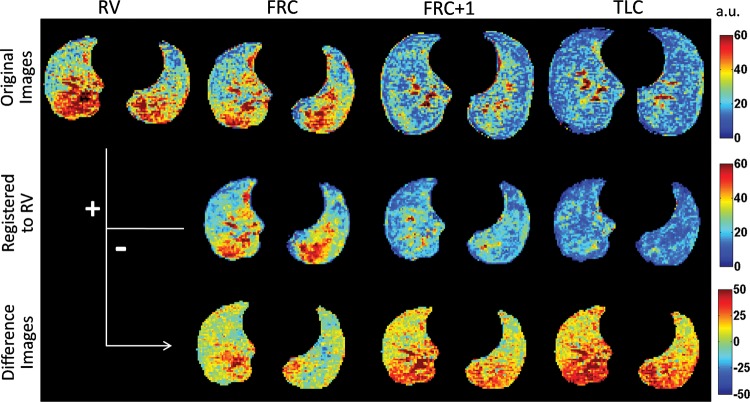
Figure 1 shows representative images at the top diaphragm level of a healthy volunteer. At the top, images at RV, FRC, FRC+1 L, and TLC show that proton signal and gravity-dependent differences decrease with increasing lung inflation. In the middle, the registered images demonstrate minimal change in the distribution of the signal with registration. At the bottom, the proton signal difference maps show increasing average value and gravity-dependence heterogeneity with the respiratory range. Within vital capacity, the proton signal changes from 20% of the mean heart signal up to 40% of the mean heart signal in the gravity-dependent regions.
Figure 1:
Representative masked original (top), registered (middle), and proton signal difference (bottom) maps at the top diaphragm level from a healthy volunteer at RV, FRC, FRC+1 L, and TLC. Data are expressed as percentage of the mean heart signal. Color spectra are expressed in arbitrary units (a.u.).
1H Signal at Different Lung Volumes
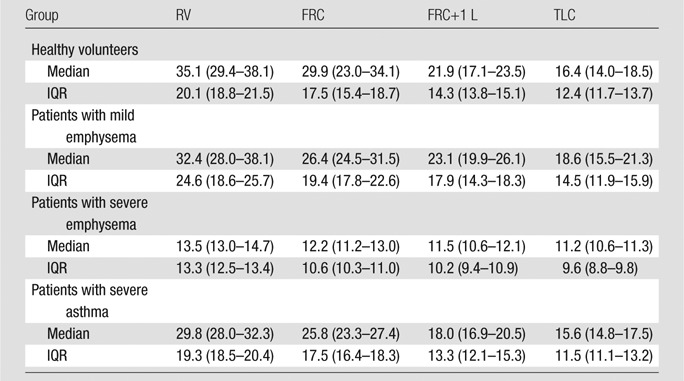
Table 4 reports the 1H signal median and IQR in the different groups at all the acquired volumes. The Spearman correlation coefficient between median 1H density and segmented lung volume is R of −0.81. In healthy volunteers and patients with mild emphysema and severe asthma, the median value decreases from RV to TLC (respectively, P < .01). In patients with severe emphysema, there is no significant difference with lung volumes. At all lung volumes, median values in healthy volunteers and patients with mild emphysema are significantly different from those in patients with severe emphysema (P < .05). No significant difference is present at TLC among the different groups. In healthy volunteers and patients with mild emphysema and severe asthma, but not in patients with severe emphysema, IQR decreases from RV to TLC (P < .001). At RV and FRC, but not at FRC+1 L and TLC, IQRs in healthy volunteers and patients with mild emphysema and severe asthma are significantly different from the IQR in patients with severe emphysema (P < .05).
Table 4.
Proton Signal at Four Lung Volumes in Healthy Volunteers and Patients with Disease
Note.—Data are medians, and numbers in parentheses are IQRs.
Figure 2 reports representative proton signal difference images. In the representative healthy volunteer, proton signal change averaged 20% of the mean heart signal, with increasing heterogeneity from aortic arch to top diaphragm, where a clear gravitational gradient is present. In the patient with mild emphysema, the 1H signal change decreases at all lung levels, with areas where 1H signal does not change at the aortic arch and carina. In the patient with severe emphysema, the average 1H signal change decreases below 10%, with a more homogeneous distribution. In the patient with severe asthma, areas with no proton signal change are present and the gravitational gradient at the top diaphragm level is still present, although the overall average is smaller than that for the healthy volunteer.
Figure 2:
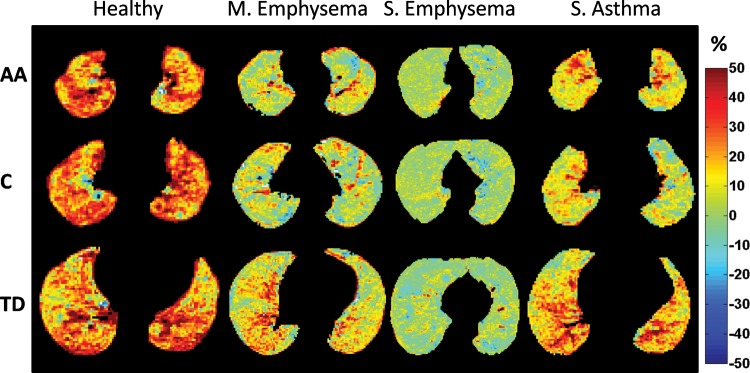
Representative proton signal difference images from a healthy volunteer (never smoker) and patients with mild emphysema (FEV1 = 55% predicted), severe emphysema (FEV1 = 22% predicted), and severe asthma (FEV1 = 67% predicted) are shown at representative lung levels: aortic arch (AA), carina (C), and top diaphragm (TD). Color spectra indicate the 1H signal difference as a percentage of the mean heart signal.
Comparison between 1H Signal Difference and 3He MR Imaging
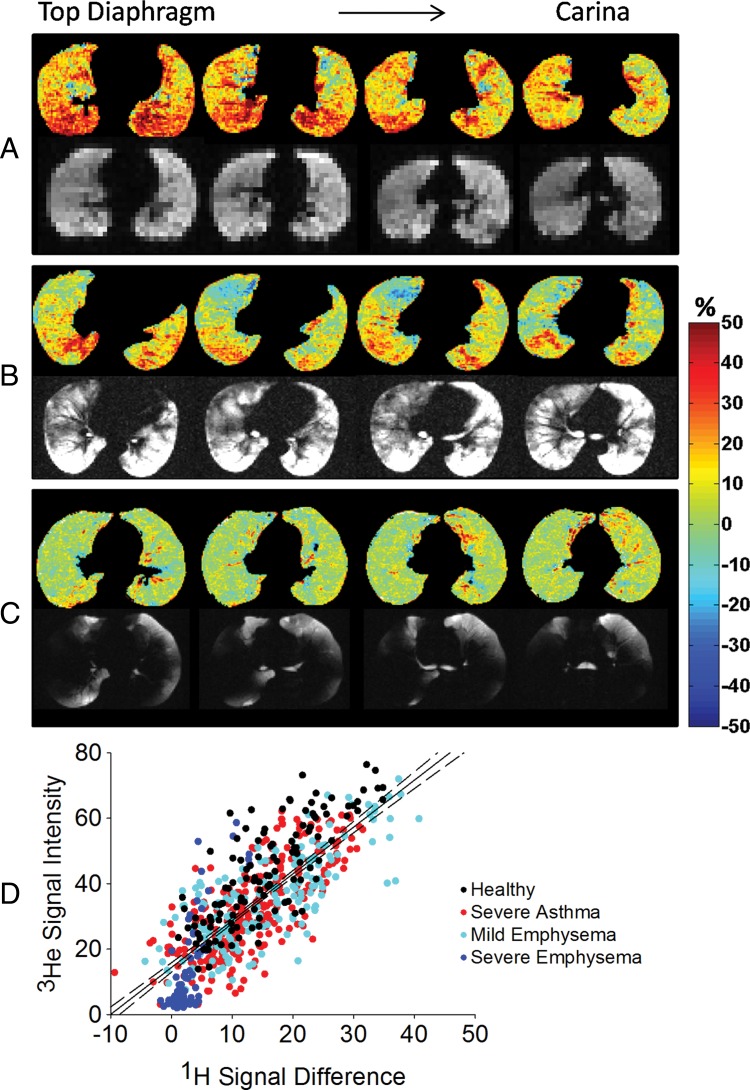
Figure 3, A, shows ROI analysis in a representative healthy volunteer. 1H MR signal difference maps, computed as RV minus TLC, demonstrated an increase of 1H signal change up to 40% of the mean heart signal from ventral to dorsal regions, without ventilation defects. 3He MR images are characterized by a high 3He signal throughout the overall lung. The correlation between the two imaging techniques results in R2 of 0.56 (P < .001). In the same subject, 1H MR signal difference for tidal volume, computed as FRC minus FRC+1 L, resulted in a lower but positive R2 of 0.38 (P < .001).
Figure 3:
Corresponding proton density difference maps computed as RV minus TLC and 3He MR images in, A, a representative healthy volunteer, B, a representative patient with asthma (FEV1 = 60% predicted), and, C, a representative patient with severe emphysema (FEV1 = 19% predicted). 1H signal difference is expressed as a percentage of the mean heart signal; 3He signal intensity is expressed as a percentage of the maximum 3He lung value. D, Correlation analysis between 1H signal change and 3He signal intensity in the overall population (R2 = 0.61). Data are expressed respectively in percentage respect to the mean heart signal and to the maximum 3He value within the lung. Dotted lines = 95% confidence intervals for the regressions. Color spectra indicate the 1H signal difference as a percentage of the mean heart signal.
Figure 3, B, shows ROI analysis in a representative patient with asthma. 1H signal difference maps and 3He MR images show corresponding ventilation defects as low 1H signal difference areas (around 0% of the mean heart signal) and low 3He signal, in addition to corresponding well-ventilated areas, as 1H signal change averaging 30% of the mean heart signal and high 3He signal. Correlation analysis resulted in an R2 of 0.77 (P < .001). In the same subject, 1H MR signal difference for tidal volume, computed as FRC minus FRC+1 L, resulted in a lower but positive R2 of 0.62 (P < .001).
Figure 3, C, shows the correlation analysis in a representative patient with severe emphysema. The overall lung is poorly ventilated with 3He; corresponding proton signal variations for vital capacity averaged below 5% of the mean heart signal. Ventilation in the left lower lobe is still present and visible with both imaging modalities. Areas of disagreement are present in the right lower lobe. Correlation analysis yields a positive correlation coefficient of 0.55 (P < .001).
In all volunteers and patients combined, the correlation coefficient between 1H signal difference images and 3He MR images is 0.64 (IQR, 0.53–0.68) (P < .001). Lower but always positive correlation coefficient results from 1H signal difference computed for tidal volume due to the lower contrast when lower volume change occurs, with R2 of 0.44 (IQR, 0.24–0.54).
Figure 3, D, shows the correlation analysis between the normalized 3He signal and the 1H MR signal difference, computed as RV minus TLC, in the overall population, resulting in R2 of 0.61 (P < .001). Per group, correlation coefficients are R2 of 0.64 in healthy subjects, R2 of 0.55 in asthmatic patients, R2 of 0.58 in patients with mild emphysema, and R2 of 0.62 in patients with severe emphysema. 3He and 1H signal difference of patients with severe emphysema are lower with respect to the other groups. ROIs from healthy volunteers are distributed toward higher values with respect to obstructive diseases. Patients with mild emphysema and patients with asthma cover the entire range from those with severe disease to those who are healthy.
Application in Healthy Individuals and Patients with Disease
Table 5 reports the median and IQR of whole-lung 1H signal change in healthy volunteers and patients in three different respiratory ranges. In patients with severe emphysema, 1H signal difference is lower than in healthy volunteers in both median (P < .05, in all the respiratory ranges) and IQR (P < .001 in all the respiratory ranges). In patients with asthma, IQR results are significantly lower between FRC and TLC.
Table 5.
Proton Signal Differences in Healthy Volunteers and Patients with Disease Computed during Different Phases of the Respiratory Cycle
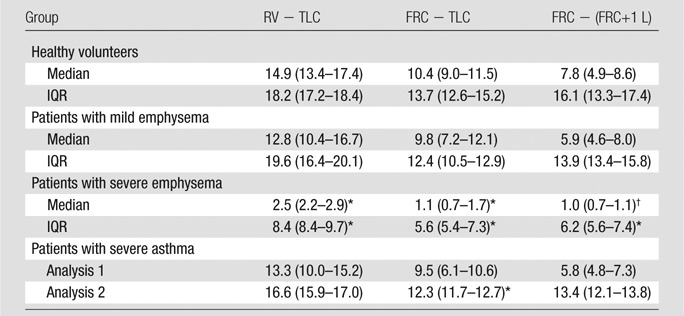
Note.—Data are medians, and numbers in parentheses are IQRs. Values are expressed as the percentage of the mean heart signal.
P < .001 versus healthy volunteers.
P < .05.
Gravity-dependence Analysis
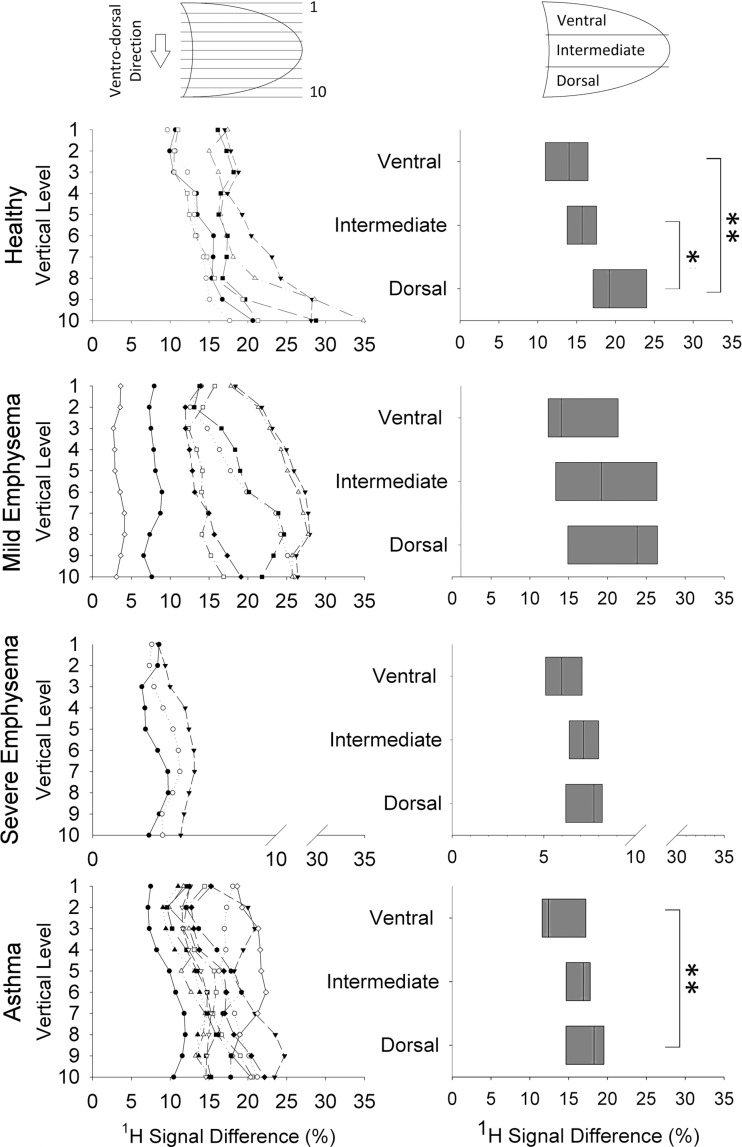
The results of gravity-dependence analysis are reported in Figure 4. The individual variations of 1H MR signal difference (computed as RV − TLC) (Fig 4, left) along the vertical (ie, anterior-posterior) direction demonstrate an increase in all the healthy volunteers—from nondependent to dependent levels. This behavior is not present in patients. The results of the linear regression analysis between vertical height of the levels (in centimeters) and median values of proton difference results in a linear regression coefficient of 0.86 (25th–75th percentiles, 0.79–0.95) in healthy volunteers and of 0.68 (25th–75th percentiles, 0.61–0.78), 0.38 (25th–75th percentiles, 0.38–0.45), and 0.71 (25th–75th percentiles, 0.63–0.91), respectively, in patients with mild emphysema, severe emphysema, and asthma. Images demonstrate a median increase of 1H signal difference equal to 1.1, 0.7, 0.1, and 0.8 au/cm of gravitational height, respectively, in healthy volunteers, patients with mild and severe emphysema, and patients with asthma. The lung-thirds analysis (Fig 4, right) in healthy volunteers demonstrates a strong dependence on gravity for proton signal difference, which is significantly higher in the most gravity-dependent one-third of the lung (dorsal region), compared with the ventral (P = .002) and intermediate (P = .02) regions. In patients with severe asthma, the results in the dorsal and the ventral regions are significantly different (P = .008). Conversely, no significant differences are present in patients with mild and severe emphysema.
Figure 4:
Top to bottom: Gravity dependence analysis in healthy volunteer and patients with mild emphysema, severe emphysema, and severe asthma, respectively. Left: Individual variations of median values of proton signal difference along ventrodorsal direction (vertical axis) from the least (one) to the most (10) gravity-dependent levels. Each piecewise line represents a single subject. Right: Proton signal difference values in ventral, intermediate, and dorsal regions for all subjects. Bottom to top: Boxes indicate 25th percentile, median, and 75th percentile of the values calculated in all subjects. * = P < .05; ** = P < .01.
Discussion
In this study, we propose a method based on multivolume MR imaging for nonenhanced assessment of regional lung function. The results demonstrated that proton signal changes between different lung volumes are in good agreement with the results of 3He ventilation imaging and can be successfully applied in both healthy individuals and patients with obstructive lung disease.
When comparing proton images at different lung volumes in healthy individuals, a measurable signal decrease with increasing inspired gas is present, observable within all the respiratory ranges. Positive correlations are found between 3He ventilation images and 1H signal difference among different lung volumes, with higher correlation for vital capacity; we attribute much of the less-than-perfect correlation (r2 = 0.6) to the low signal-to-noise ratio of the 1H images (between two and five), which also causes the regression analysis reported in Figure 3, D, to not pass through the origin. At 1.5 T, lung T2* ranges from 0.89 to 2.18 msec (29); therefore, acquisitions with echo time of 0.8 msec probably suffered nontrivial signal loss. We expect that T2* may vary slightly with increasing lung volume (30), which will also contribute to imperfect correlation.
In the healthy lung, proton signal change was higher in median and IQR, respectively, related to higher gas volume variation and gravity-dependent regional differences (31,32). In the case of disease, the compliance of lung parenchyma can be altered, resulting in areas of gas trapping or obstructions. These regional alterations, where no gas volume change occurs, were identified by signal voids on 3He MR images and by areas of lower proton signal change. In patients with emphysema, proton signal difference was lower than in healthy volunteers, both in median and IQR, becoming significantly different from that in healthy volunteers with increasing severity of the disease, reflecting homogeneous tissue destruction throughout the overall lung. The IQR decrease from healthy volunteers is strictly related to the decrease or loss of gravity dependence with disease. These results are consistent with data in recent studies on apparent diffusion coefficient, reporting a gradient in alveolar expansion in the direction of gravity in healthy subjects (33–36) and the near absence of anterior-posterior apparent diffusion coefficient gradient in patients with emphysema, to be attributed to the presence of tissue loss in diseased lung parenchyma (34,35) or to the decreased compressibility of the lung tissue due to air trapping (36). In patients with severe asthma, proton signal difference decreased from healthy volunteers with larger spatial variation in relation to the simultaneous presence of obstructed and well-ventilated regions. The significant differences between the most dependent and nondependent region in asthma are in agreement with Harris et al (37), who reported a vertical gradient of lung inflation. Because the method depends on proton density changes between different lung inflation volumes, asthma, characterized by a significant inflammatory component, may differ from emphysema, where lung tissue density loss is explicit. Ederle et al (38) demonstrated dependencies between central and peripheral airway dimensions and lung parenchyma in healthy individuals and those with disease by using thin-section CT. Nevertheless, the complex interaction between the disease processes with lung volume and proton density due to ventilation, inflammation, and blood volume would require a multi-imaging approach to precisely characterize these interactions. We note that the functional effects of gas trapping due to airway obstruction and emphysema will both result in low or no change in proton signal with volume and low to no 3He ventilation.
3He MR imaging has been successful at demonstrating high-resolution ventilation imaging in obstructive pulmonary diseases (39,40), but high costs and the non–Food and Drug Administration–approved gas tracers have restricted its translation to the clinic. On the contrary, we propose a method based on straightforward pulse sequences and hardware that simply measures the regional amplitude of proton signal change between different lung volumes with no requirement for any gaseous tracers. As no ionizing radiation is associated with MR imaging, the method would be particularly attractive for examinations in children and pregnant women and when repetitive examinations are required. To introduce the method into clinical practice, the methodology of volume control becomes pivotal and would require standardization, as significant differences in lung microstructure with lung inflation level have been observed (41).
Swift et al (42) evaluated the potential of dynamic proton MR imaging to obtain lung volumetric measurements by sampling a forced vital capacity maneuver, Bauman et al (19,20) recently proposed a noninvasive method for ventilation and perfusion imaging based on Fourier decomposition MR imaging in free breathing, thus requiring stability of breathing and heart rate during the measurement. We propose an alternative approach, based on the registration of breath-hold multivolume MR images averaged over many heartbeats. Because of the 10-second breath-hold requirement, it cannot be easily applied in infants and very young children. While the breath hold was well tolerated in all of our subjects, it could be problematic in some patients with very severe disease.
One concern of this study relates to data normalization. Proton MR images were normalized to the mean heart signal, to account for coil-sensitivity changes due to lung volume differences. The heart was chosen as the normalizing factor due to its central location compared with more superficial muscles, which could see more significant coil variation across the chest. 3He MR images were normalized to the maximum lung 3He value, to make the subjects comparable. Excluding the two patients with severely clipped values, the appropriateness of the normalization is confirmed by an overall correlation coefficient of 0.6 between 1H differences and 3He images and by the relative differences between the different groups. Healthy volunteers have higher difference values compared with patients; in patients with mild emphysema and asthma, the diseases are characterized by both healthy and obstructed areas (high and low difference values, respectively), and in patients with severe emphysema, the disease is characterized by very low difference values, with ROIs averaging zero both in 3He signal and 1H signal difference.
The main limitation of the present study is the indirect assessment of regional ventilation, imaged by using proton signal change. However, if parenchymal tissue expands and becomes less dense, the near incompressibility of gas at physiologic pressures necessitates that air enter the less dense spaces. Another important point is related to possible motion artifacts, especially at RV, which may be difficult to hold for subjects with lung disease, causing quantitative values of proton density to be shifted high or low. While no significant motion artifacts were present in our patients at RV, they can be easily detected during the imaging session, and the patient can undergo repeat imaging or the resulting ventilation maps can be appropriately interpreted. In addition, the use of deformable image registration is challenging, as registration accuracy is difficult to quantify on an individual basis. Nevertheless, the use of the Laplacian filter to enhance lung structures prior to registration assures the alignment of the main pulmonary structures and, thus, the alignment of the corresponding regions. In the present work, registration accuracy has been visually assessed. Another slight limitation, due to the data available from the patients with disease and healthy subjects, is the slightly different 3He MR imaging parameters. Nevertheless, clear contrast between well-ventilated and obstructed areas is present in all the subjects. Finally, pulmonary blood volume and T2* vary with inspiration and expiration as the capillary bed expands and declines; thus, further studies investigating normalization for pulmonary perfusion are required to make quantitation more precise.
We note that 1H MR imaging used has a short echo time (0.8 msec) but is not ultrashort echo time (generally less than 0.5 msec) (43,44). While we expect an improvement with the implementation of ultrashort echo time techniques, the imaging reported here is immediately translatable to the clinic (available on nearly any commercial MR imaging unit) and robust with regard to the lack of image artifacts that would complicate quantitative analysis.
In summary, our results suggest that this straightforward method with multivolume MR imaging is quite sensitive to ventilation nonhomogeneities due to gravitational dependence and regional abnormalities resulting from obstructive lung disease. We think proton MR imaging is likely to emerge as a clinical and research tool to identify regional structure-function relationships with no need for special equipment and with no ionizing radiation.
Advances in Knowledge
■ Conventional MR images acquired at multiple volumes can be used to regionally investigate lung function.
■ Positive correlations have been found between proton signal differences across different lung volumes and 3He ventilation imaging, in both healthy volunteers and patients with obstructive pulmonary disease (R2 = 0.64, P < .001).
■ Proton signal change is sensitive to regional ventilation inhomogeneities caused by gravitational dependence in the healthy lung (25% median increase from the most ventral to the most gravity-dependent one-third of the lung, P = .002) and to regional abnormalities resulting from obstructive lung disease (median and interquartile range decrease, P < .001 in severe emphysema).
Implication for Patient Care
■ The study demonstrates that, in healthy subjects and patients with obstructive pulmonary disease, multivolume MR imaging can be used as an alternative to current ventilation imaging techniques by using straightforward pulse sequences and hardware with no requirement for contrast agents or ionizing radiation
Received October 23, 2013; revision requested December 9; final revision received March 4, 2014; accepted March 24; final version accepted April 22.
Funding: This research was supported by the National Institutes of Health (grants R01 HL090806, R01 HL70037, HL69149, U10 HL109257, U19-AI070489, UL1 TR000448).
Disclosures of Conflicts of Interest: F.P. disclosed no relevant relationships. J.D.Q. Activities related to the present article: institution received a grant from the National Institutes of Health. Financial activities not related to the present article: author received stock/stock options from Pfizer. Other relationships: disclosed no relevant relationships. D.A.Y. disclosed no relevant relationships. M.C. Activities related to the present article: institution received a grant from the National Institutes of Health, Severe Asthma Research Program. Activities not related to the present article: author received payment for consultancy from Asthmatx/Boston Scientific and IPS/Holaira and for consultancy and serving on the advisory board from Genentech; institution received grants or has grants pending from Boston Scientific, Amgen, Caption/Cephalon/Teva, Genentech, Medimmune, Merck, Novartis, GSK, Sanofi Aventis, Vectura, Next Bio, KaloBios; author received payment for service as a speaker from Merck, GSK, Genentech, Boston Scientific, Boehringer Ingelheim; author received royalties from Elsiever; author received stock/stock options from Sparo. Other relationships: disclosed no relevant relationships. A.A. disclosed no relevant relationships. J.C.W. disclosed no relevant relationships.
Abbreviations:
- FEV1
- forced expiratory volume in the first second of expiration
- FRC
- functional residual capacity
- FRC+1 L
- 1 L above FRC
- IQR
- interquartile range
- ROI
- region of interest
- RV
- residual volume
- TLC
- total lung capacity
References
- 1.Bunow B, Line BR, Horton MR, Weiss GH. Regional ventilatory clearance by xenon scintigraphy: a critical evaluation of two estimation procedures. J Nucl Med 1979;20(7):703–710. [PubMed] [Google Scholar]
- 2.Newman SP, Pitcairn GR, Hirst PH, Rankin L. Radionuclide imaging technologies and their use in evaluating asthma drug deposition in the lungs. Adv Drug Deliv Rev 2003;55(7):851–867. [DOI] [PubMed] [Google Scholar]
- 3.Schuster DP. Positron emission tomography: theory and its application to the study of lung disease. Am Rev Respir Dis 1989;139(3):818–840. [DOI] [PubMed] [Google Scholar]
- 4.Tajik JK, Tran BQ, Hoffman EA. Xenon enhanced CT imaging of local pulmonary ventilation. Proc SPIE 1996;2709:40–54. [Google Scholar]
- 5.Aliverti A, Pennati F, Salito C, Woods JC. Regional lung function and heterogeneity of specific gas volume in healthy and emphysematous subjects. Eur Respir J 2013;41(5):1179–1188. [DOI] [PubMed] [Google Scholar]
- 6.Simon BA. Non-invasive imaging of regional lung function using x-ray computed tomography. J Clin Monit Comput 2000;16(5–6):433–442. [DOI] [PubMed] [Google Scholar]
- 7.Dougherty L, Torigian DA, Affusso JD, Asmuth JC, Gefter WB. Use of an optical flow method for the analysis of serial CT lung images. Acad Radiol 2006;13(1):14–23. [DOI] [PubMed] [Google Scholar]
- 8.Fain S, Schiebler ML, McCormack DG, Parraga G. Imaging of lung function using hyperpolarized helium-3 magnetic resonance imaging: review of current and emerging translational methods and applications. J Magn Reson Imaging 2010;32(6):1398–1408. [DOI] [PMC free article] [PubMed] [Google Scholar]
- 9.Yablonskiy DA, Sukstanskii AL, Woods JC, et al. Quantification of lung microstructure with hyperpolarized 3He diffusion MRI. J Appl Physiol (1985) 2009;107(4):1258–1265. [DOI] [PMC free article] [PubMed] [Google Scholar]
- 10.Aysola R, de Lange EE, Castro M, Altes TA. Demonstration of the heterogeneous distribution of asthma in the lungs using CT and hyperpolarized helium-3 MRI. J Magn Reson Imaging 2010;32(6):1379–1387. [DOI] [PubMed] [Google Scholar]
- 11.Mistry NN, Thomas A, Kaushik SS, Johnson GA, Driehuys B. Quantitative analysis of hyperpolarized 3He ventilation changes in mice challenged with methacholine. Magn Reson Med 2010;63(3):658–666. [DOI] [PMC free article] [PubMed] [Google Scholar]
- 12.Edelman RR, Hatabu H, Tadamura E, Li W, Prasad PV. Noninvasive assessment of regional ventilation in the human lung using oxygen-enhanced magnetic resonance imaging. Nat Med 1996;2(11):1236–1239. [DOI] [PubMed] [Google Scholar]
- 13.Mai VM, Bankier AA, Prasad PV, et al. MR ventilation-perfusion imaging of human lung using oxygen-enhanced and arterial spin labeling techniques. J Magn Reson Imaging 2001;14(5):574–579. [DOI] [PubMed] [Google Scholar]
- 14.Bergin CJ, Pauly JM, Macovski A. Lung parenchyma: projection reconstruction MR imaging. Radiology 1991;179(3):777–781. [DOI] [PubMed] [Google Scholar]
- 15.Wielpütz M, Kauczor HU. MRI of the lung: state of the art. Diagn Interv Radiol 2012;18(4):344–353. [DOI] [PubMed] [Google Scholar]
- 16.Kuethe DO, Adolphi NL, Fukushima E. Short data-acquisition times improve projection images of lung tissue. Magn Reson Med 2007;57(6):1058–1064. [DOI] [PubMed] [Google Scholar]
- 17.Bianchi A, Ozier A, Ousova O, Raffard G, Crémillieux Y. Ultrashort-TE MRI longitudinal study and characterization of a chronic model of asthma in mice: inflammation and bronchial remodeling assessment. NMR Biomed 2013;26(11):1451–1459. [DOI] [PubMed] [Google Scholar]
- 18.Garwood M, DelaBarre L. The return of the frequency sweep: designing adiabatic pulses for contemporary NMR. J Magn Reson 2001;153(2):155–177. [DOI] [PubMed] [Google Scholar]
- 19.Bauman G, Puderbach M, Deimling M, et al. Non-contrast-enhanced perfusion and ventilation assessment of the human lung by means of fourier decomposition in proton MRI. Magn Reson Med 2009;62(3):656–664. [DOI] [PubMed] [Google Scholar]
- 20.Bauman G, Lützen U, Ullrich M, et al. Pulmonary functional imaging: qualitative comparison of Fourier decomposition MR imaging with SPECT/CT in porcine lung. Radiology 2011;260(2):551–559. [DOI] [PubMed] [Google Scholar]
- 21.Zapke M, Topf HG, Zenker M, et al. Magnetic resonance lung function: a breakthrough for lung imaging and functional assessment? a phantom study and clinical trial. Respir Res 2006;7:106. [DOI] [PMC free article] [PubMed] [Google Scholar]
- 22.Bieri O. Ultra-fast steady state free precession and its application to in vivo (1) H morphological and functional lung imaging at 1.5 tesla. Magn Reson Med 2013;70:657–663. [DOI] [PubMed] [Google Scholar]
- 23.Bankier AA, O’Donnell CR, Mai VM, et al. Impact of lung volume on MR signal intensity changes of the lung parenchyma. J Magn Reson Imaging 2004;20(6):961–966. [DOI] [PubMed] [Google Scholar]
- 24.Hu S, Hoffman EA, Reinhardt JM. Automatic lung segmentation for accurate quantitation of volumetric x-ray CT images. IEEE Trans Med Imaging 2001;20(6):490–498. [DOI] [PubMed] [Google Scholar]
- 25.Thirion JP. Image matching as a diffusion process: an analogy with Maxwell’s demons. Med Image Anal 1998;2(3):243–260. [DOI] [PubMed] [Google Scholar]
- 26.Dougherty L, Asmuth JC, Gefter WB. Alignment of CT lung volumes with an optical flow method. Acad Radiol 2003;10(3):249–254. [DOI] [PubMed] [Google Scholar]
- 27.Yoo TS, Ackerman MJ, Lorensen WE, et al. Engineering and algorithm design for an image processing API: a technical report on ITK—the Insight Toolkit. In: Westwood J, ed. Proceedings of Medicine Meets Virtual Reality. Amsterdam, the Netherlands: IOS Press, 2002; 586–592. [PubMed] [Google Scholar]
- 28.About MIPAV . Bethesda, Md: Center for Information Technology, National Institutes of Health, 2007. http://mipav.cit.nih.gov/. Published March 14, 2007. Updated April 5, 2013. Accessed 2013. [Google Scholar]
- 29.Hatabu H, Alsop DC, Listerud J, Bonnet M, Gefter WB. T2* and proton density measurement of normal human lung parenchyma using submillisecond echo time gradient echo magnetic resonance imaging. Eur J Radiol 1999;29(3):245–252. [DOI] [PubMed] [Google Scholar]
- 30.Theilmann RJ, Arai TJ, Samiee A, et al. Quantitative MRI measurement of lung density must account for the change in T(2) (*) with lung inflation. J Magn Reson Imaging 2009;30(3):527–534. [DOI] [PMC free article] [PubMed] [Google Scholar]
- 31.Milic-Emili J, Henderson JA, Dolovich MB, Trop D, Kaneko K. Regional distribution of inspired gas in the lung. J Appl Physiol 1966;21(3):749–759. [DOI] [PubMed] [Google Scholar]
- 32.Bryan AC, Milic-Emili J, Pengelly D. Effect of gravity on the distribution of pulmonary ventilation. J Appl Physiol 1966;21(3):778–784. [DOI] [PubMed] [Google Scholar]
- 33.Fichele S, Woodhouse N, Swift AJ, et al. MRI of helium-3 gas in healthy lungs: posture related variations of alveolar size. J Magn Reson Imaging 2004;20(2):331–335. [DOI] [PubMed] [Google Scholar]
- 34.Kaushik SS, Cleveland ZI, Cofer GP, et al. Diffusion-weighted hyperpolarized 129Xe MRI in healthy volunteers and subjects with chronic obstructive pulmonary disease. Magn Reson Med 2011;65(4):1154–1165. [DOI] [PMC free article] [PubMed] [Google Scholar]
- 35.Diaz S, Casselbrant I, Piitulainen E, et al. Hyperpolarized 3He apparent diffusion coefficient MRI of the lung: reproducibility and volume dependency in healthy volunteers and patients with emphysema. J Magn Reson Imaging 2008;27(4):763–770. [DOI] [PubMed] [Google Scholar]
- 36.Evans A, McCormack D, Ouriadov A, Etemad-Rezai R, Santyr G, Parraga G. Anatomical distribution of 3He apparent diffusion coefficients in severe chronic obstructive pulmonary disease. J Magn Reson Imaging 2007;26(6):1537–1547. [DOI] [PubMed] [Google Scholar]
- 37.Harris RS, Fujii-Rios H, Winkler T, Musch G, Vidal Melo MF, Venegas JG. Ventilation defect formation in healthy and asthma subjects is determined by lung inflation. PLoS ONE 2012;7(12):e53216. [DOI] [PMC free article] [PubMed] [Google Scholar]
- 38.Ederle JR, Heussel CP, Hast J, et al. Evaluation of changes in central airway dimensions, lung area and mean lung density at paired inspiratory/expiratory high-resolution computed tomography. Eur Radiol 2003;13(11):2454–2461. [DOI] [PubMed] [Google Scholar]
- 39.de Lange EE, Altes TA, Patrie JT, et al. Evaluation of asthma with hyperpolarized helium-3 MRI: correlation with clinical severity and spirometry. Chest 2006;130(4):1055–1062. [DOI] [PubMed] [Google Scholar]
- 40.Mathew L, Kirby M, Etemad-Rezai R, Wheatley A, McCormack DG, Parraga G. Hyperpolarized ³He magnetic resonance imaging: preliminary evaluation of phenotyping potential in chronic obstructive pulmonary disease. Eur J Radiol 2011;79(1):140–146. [DOI] [PubMed] [Google Scholar]
- 41.Halaweish AF, Hoffman EA, Thedens DR, Fuld MK, Sieren JP, van Beek EJ. Effect of lung inflation level on hyperpolarized 3He apparent diffusion coefficient measurements in never-smokers. Radiology 2013;268(2):572–580. [DOI] [PMC free article] [PubMed] [Google Scholar]
- 42.Swift AJ, Woodhouse N, Fichele S, et al. Rapid lung volumetry using ultrafast dynamic magnetic resonance imaging during forced vital capacity maneuver: correlation with spirometry. Invest Radiol 2007;42(1):37–41. [DOI] [PubMed] [Google Scholar]
- 43.Johnson KM, Fain SB, Schiebler ML, Nagle S. Optimized 3D ultrashort echo time pulmonary MRI. Magn Reson Med 2013;70(5):1241–1250. [DOI] [PMC free article] [PubMed] [Google Scholar]
- 44.Togao O, Tsuji R, Ohno Y, Dimitrov I, Takahashi M. Ultrashort echo time (UTE) MRI of the lung: assessment of tissue density in the lung parenchyma. Magn Reson Med 2010;64(5):1491–1498. [DOI] [PubMed] [Google Scholar]


