

Abstract
BACKGROUND
The management options for the autosomal recessive neurodegenerative disorder spinal muscular atrophy (SMA) are evolving; however, their efficacy may require presymptom diagnosis and continuous treatment. To identify presymptomatic SMA patients, we created a DNA-based newborn-screening assay to identify the homozygous deletions of the SMN1 (survival of motor neuron 1, telomeric) gene observed in 95%–98% of affected patients.
METHODS
We developed primers that amplify a 52-bp PCR product from homologous regions in the SMN1 and SMN2 (survival of motor neuron 2, centromeric) genes that flank a divergent site at site c.840. Post-PCR high-resolution melt profiling assessed the amplification product, and we used a unique means of melt calibration to normalize profiles. Samples that we had previously characterized for the numbers of SMN1 and SMN2 copies established genotypes associated with particular profiles. The system was evaluated with approximately 1000 purified DNA samples, 100 self-created dried blood spots, and >1200 dried blood spots from newborn-screening tests.
RESULTS
Homozygous deletion of SMN1 exon 7 produced a distinctive melt profile that identified SMA patients. Samples with different numbers of SMN1 and SMN2 copies were resolved by their profiles. All samples with homozygous deletions were unambiguously recognized, and no normal sample was misidentified as a positive.
CONCLUSIONS
This assay has characteristics suitable for population-based screening. A reliable screening test will facilitate the identification of an SMA-affected cohort to receive early intervention to maximize the benefit from treatment. A prospective screening trial will allow the efficacy of treatment options to be assessed, which may justify the inclusion of SMA as a target for population screening.
The most recent expansion of newborn screening (NBS)8 was technology driven through the application of tandem mass spectrometry (1, 2). NBS has expanded and will continue to expand as the natural histories of additional disorders are understood and as new treatment options are developed. Traditionally, NBS testing methods have detected metabolic, endocrine, and hemoglobin disorders via measurements of proteins, enzymes, hormones, and small molecules. Recently, severe combined immunodeficiency syndromes have been recommended for inclusion in NBS programs. This category of diseases is the first instance in which DNA-based testing has been broadly applied as the primary screening tool (3).
Spinal muscular atrophy (SMA) is an autosomal recessive neurodegenerative disorder that affects approximately 1 in 10 000 newborns (4). Defects in the SMN19 (survival motor neuron 1, telomeric) gene produce a deficiency in or an absence of survival motor neuron protein that leads to subsequent motor neuron degeneration (5, 6). Deletions that involve the seventh exon of SMN1 are observed in 95%–98% of SMA-affected patients (7). The telomeric SMN1 gene is highly homologous to the centromeric SMN2 (survival motor neuron 1, centromeric) gene. A thymine is present at position c.840 of the SMN2 gene, whereas a cytosine is present at the homologous site in SMN1. The thymine at c.840 in SMN2 disrupts an exon-splicing enhancer motif, which causes the mRNA-processing machinery to missplice >90% of SMN2 transcripts (8, 9). Although SMN2 is not a pseudogene, it provides little functional product. The proximity of the homologous SMN1 and SMN2 genes has led to chromosomal misalignment and unequal crossing-over, producing variable numbers of copies of the SMN1 and SMN2 genes due to deletion and duplication events. An increased number of SMN2 copies modifies the clinical phenotype associated with homozygous deletion of SMN1 and correlates with a delayed onset of the disease and/or a less severe presentation.
Several therapeutic regimens for treating SMA are being evaluated (10–14). The common thread among the potential therapies is that early and continuous intervention is required. In type I SMA (severe infantile variant and the most common form of the disease), the window of opportunity for treatment intervention is small, because substantial denervation occurs by 3 months of age. For patients to derive the maximal benefit from promising new treatments, intervention is almost certainly required before disease manifestation (15, 16). The optimal scenario is to genetically identify the infants at the highest risk of disease progression shortly after birth and to enter them in a treatment regimen during the first few weeks of life. To facilitate the identification of a presymptomatic cohort of SMA-affected patients, we have developed an assay suitable for prospective NBS. The assay is DNA based and leverages site c.840, where the SMN1 and SMN2 genes are divergent. Post-PCR high-resolution melt profiling produces unique melting profiles, owing to differences in SMN1 and SMN2 copy numbers, and patients with homozygous SMN1 deletion are readily identified.
Materials and Methods
SAMPLES AND DNA PREPARATION
Three DNA sources were used during test development. Initially used were deidentified DNA samples from routine clinical testing that were scheduled to be discarded. DNA was prepared from whole blood in the ARUP Clinical Molecular Genetics Laboratory with the Roche MagNA Pure System. Second, mock NBS dried blood spots on filter paper (DBS) were created with deidentified excess whole blood samples from routine testing that were scheduled for disposal. Whole blood (approximately 50 μL) was applied to Whatman 903 filter paper, allowed to dry overnight, and subsequently stored at −20 °C until use. The protocol for obtaining and deidentifying samples (blood or DNA) was provided by the University of Utah Institutional Review Board (IRB). NBS DBS were obtained from the Michigan Biotrust for Health (http://www.mnbb.org), and IRB approvals were obtained. DNA was prepared from DBS (both mock samples and genuine NBS samples) as previously described (17). DNA samples previously characterized for SMN1 and SMN2 copy numbers (homozygous SMN1 deletion, SMN1 deletion carriers, and normal with variant SMN1 and SMN2 copy numbers) were used as controls. These samples were provided with consent under an IRB-approved protocol at the University of Utah, and genotypes were determined by one of the authors (T.W. Prior).
PCR ANALYSES
We designed primers to amplify the SMN1 and SMN2 genes by using sequence NC 000005.9 (70220768..70248839) and Primer Premier 4.0 software (Premier Biosoft). The forward primer (5′-TTCC-TTTATTTTCCTTACAGGGTTT-3′) and the reverse primer (5′-ACCTTCCTTCTTTTTGATTTTGTCT-3′) amplify a homologous 52-bp fragment of the SMN1 and SMN2 genes that includes the c. 840 site where a cytosine is present in SMN1 and a thymine is present in SMN2 (Fig. 1). The amplification cocktail (10 μL) has previously been described and contained the dye LCGreen Plus (Idaho Technology) to facilitate post-PCR melt profiling (18, 19). A novel means to accomplish melt calibration used an unpurified oligonucleotide (salted out) that formed a hairpin structure (5′–TAC AAT TCT AAA TCA TAT ATC AAA AGC ACA CCT TTT CAT ATA TCA TTT AGA ATT GTA–3′) and was included at 0.1 μmol/L. Amplification reactions were overlaid with 20 μL mineral oil (Fisher Scientific).
Fig. 1. Strategy for amplifying homologous regions of SMN1 and SMN2 to facilitate post-PCR melt profiling.
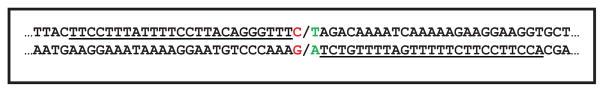
Underlined sequence indicates amplification primers. The red G:C base pair is present in SMN1. The green T:A base pair is present in SMN2.
Amplification was performed in a 96-well format with either a C1000 Thermal Cycler (Bio-Rad Laboratories) or a PerkinElmer 9700 PE Thermal Cycler according to the following thermocycling protocol: 95 °C for 1 min, 45 cycles of 95 °C for 20 s and 60 °C for 20 s, 95 °C for 1 min, and a hold at 4 °C.
MELT PROFILING
Postamplification melt profiling used a LightScanner instrument (96-well format; Idaho Technology) that collected data from 55 °C to 85 °C. Data were analyzed by the onboard software with the short-amplicon genotyping module and the low-temperature calibration signal (20, 21).
DETERMINING SMN2 COPY NUMBER IN PATIENTS WITH HOMOZYGOUS SMN1 DELETION
SMN2 copy number was determined by using co-PCR (mixing) and post-PCR melt profiling. DNA (5 ng) purified from patient samples with homozygous SMN1 deletion was mixed in a 1:1 ratio with 5 ng DNA from a sample with a single copy each of SMN1 and SMN2 and amplified as described above. Post-PCR melt profiling was performed as described above. We used the shape of the melting profile to determine SMN2 copy number by comparing it with profiles generated by previously characterized samples carrying an SMN1 deletion and a known number of SMN2 copies.
Results
We assessed several candidate primer pairs that flank the c.840 site of the SMN1 and SMN2 genes and generate fragments from 53 bp to 90 bp (data not shown). Fig. 1 graphically presents the optimal primer pair, which amplifies a 53-bp fragment from homologous regions of SMN1 and SMN2. Note that the primers directly flanked c.840 and that there was but a single nucleotide between the 3′ end of the forward primer and the 3′ end of the reverse primer. This primer design produced 2 slightly different PCR products, each with unique melting characteristics. We assessed the performance of this primer pair (Fig. 1) with approximately 1000 residual purified DNA samples scheduled for disposal by the ARUP Clinical Molecular Genetics Laboratory. The residual purified DNA samples (putatively normal) generated several distinctive melting profiles that owed to differences in the numbers of SMN1 and SMN2 copies. Samples from 10 SMA-affected patients with homozygous deletion of SMN1 exon 7 were assessed. These samples generated a unique profile that was readily discernable. None of the 1000 residual samples (putatively normal) produced a profile consistent with homozygous SMN1 deletion.
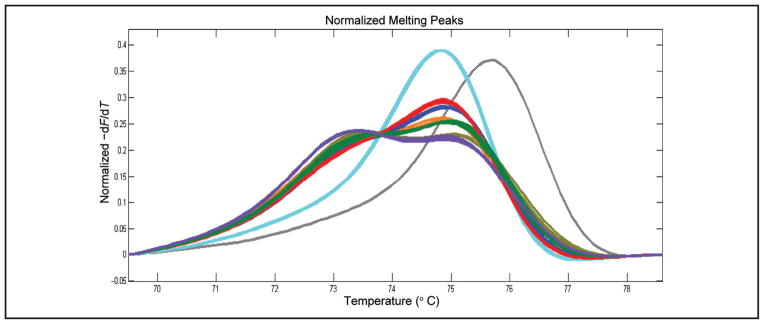
To determine how differences in profile shape were related to numbers of SMN1 and SMN2 copies, we assessed DNA samples that had previously been characterized for SMN1 and SMN2 copy numbers. Matching the shapes of profiles from characterized samples to those generated with random samples enabled the genotype associated with a specific profile to be established. Fig. 2 illustrates several distinctive profiles and identifies the genotypes associated with each profile. Fig. 2A shows the various profiles observed when 94 random purified DNA samples were assessed along with a control sample with homozygous deletion of SMN1 exon 7. No amplification product was observed in a “no template” control reaction. Fig. 2B displays profiles from an SMA-affected patient with homozygous deletion of SMN1 exon 7 and profiles in which SMN1 is present without SMN2 copies. In these 2 cases, the simple melting peaks formed represent only the product amplified from the SMN2 gene (affected) or only the product amplified from the SMN1 gene (no SMN2 copies, phenotypically normal). The profile generated by SMA-affected patients is produced by amplification of the SMN2 gene only, and the peak is characteristic of the PCR product having a T:A base pair at position c.840. Likewise, when the genotype does not contain the SMN2 gene, the peak is characteristic of the PCR product from an SMN1 gene having a C:G base pair at c.840. The alternative peaks are created by a difference in G:C content of < 2% (1 bp in 53). Fig. 2C illustrates the profiles generated by samples with 2 SMN1 copies in the context of 1, 2, or 3 SMN2 copies. All clusters of profiles shared a common high-temperature melting peak that varied in intensity but had a similar melting temperature. This peak was created by melting a mixture of fully base-paired fragments from SMN1 (C:G base pair at c.840) and SMN2 (T:A base pair at c.840). The prominence of the trailing low-temperature peak varies substantially between the clusters of profiles, and the low-temperature peak is generated by heteroduplex molecules. Stoichiometric differences between the numbers of SMN1 and SMN2 copies dictate heteroduplex formation and thus the magnitude of the trailing peak. Fig. 2D highlights distinctive profiles in which the high-temperature peak is shifted to a lower temperature than observed in Fig. 2C. Note that Fig. 2C has a profile representing a genotype of 2 SMN1 copies and 2 SMN2 copies (red profiles), which is included for comparison. The remaining profiles are generated by SMN1 deletion carriers, but the profile shape is further modified by the number of SMN2 copies. Once again, there is a variably prominent but relatively consistent high-temperature peak, and the prominence of the trailing peak is modified by the number of SMN2 copies. The genotype associated with individual profiles is identified. Fig. 2D shows 6 carrier profiles, which is a larger number of profiles than one would expect among 94 random samples; however, this was the observation for this sample set. Fig. 2E shows the assessment of 94 random DNA samples prepared from NBS DBS and a sample with homozygous deletion of SMN1. The clusters of profiles (i.e., genotypes) are essentially identical to those observed in Fig. 2, A–D. Additionally, there are 2 carrier profiles (brown and blue/gray profiles) that are more consistent with a carrier frequency of 1 in 50. None of the 1000 random DBS generated a profile indicative of homozygous SMN1 deletion. The test was also assayed with DNA prepared from 100 mock DBS created by spotting blood on Whatman 903 filter paper.
Fig. 2. Melting profiles from the SMA NBS test.

(A), Profiles for 94 randomly selected purified DNA samples and 1 DNA sample of homozygous SMN1 deletion. (B), Profiles for a DNA sample with homozygous SMN1 deletion and DNA samples without SMN2. (C), DNA samples with 2 SMN1 copies and 2, 3, or 4 SMN2 copies. (D), SMN1 deletion carriers. For comparison, the profile for 2 SMN1 copies and 2 SMN2 copies is included. SMN1 deletion carriers with 2, 3, and 4 copies of SMN2 are shown. (E), Profiles for 94 newborn dried blood spots and 1 sample homozygous for SMN1 deletion (profile colors are as for profiles identified in panels A–D). −dF/dT, negative derivative of fluorescence with respect to temperature.
Molecular melt calibration is a tool that tightens the clustering among like melting profiles and increases the resolution between unlike profiles. Previously described means of calibration used 2 melting signals and required 2 pairs of complementary oligonucleotides (4 oligonucleotides total) (20, 21). Generating useful calibration melt signals required costly gel-purified oligonucleotides. In the SMA test, we achieved calibration by a simpler and far more economical means, which used a single calibration signal produced with a single oligonucleotide capable of forming a hairpin structure (see Fig. 1 in the Data Supplement that accompanies the online version of this article at http://www.clinchem.org/content/vol58/issue6). Furthermore, the fact that the hairpin oligonucleotide was unpurified (salted out) makes it very inexpensive (adding <$0.001 to the assay cost).
SMN2 COPY NUMBER DETERMINATION IN SAMPLES HOMOZYGOUS FOR SMN1 DELETIONS
Homozygous SMN1 deletion is the most frequently observed genotype in SMA-affected patients; however, the SMN2 copy number has prognostic utility with respect to disease presentation (22, 23). A low number of SMN2 copies is often associated with a more severe disease phenotype and early onset. Fig. 3 displays the assessments for 3 samples with homozygous SMN1 deletion that were assayed directly (pale blue profiles) and for the same 3 samples assayed after co-PCR of a mixture of 1 volume of a sample and 1 volume of a DNA sample that has 1 copy each of SMN1 and SMN2. Co-PCR of a sample with homozygous SMN1 deletion with a sample having 1 SMN1 copy artificially creates a profile like that of an SMN1 deletion carrier. Similar to the profile in Fig. 2D, the number of SMN2 copies (in the patient sample) modifies the shape of the profile by dictating the formation of heteroduplexes. The control profiles in Fig. 3 (dark blue, brown, olive) are for control heterozygous SMN1 deletion carriers with characterized numbers of SMN2 copies. After co-PCR, the shape of the melting profile for the samples with homozygous SMN1 deletion (red, green, purple) aligns to a control SMN1 deletion carrier. Subtracting 1 SMN2 copy (provided by the sample used for co-PCR) allows the determination of SMN2 copy number in the sample with homozygous SMN1 deletion. The SMN2 copy number for the sample with homozygous SMN1 deletion is determined according to the following equation: (SMN2 copy number of aligned profile) − 1 = (SMN2 copy number in SMN1 deletion sample). The co-PCR profiles in Fig. 3 are for samples with homozygous SMN1 deletions containing 1 copy (purple profile), 2 copies (green profile), and 3 copies (red profile) of SMN2.
Fig. 3. Co-PCR for modifying melt profiles of homozygous SMN1 deletion and revealing SMN2 copy number by assessment of profile shape.
Three unique SMN1 homozygous deletion samples without co-PCR (pale blue). Blue, brown, and olive profiles are SMN1 deletion controls with 4, 3, and 2 SMN2 copies, respectively. Red, green, and purple profiles are modified melting profiles of samples homozygous for SMN1 deletion after co-PCR, revealing the numbers of SMN2 copies via alignment with controls. The profile for zero SMN2 copies (gray) is presented for comparison. −dF/dT, negative derivative of fluorescence with respect to temperature.
Discussion
Natural history studies, along with the development of new therapeutic modalities and effective tests, will legitimize NBS for additional disorders. In instances for which no biochemical genetic disease marker is available, DNA testing may be the best approach. The justification to include SMA in NBS is incomplete, because the evidence that presymptomatic treatment regimens are efficacious has not been fully validated. The DNA assay described in this study holds promise for identifying presymptomatic SMA-affected patients, which would facilitate the testing of treatment regimens.
The complexity of the SMN1/SMN2 locus at 5q13 leads to genetic diversity in copy number and thus numerous melting configurations (Fig. 2) (4). With respect to SMA, phenotypically normal individuals may have 0–6 copies of SMN2 and 1–4 copies of SMN1. As Fig. 2 demonstrates, the stoichiometric differences between SMN1 and SMN2 cause both normal individuals and SMN1 deletion carriers to generate melting profiles of several unique shapes. Fortunately, the homozygous SMN1 deletion observed in 95%–98% of SMA-affected patients produces a distinctive profile, with no similarities to the profiles of other genotypes. Because SMA is a pure autosomal recessive trait with deletion carrier status, the lack of SMN2 and variance in SMN1/SMN2 copy number have no clinical phenotype (4). Therefore, the only profile of interest during the course of routine screening is that of homozygous SMN1 deletion (Fig. 2).
Approximately 5% of SMA-affected patients do not have homozygous SMN1 deletion (4, 24). These rare patients have an SMN1 gene deletion on one chromosome and an SMN1 point mutation on the second chromosome. The test we have described will not identify this category of SMA-affected patients. In affected patients of this type, the majority would create a profile consistent with an SMN1 deletion carrier (Fig. 2D). Among samples with a genotype containing only SMN1 (Fig. 2B, green profiles), a small number of SMN1 deletion carriers will be represented. In most instances, they will be nothing more than phenotypically normal carriers. Another group of phenotypically normal deletion carriers that the test will not recognize is the group with a deletion on one chromosome and 2 SMN1 copies on the other, although this situation is irrelevant to NBS. Given that SMA affects approximately 1 in 10 000 births, the Hardy–Weinberg equilibrium would predict the carrier frequency to be approximately 1 in 50. Consequently, the rare SMA patient with a deletion and a point mutation would be observed at a frequency of slightly less than 1 in 4000 carrier profiles. A secondary assessment of the SMN1 gene in deletion carriers would be required to identify SMA-affected patients who are not homozygous for SMN1 deletion. When the SMA assay we have described is applied to NBS, it will be necessary to state that negative test results do not guarantee a patient is not SMA affected and that a residual risk of 1 in 200 000 remains.
The number of SMN2 copies often has prognostic value regarding the severity of SMA disease presentation, with a milder presentation being associated with a larger number of SMN2 copies (22, 23, 25, 26). The profile generated by a sample with homozygous SMN1 deletion displays a simple melting peak associated with the presence of only the SMN2 gene and the T:A base pair at position c.840 (Fig. 2). All samples with homozygous SMN1 deletions will generate the peak observed in Fig. 2, independently of the number of SMN2 genes providing template for the amplification. SMN1 deletion carriers generate distinctive profiles that depend on the SMN2 copy number (Fig. 2). SMN1 deletion carriers within the context of 1–5 SMN2 copies create readily resolved profiles (Fig. 2D). The ability to generate distinctive profiles was leveraged, via co-PCR, to reveal the number of SMN2 copies in samples homozygous for SMN1 deletion. In essence, co-PCR creates heterozygosity for SMN1 deletion, and the SMN2 copy number defines the shape of the profile. Fig. 3 shows profiles for 3 SMA-affected patients before co-PCR (pale blue profiles) and after co-PCR (red, green, and purple profiles). Note that all profiles are identical without co-PCR but are distinctive after co-PCR, and these profiles align with profiles for SMN1 deletion carriers with defined numbers of SMN2 copies. Matching the profile from a co-PCR to that of an SMN1 deletion carrier with a known number of SMN2 copies allows the number of SMN2 copies in the patient to be determined. Co-PCR is a simple means to determine SMN2 copy number in patients homozygous for SMN1 deletion. We previously used similar co-PCR procedures in melt profiling tests to better resolve sequence variation in hemizygous males with X-linked ornithine transcarbamylase deficiency and to resolve homozygous mutations in phenylalanine hydroxylase–deficient phenylketonuria (18, 19). NBS is tasked with differentiating individuals who may be affected by a screenable disorder from those who are not. Because the determination of SMN2 copy number is a prognostic test, it is not within the purview of NBS laboratory determination of SMN2 copy number by co-PCR, and melt profiling is an aspect of the described test that may have utility in clinical follow-up of screen-positive samples. Furthermore, the assessments shown in Fig. 3 used known quantities of DNA purified from liquid blood, not DNA samples derived from DBS. It is unlikely that DNA obtained from DBS would support the accurate determination of copy numbers. DBS are a cryptic source of DNA, and the isolation procedures used provide material that is often single-stranded, highly fragmented, and contaminated with RNA. For copy number determination, the DNA samples must be accurately quantified, and material from DBS is unsuitable.
We developed an SMA-screening system based on melt profiling, but another system that uses Luminex technology has been described (27, 28). Melt profiling is a homogeneous, streamlined system that requires no secondary manipulation of the PCR product after amplification. The Luminex technology requires multiple post-PCR manipulations. The amplification in our assay requires 50 min, after which the PCR plate is loaded into the melting instrument that ramps the temperature from 55 °C to 85 °C, a process that requires approximately 4 min. The straightforward data analysis requires an additional 4 min. The turnaround time for the melt profiling test (DNA preparation, plate setup, PCR, analysis) is approximately 2.5 h, whereas the turnaround time reported for the Luminex-based test is 4.2 h (27, 28). The total cost of reagents for the melt profiling test (DNA preparation, PCR, melt profiling dye, and so forth) is approximately $1.40/sample, whereas the reagent cost for the Luminex system is approximately $2.70/sample. We believe our system has the qualities (robust, inexpensive, fast turnaround) for facilitating prospective screening of SMA. A prospective SMA-screening pilot project to be initiated in 2012 will assess 400 000 newborns. In the course of that project, we will accurately determine sensitivity, specificity, positive predictive value, and negative predictive value.
Supplementary Material
Acknowledgments
Research Funding: University of Utah; S.F. Dobrowolski, National Institute of Child Health and Human Development (NIH); E.W. Naylor, subcontract from sponsoring NIH contract; K.J. Swoboda, National Institute of Child Health and Human Development (NIH).
Footnotes
Nonstandard abbreviations: NBS, newborn screening; SMA, spinal muscular atrophy; DBS, dried blood spots on filter paper; IRB, Institutional Review Board.
Human genes: SMN1, survival of motor neuron 1, telomeric; SMN2, survival motor neuron 2, centromeric.
Author Contributions: All authors confirmed they have contributed to the intellectual content of this paper and have met the following 3 requirements: (a) significant contributions to the conception and design, acquisition of data, or analysis and interpretation of data; (b) drafting or revising the article for intellectual content; and (c) final approval of the published article.
Authors’ Disclosures or Potential Conflicts of Interest: Upon manuscript submission, all authors completed the Disclosures of Potential Conflict of Interest form. Potential conflicts of interest:
Employment or Leadership: None declared.
Consultant or Advisory Role: F. Pouch-Downes, American College of Medical Genetics.
Stock Ownership: None declared.
Honoraria: None declared.
Expert Testimony: None declared.
Role of Sponsor: The funding organizations played no role in the design of study, choice of enrolled patients, review and interpretation of data, or preparation or approval of manuscript.
References
- 1.Chace DH. Mass spectrometry-based diagnostics: the upcoming revolution in disease detection has already arrived. Clin Chem. 2003;49:1227– 8. doi: 10.1373/49.7.1227. author reply 1228 –9. [DOI] [PubMed] [Google Scholar]
- 2.Chace DH, Kalas TA, Naylor EW. Use of tandem mass spectrometry for multianalyte screening of dried blood specimens from newborns. Clin Chem. 2003;49:1797– 817. doi: 10.1373/clinchem.2003.022178. [DOI] [PubMed] [Google Scholar]
- 3.Gerstel-Thompson JL, Wilkey JF, Baptiste JC, Navas JS, Pai SY, Pass KA, et al. High-throughput multiplexed T-cell–receptor excision circle quantitative PCR assay with internal controls for detection of severe combined immunodeficiency in population-based newborn screening. Clin Chem. 2010;56:1466–74. doi: 10.1373/clinchem.2010.144915. [DOI] [PubMed] [Google Scholar]
- 4.Kolb SJ, Kissel JT. Spinal muscular atrophy: a timely review. Arch Neurol. 2011;68:979– 84. doi: 10.1001/archneurol.2011.74. [DOI] [PMC free article] [PubMed] [Google Scholar]
- 5.Brzustowicz LM, Lehner T, Castilla LH, Penchaszadeh GK, Wilhelmsen KC, Daniels R, et al. Genetic mapping of chronic childhood-onset spinal muscular atrophy to chromosome 5q11.2–13. 3. Nature. 1990;344:540–1. doi: 10.1038/344540a0. [DOI] [PubMed] [Google Scholar]
- 6.Lefebvre S, Burglen L, Reboullet S, Clermont O, Burlet P, Viollet L, et al. Identification and characterization of a spinal muscular atrophy-determining gene. Cell. 1995;80:155– 65. doi: 10.1016/0092-8674(95)90460-3. [DOI] [PubMed] [Google Scholar]
- 7.Mailman MD, Heinz JW, Papp AC, Snyder PJ, Sedra MS, Wirth B, et al. Molecular analysis of spinal muscular atrophy and modification of the phenotype by SMN2. Genet Med. 2002;4:20– 6. doi: 10.1097/00125817-200201000-00004. [DOI] [PubMed] [Google Scholar]
- 8.Cartegni L, Hastings ML, Calarco JA, de Stanchina E, Krainer AR. Determinants of exon 7 splicing in the spinal muscular atrophy genes, SMN1 and SMN2. Am J Hum Genet. 2006;78:63–77. doi: 10.1086/498853. [DOI] [PMC free article] [PubMed] [Google Scholar]
- 9.Cartegni L, Krainer AR. Disruption of an SF2/ASF-dependent exonic splicing enhancer in SMN2 causes spinal muscular atrophy in the absence of SMN1. Nat Genet. 2002;30:377– 84. doi: 10.1038/ng854. [DOI] [PubMed] [Google Scholar]
- 10.Brahe C, Vitali T, Tiziano FD, Angelozzi C, Pinto AM, Borgo F, et al. Phenylbutyrate increases SMN gene expression in spinal muscular atrophy. Eur J Hum Genet. 2005;13:256–9. doi: 10.1038/sj.ejhg.5201320. [DOI] [PubMed] [Google Scholar]
- 11.Weihl CC, Connolly AM, Pestronk A. Valproate may improve strength and function in patients with type III/IV spinal muscular atrophy. Neurology. 2006;67:500–1. doi: 10.1212/01.wnl.0000231139.26253.d0. [DOI] [PubMed] [Google Scholar]
- 12.Hsu YY, Jong YJ, Tsai HH, Tseng YT, An LM, Lo YC. Triptolide increases SMN transcript and protein levels in human SMA fibroblasts and improves survival in SMA-like mice. Br J Pharmacol. doi: 10.1111/j.1476-5381.2012.01829.x. Epub ahead of print 2012 Jan 5. [DOI] [PMC free article] [PubMed] [Google Scholar]
- 13.Markowitz JA, Singh P, Darras BT. Spinal muscular atrophy: a clinical and research update. Pediatr Neurol. 2012;46:1–12. doi: 10.1016/j.pediatrneurol.2011.09.001. [DOI] [PubMed] [Google Scholar]
- 14.Lewelt A, Newcomb TM, Swoboda KJ. New therapeutic approaches to spinal muscular atrophy. Curr Neurol Neurosci Rep. 2012;12:42–53. doi: 10.1007/s11910-011-0240-9. [DOI] [PMC free article] [PubMed] [Google Scholar]
- 15.Swoboda KJ. Of SMN in mice and men: a therapeutic opportunity. J Clin Invest. 2011;121:2978–81. doi: 10.1172/JCI58752. [DOI] [PMC free article] [PubMed] [Google Scholar]
- 16.Swoboda KJ. Seize the day: newborn screening for SMA. Am J Med Genet A. 2010;152A:1605–7. doi: 10.1002/ajmg.a.33519. [DOI] [PubMed] [Google Scholar]
- 17.Heath EM, O’Brien DP, Banas R, Naylor EW, Dobrowolski S. Optimization of an automated DNA purification protocol for neonatal screening. Arch Pathol Lab Med. 1999;123:1154– 60. doi: 10.5858/1999-123-1154-OOAADP. [DOI] [PubMed] [Google Scholar]
- 18.Dobrowolski SF, Ellingson CE, Caldovic L, Tuchman M. Streamlined assessment of gene variants by high resolution melt profiling utilizing the ornithine transcarbamylase gene as a model system. Hum Mutat. 2007;28:1133– 40. doi: 10.1002/humu.20558. [DOI] [PubMed] [Google Scholar]
- 19.Dobrowolski SF, Ellingson C, Coyne T, Grey J, Martin R, Naylor EW, et al. Mutations in the phenylalanine hydroxylase gene identified in 95 patients with phenylketonuria using novel systems of mutation scanning and specific genotyping based upon thermal melt profiles. Mol Genet Metab. 2007;91:218–27. doi: 10.1016/j.ymgme.2007.03.010. [DOI] [PubMed] [Google Scholar]
- 20.Dobrowolski SF, Hendrick AT, van den Bosch BJ, Smeets HJ, Gray J, Miller T, Sears M. Identifying sequence variants in the human mitochondrial genome using high-resolution melt (HRM) profiling. Hum Mutat. 2009;30:891– 8. doi: 10.1002/humu.21003. [DOI] [PubMed] [Google Scholar]
- 21.Gundry CN, Dobrowolski SF, Martin YR, Robbins TC, Nay LM, Boyd N, et al. Base-pair neutral homozygotes can be discriminated by calibrated high-resolution melting of small amplicons. Nucleic Acids Res. 2008;36:3401– 8. doi: 10.1093/nar/gkn204. [DOI] [PMC free article] [PubMed] [Google Scholar]
- 22.Prior TW, Swoboda KJ, Scott HD, Hejmanowski AQ. Homozygous SMN1 deletions in unaffected family members and modification of the phenotype by SMN2. Am J Med Genet A. 2004;130A:307–10. doi: 10.1002/ajmg.a.30251. [DOI] [PMC free article] [PubMed] [Google Scholar]
- 23.Elsheikh B, Prior T, Zhang X, Miller R, Kolb SJ, Moore D, et al. An analysis of disease severity based on SMN2 copy number in adults with spinal muscular atrophy. Muscle Nerve. 2009;40:652– 6. doi: 10.1002/mus.21350. [DOI] [PubMed] [Google Scholar]
- 24.Alias L, Bernal S, Fuentes-Prior P, Barcelo MJ, Also E, Martinez-Hernandez R, et al. Mutation update of spinal muscular atrophy in Spain: molecular characterization of 745 unrelated patients and identification of four novel mutations in the SMN1 gene. Hum Genet. 2009;125:29–39. doi: 10.1007/s00439-008-0598-1. [DOI] [PubMed] [Google Scholar]
- 25.Watihayati MS, Fatemeh H, Marini M, Atif AB, Zahiruddin WM, Sasongko TH, et al. Combination of SMN2 copy number and NAIP deletion predicts disease severity in spinal muscular atrophy. Brain Dev. 2009;31:42–5. doi: 10.1016/j.braindev.2008.08.012. [DOI] [PubMed] [Google Scholar]
- 26.Jedrzejowska M, Borkowska J, Zimowski J, Kostera-Pruszczyk A, Milewski M, Jurek M, et al. Unaffected patients with a homozygous absence of the SMN1 gene. Eur J Hum Genet. 2008;16:930– 4. doi: 10.1038/ejhg.2008.41. [DOI] [PubMed] [Google Scholar]
- 27.Pyatt RE, Mihal DC, Prior TW. Assessment of liquid microbead arrays for the screening of newborns for spinal muscular atrophy. Clin Chem. 2007;53:1879– 85. doi: 10.1373/clinchem.2007.092312. [DOI] [PubMed] [Google Scholar]
- 28.Pyatt RE, Prior TW. A feasibility study for the newborn screening of spinal muscular atrophy. Genet Med. 2006;8:428–37. doi: 10.1097/01.gim.0000227970.60450.b2. [DOI] [PubMed] [Google Scholar]
Associated Data
This section collects any data citations, data availability statements, or supplementary materials included in this article.