

Abstract
Purpose
Immunotherapy is a standard of care for children with high-risk neuroblastoma, where bone marrow (BM) is the predominant metastatic site. Early response markers of minimal residual disease (MRD) in the BM that are also predictive of survival could help individualize patient therapies.
Patients and Methods
After achieving first remission (n = 163), primary refractory disease (n = 102), or second remission (n = 95), children with stage 4 neuroblastoma received anti-GD2 3F8 antibody immunotherapy. BM MRD before 3F8 treatment and after cycle 2 (postMRD) was measured using a four-marker panel (B4GALNT1, PHOX2B, CCND1, and ISL1) by quantitative reverse transcription polymerase chain reaction. Progression-free survival (PFS) and overall survival (OS) were estimated using the Kaplan-Meier method. Prognostic variables were tested in both univariable and multivariable analyses, and MRD markers were further assessed individually and in combination as binary composite (postMRD: 0 and 1) and as equal sum (postMRDSum: 0 to 4) using the Cox regression models, and their predictive accuracy was determined by the concordance index.
Results
When BM was evaluated after cycle 2, individual markers were highly predictive of PFS and OS. The prediction accuracy improved when they were combined in postMRDSum. A multivariable model taking into account all the variables significant in the univariable analyses identified postMRDSum to be independently predictive of PFS and OS. When the model for OS also included missing killer immunoglobulin-like receptor ligand, human antimouse antibody response, and the enrollment disease status, the concordance index was 0.704.
Conclusion
BM MRD after two cycles of immunotherapy was confirmed as an early response marker and a consistent independent predictor of survival.
INTRODUCTION
Curing patients with high-risk metastatic stage 4 neuroblastoma diagnosed at ≥ 18 months of age or with MYCN amplification was unthinkable 25 years ago. With dose intensification,1,2 anti-GD2 antibody plus cytokines,3,4 and isotretinoin,5 the outlook has greatly improved, with more than 50% progression-free survival (PFS) beyond 5 years is now possible. However, despite the large-scale unraveling of neuroblastoma genomics and biology,6 a robust signature to reliably predict long-term outcome after definitive therapy among these high-risk patients has yet to emerge. With the surge in the availability of novel targets and therapeutics, identifying early response markers for this orphan disease is critical, especially when the patients are treated in an adjuvant setting in the absence of clinical disease, where International Neuroblastoma Response Criteria7 or RECIST8 criteria are no longer applicable.
For patients with high-risk neuroblastoma, bone marrow (BM) metastasis is common at diagnosis (> 80%), and despite achieving complete remission, most patients will ultimately experience relapse in the BM. The presence of minimal residual disease (MRD) in the BM during remission was previously studied by immunocytology9–11; however, its sensitivity has not consistently matched those of quantitative polymerase chain reaction (PCR; serum MYCN and RASSF1a DNA12,13) or quantitative reverse transcription PCR (qRT-PCR) of tumor transcripts.14–19 Even though TH,20,21 PHOX2B,17,18,22 and B4GALNT1 (GD2 synthase)23,24 have repeatedly been identified as potential candidates, with few exceptions,25 the proof of their clinical utility as MRD markers was limited by the heterogeneity and the small size of the patient cohorts, the variable timing for MRD testing, the lack of multivariable analyses, and other confounding factors.
In this report, BM MRD detected after two treatment cycles of anti-GD2 antibody 3F8 immunotherapy was evaluated as an early response prognostic marker. High-risk patients with metastatic stage 4 neuroblastoma diagnosed at ≥ 18 months of age or with MYCN amplification were enrolled onto the adjuvant setting at the time of either their first remission or second remission (with no clinical evidence of disease) or when primary refractory neuroblastoma remained. We addressed the question of how many markers were necessary and whether each marker (B4GALNT1, PHOX2B, CCND1, and ISL1) individually carried equal predictive accuracy when compared with the marker panel. We further determined whether our early response markers had independent prognostic significance in a multivariable model, taking into account host and tumor factors.
PATIENTS AND METHODS
Patient Characteristics
Patients received induction therapy based on the Memorial Sloan Kettering Cancer Center or Children's Oncology Group regimens.5,26–28 Once disease status was confirmed according to International Neuroblastoma Response Criteria,7 institutional review board–approved informed consent was obtained for treatment at Memorial Sloan Kettering Cancer Center using 3F8 alone (1988 to 2000)29 or 3F8 and oral 13-cis-retinoic acid plus granulocyte-macrophage colony-stimulating factor given intravenously (1999 to 2003)4,30 or subcutaneously (2003 to 2008).4,31 In this report, MRD analysis included the following three clinical cohorts of patients with stage 4 neuroblastoma diagnosed at ≥ 18 months of age or with MYCN amplification: first remission (n = 163), primary refractory (n = 102), and second remission (n = 95; Appendix Table A1, online only). 3F8 treatment cycles were repeated every 1 to 3 months over 2 years as long as the human antimouse antibody (HAMA) titer was negative. The median follow-up time and the number of 3F8 cycles according to the clinical protocols are listed in Appendix Table A2 (online only). Disease status was evaluated at enrollment and periodically as previously described.4,31
BM MRD Detection by qRT-PCR
Heparinized aspirates samples pooled from four BM sites were used for MRD measurement.9,17,24 They included BM samples before 3F8 (preMRD) and after two cycles of immunotherapy (postMRD). The selection of cyclin D1 (CCND1), ISL LIM homeobox 1 (ISL1), and paired-like homeobox 2b (PHOX2B) identified by gene expression profiling was based on their sensitivity, specificity, and prognostic significance.17 B4GALNT1 (GD2 synthase), previously shown to predict survival outcome,23,24 was added as the fourth marker. Gene expression assays for the four-marker panel were from Applied Biosystems (Foster City, CA; B4GALNT1: Hs00155195_m1; CCND1: Hs00277039_m1; ISL1: Hs00158126_m1; PHOX2B: Hs00243679_m1; β2M: 4326319E). All samples were run in duplicates for 40 cycles by qRT-PCR using the Applied Biosystems Sequence Detection System 7300. BM was classified as marker positive if the gene transcript level was greater than the upper limit of normal, defined as mean plus two standard deviations of normal BM and blood samples.17 The four-marker panel was scored as positive if at least one of the four markers were positive and negative if all four markers were negative (binary variables: 0 and 1).4,31 FCGR2A polymorphism, HLA, and killer immunoglobulin-like receptor (KIR) genotyping were carried out as previously described.32–34
Statistical Analysis
Associations between categorical and continuous variables and the three clinical cohorts were tested using the Fisher's exact test and Kruskal-Wallis test, respectively. The clinical end points evaluated were PFS and overall survival (OS) from the date of postMRD measurement. Thirty-one patients in first remission or with primary refractory disease who experienced relapse after 3F8 immunotherapy received 3F8 again during second remission. To avoid counting these patients twice, they were removed from the second remission cohort for the PFS analysis and from the first remission or primary refractory group for the OS analysis, in order to have immunotherapy as the only treatment before the event of progression or death, respectively. Also excluded from the PFS analysis were 10 patients whose postMRD values were measured on their progression/censoring date.
The Kaplan-Meier method was used to estimate the survival probabilities, and the Cox proportional hazards regression model (likelihood ratio test) or the log-rank test was used to test the univariable associations between variables and PFS or OS. A multivariable Cox regression model was fitted with variables that had a univariable P < .05, and the final model also excluded variables that were no longer significant in the presence of others.
The accuracy of the prognostic models was assessed using the concordance index (c-index),35 a generalization of area under the curve for survival data. The c-index is equal to the proportion of pairs of patients where the predicted time to event is larger for a patient who actually has a longer time to event; a c-index of 0.5 indicates a toss-up, and a c-index of 1 indicates a perfect predictor. The final multivariable models were assessed using the bootstrap-adjusted c-index to account for potential overfitting. We drew a bootstrap sample of the data, fitted the new model, and evaluated it on this bootstrap sample and on the original data set. The difference between these two c-indices, averaged over 1,000 bootstrap samples, was our estimate of the overfitting bias. We subtracted it from the original c-index to obtain the bootstrap-adjusted c-index35; this was implemented by using the function “validate” in the R library package “rms.”
HAMA was used as a time-dependent covariate in the Cox model. Because there are no publicly available methods to calculate c-index of the Cox model with time-dependent covariates, we chose to run a landmark analysis at 6 months to evaluate the model's accuracy.36 Here, only patients who were still at risk at 6 months were included, and HAMA before 6 months was used as a binary variable. To determine the best combination of the four MRD markers, we calculated a sum of all the binary postMRD markers using equal weights, defined as postMRDSum, with the value between 0 and 4. Moreover, to find the best weighted sum of the markers, we performed the elastic net analysis37 on a random 61% of the data as a discovery set and evaluated it on the remaining samples as the validation set. All statistical analyses were done using R (http://www.R-project.org/).38
RESULTS
Univariable Analysis of Prognostic Factors
The patient characteristics among first remission, second remission, and primary refractory clinical groups were significantly different for the age at diagnosis, MYCN amplification, the presence of bone and BM metastases, BM MRD before (preMRD) and after two cycles of immunotherapy (postMRD), and the route of granulocyte-macrophage colony-stimulating factor administration (Appendix Table A1). PostMRD was consistently important as a prognostic factor for PFS and OS (Table 1). The prognostic impact of postMRD using the four-marker panel on OS was stratified according to the three clinical groups (Fig 1). PostMRD was significantly associated with OS in every cohort (P < .001, P < .001, and P = .003 in first remission, second remission, and primary refractory groups, respectively). PostMRD-negative patients who were treated in first remission had a better OS than those treated in second remission or with primary refractory disease (P = .02), whereas among postMRD-positive patients, the three cohorts had similar OS (P = .3). Among the second remission cohort, there was no significant difference in OS between the patients who received prior 3F8 treatment and those who did not (P = .81). When postMRD was negative, PFS was also significantly different among the three clinical groups (P = .02; Appendix Fig A1, online only). When postMRD was positive, the median PFS was short and not significantly different among the three cohorts (P = .13); median PFS times were 7.4 months (95% CI, 2.8 to 10.1 months) for first remission, 8.1 months (95% CI, 4.7 to 22.1 months) for primary refractory disease, and 2.7 months (95% CI, 1.9 to 15.4 months) for second remission.
Table 1.
Univariable Analyses Using Progression-Free Survival and Overall Survival as End Points

| Variable | Progression-Free Survival |
Overall Survival |
||||||
|---|---|---|---|---|---|---|---|---|
| Patients (n = 319) |
No. of Events (n = 176) | P | Patients (n = 329) |
No. of Events (n = 147) | P | |||
| No. | % | No. | % | |||||
| Age, months | .120 | .086 | ||||||
| < 18 | 21 | 7 | 7 | 23 | 7 | 5 | ||
| ≥ 18 | 298 | 93 | 169 | 306 | 93 | 142 | ||
| Sex | .226 | .103 | ||||||
| Male | 191 | 60 | 101 | 196 | 60 | 81 | ||
| Female | 128 | 40 | 75 | 133 | 40 | 66 | ||
| MYCN | .252 | .318 | ||||||
| Not amplified | 215 | 67 | 125 | 223 | 68 | 105 | ||
| Amplified | 104 | 33 | 51 | 106 | 32 | 42 | ||
| LDH, U/L | .567 | .320 | ||||||
| < 1,500 | 170 | 53 | 97 | 169 | 51 | 73 | ||
| ≥ 1,500 | 85 | 27 | 44 | 90 | 27 | 42 | ||
| Bone | .206 | .173 | ||||||
| No | 73 | 23 | 35 | 73 | 22 | 27 | ||
| Yes | 246 | 77 | 141 | 256 | 78 | 120 | ||
| BM | .886 | .169 | ||||||
| No | 48 | 15 | 26 | 49 | 15 | 16 | ||
| Yes | 271 | 85 | 150 | 280 | 85 | 131 | ||
| FCGR2A polymorphism | .193 | .282 | ||||||
| HH | 83 | 26 | 49 | 86 | 26 | 43 | ||
| RH or RR | 236 | 74 | 127 | 243 | 74 | 104 | ||
| FCGR3A polymorphism | .116 | .183 | ||||||
| FF | 145 | 45 | 87 | 150 | 46 | 73 | ||
| FV or VV | 174 | 55 | 89 | 179 | 54 | 74 | ||
| Missing KIR ligand | .136 | .045 | ||||||
| Unfavorable | 111 | 35 | 67 | 114 | 35 | 60 | ||
| Favorable | 208 | 65 | 109 | 215 | 65 | 87 | ||
| HAMA (before progression) | .067 | < .001 | ||||||
| No | 87 | 27 | 58 | 90 | 27 | 58 | ||
| Yes | 232 | 73 | 118 | 239 | 73 | 89 | ||
| PreMRD | .030 | .464 | ||||||
| Negative | 192 | 60 | 95 | 204 | 62 | 87 | ||
| Positive | 126 | 39 | 80 | 124 | 38 | 59 | ||
| PostMRD | < .001 | < .001 | ||||||
| Negative | 236 | 74 | 99 | 245 | 74 | 81 | ||
| Positive | 83 | 26 | 77 | 84 | 26 | 66 | ||
| Route of GM-CSF | .930 | .066 | ||||||
| No GM-CSF | 41 | 13 | 22 | 40 | 12 | 23 | ||
| Intravenous | 60 | 19 | 33 | 63 | 19 | 37 | ||
| Subcutaneous | 218 | 68 | 121 | 226 | 69 | 87 | ||
| Clinical group | < .001 | .029 | ||||||
| First remission | 163 | 51 | 76 | 145 | 44 | 58 | ||
| Second remission | 61 | 19 | 37 | 95 | 29 | 45 | ||
| Primary refractory | 95 | 30 | 63 | 89 | 27 | 44 | ||
NOTE. Significant differences among clinical groups were tested using the log-rank test. Ten patients whose postMRD values were measured on their progression/censoring date were excluded from progression-free survival analysis.
Abbreviations: BM, bone marrow; GM-CSF, granulocyte-macrophage colony-stimulating factor; HAMA, human antimouse antibody; LDH, lactate dehydrogenase; preMRD, bone marrow minimal residual disease before immunotherapy; postMRD, bone marrow minimal residual disease after two cycles of immunotherapy.
Fig 1.
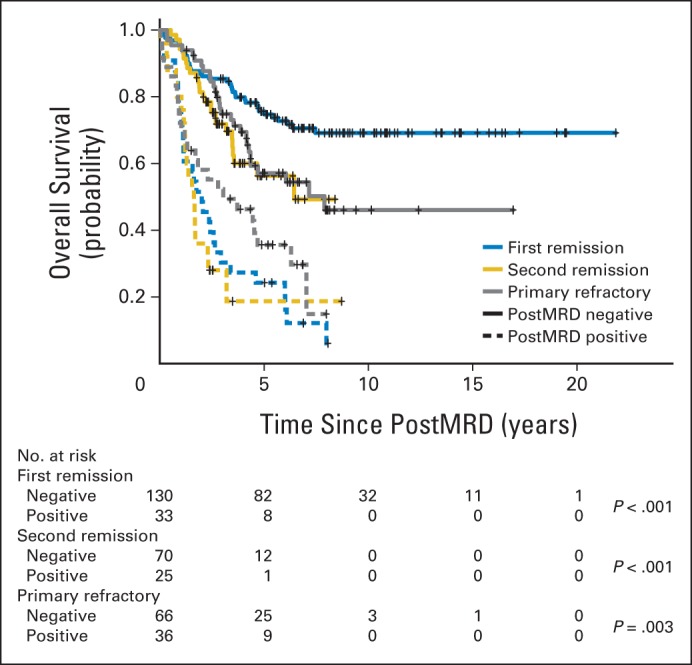
Prognostic impact of minimal residual disease after cycle 2 (postMRD) using the four-marker panel on overall survival stratified according to the clinical groups, including the number of at-risk patients. PostMRD is the composite of the four-marker panel, where negative indicates that all markers are negative and positive indicates that at least one marker is positive. Log-rank P values testing the effect of postMRD on overall survival in each clinical group are included.
Effect of Individual MRD Markers on PFS and OS Among the Three Clinical Groups
Associations between individual MRD markers and survival outcomes are listed in Appendix Table A3 (online only). Only pre-PHOX2B positivity before immunotherapy correlated with adverse PFS in the primary refractory cohort (P = .007), whereas none of the four preMRD markers had any significant influence on OS. In contrast, all four individual postMRD markers were highly significant (P < .001), as shown in the Kaplan-Meier PFS and OS plots (Fig 2 and Appendix Fig A2, online only, respectively).
Fig 2.

Prognostic impact of individual postMRD marker positivity on progression-free survival, including the number of at-risk patients: (A) post-B4GALNT1; (B) post-PHOX2B; (C) post-CCND1; and (D) post-ISL1. Except for post-CCND1 in the second remission cohort (P = .02), the log-rank P value for every other individual marker in each clinical group was P < .001. PostMRD, minimal residual disease after cycle 2 of 3F8.
Pairwise Correlations Between Individual PreMRD and PostMRD Markers
Three individual heat maps of pairwise P values for all preMRD and postMRD markers are shown in Figure 3. Positive correlation with P ≤ .05 suggests that being positive in one marker would imply a higher chance of being positive in another marker. Irrespective of the clinical groups, pretreatment individual markers were strongly correlated, as were individual markers after cycle 2. However, strong correlations among preMRD and postMRD markers were only observed in the primary refractory cohort (ie, a patient whose pretreatment BM was positive in a specific marker had a higher chance of having the same marker be positive in the BM after cycle 2).
Fig 3.

Pairwise correlations between minimal residual disease (MRD) markers (preMRD and postMRD) among the three clinical cohorts. postMRD, MRD measured after two cycles of 3F8; preMRD, MRD measured before 3F8.
Improving Predictive Accuracy With Alternative Models to Combine Individual MRD Markers
To find a more informative predictor than postMRD, which was a binary variable of 0 (all four markers were negative) and 1 (at least one of the four markers was positive), we created a composite sum called postMRDSum, which gave equal weights to the individual postMRD markers, with a value of 0, 1, 2, 3, or 4. PostMRDSum was a highly significant predictor of PFS and OS for all three clinical cohorts, with much smaller P values than postMRD (Table 2). A PostMRDSum of 0 was the most favorable PFS predictor for all three cohorts (Appendix Fig A3, online only), while positivity in all four markers had the most adverse prognostic impact for OS among the primary refractory patients (Appendix Fig A4, online only).
Table 2.
Improving Predictive Accuracy With an Alternative Model to Combine Individual MRD Markers

| Clinical Group and Outcome | PostMRD |
PostMRDSum |
||||
|---|---|---|---|---|---|---|
| P | HR | 95% CI | P | HR | 95% CI | |
| OS | ||||||
| Primary refractory | 4.00E-03 | 2.24 | 1.29 to 3.90 | 3.63E-07 | 1.71 | 1.39 to 2.10 |
| First remission | 4.20E-12 | 5.83 | 3.54 to 9.60 | 2.48E-13 | 2.17 | 1.76 to 2.66 |
| Second remission | 7.09E-06 | 4.08 | 2.21 to 7.53 | 1.80E-08 | 2.08 | 1.61 to 2.69 |
| PFS | ||||||
| Primary refractory | 9.88E-06 | 3.12 | 1.88 to 5.17 | 3.65E-09 | 1.88 | 1.52 to 2.31 |
| First remission | 1.37E-12 | 5.62 | 3.49 to 9.07 | 5.57E-14 | 2.31 | 1.85 to 2.87 |
| Second remission | 4.00E-04 | 2.74 | 1.57 to 4.80 | 5.70E-06 | 1.85 | 1.42 to 2.42 |
NOTE. PostMRD was a binary composite where 0 indicates that all markers are negative and 1 indicates that at least one marker is positive. PostMRDSum gave equal weights to each of the four markers with a value of 0, 1, 2, 3, or 4.
Abbreviations: HR, hazard ratio; MRD, minimal residual disease; OS, overall survival; PFS, progression-free survival; postMRD, bone marrow minimal residual disease after two cycles of immunotherapy.
The accuracy of these prognostic models was assessed using the c-index. As shown in Appendix Table A4 (online only), postMRD was a better predictor of PFS than any individual marker for all three clinical groups, and it was superior in OS for first and second remission. Compared with postMRD, postMRDSum had a substantially better predictive accuracy in PFS and OS, with the highest increase in the primary refractory cohort. We also determined the predictive accuracy of the weighted sum of the markers by performing the elastic net model for OS on a random discovery set (61% of the patients), using the remaining samples for validation. The c-index was 0.663, compared with 0.660 when postMRDSum was used. Because the difference was minimal, we selected postMRDSum as the final marker, given its simplicity and robustness irrespective of sample cohorts.
To rank the relative importance of each of the four markers, we refitted multivariable models for OS of the combined patient cohort (after adjusting for cohort effect) using the leave-one-marker-out strategy. B4GALNT1 seemed to be the most important marker, because leaving it out resulted in the largest reduction of c-index to 0.661, whereas the exclusion of ISL1, CCND1, and PHOX2B resulted in c-indices of 0.680, 0.683, and 0.693, respectively. When PFS was used as the end point, the ranking changed slightly; the most important marker became ISL1 (c-index reduced to 0.668), followed by CCND1 (c-index, 0.680), B4GALNT1 (c-index, 0.681), and PHOX2B (c-index, 0.684). These differences, however, were quite small.
Multivariable Analysis of Prognostic Risk Factors
Multivariable models (Table 3) were fitted using all the variables that were significant in the univariable setting with P < .05 (Table 1). PreMRD was excluded from the final PFS model because it was no longer significant (P = .65) in the presence of two variables, namely postMRDSum and disease status at protocol entry, both being adverse independent predictors for PFS and OS. In contrast, having missing KIR ligand and HAMA response were favorable prognostic factors for OS. The bootstrap-adjusted c-index for the PFS model shown in Table 3 was 0.687, which was superior to the models with only disease status at enrollment (c-index, 0.57). The OS model refitted with HAMA at 6 months had a bootstrap-adjusted c-index of 0.704, whereas for the models without MRD markers or with binary postMRD markers, the c-indices were lower (0.568 and 0.701, respectively).
Table 3.
Multivariable Model for PFS and OS for Three Clinical Groups According to Disease Status at Enrollment to Immunotherapy

| Multivariable Model | P | HR | 95% CI |
|---|---|---|---|
| PFS | |||
| PostMRDSum | < .001 | 2.03 | 1.77 to 2.32 |
| Second remission v first remission | .003 | 1.81 | 1.22 to 2.7 |
| Primary refractory v first remission | .24 | 1.23 | 0.87 to 1.76 |
| OS | |||
| PostMRDSum | < .001 | 2.06 | 1.81 to 2.36 |
| Second remission v first remission | .015 | 1.65 | 1.17 to 2.47 |
| Primary refractory v first remission | .98 | 1.00 | 0.66 to 1.52 |
| Missing KIR ligand | .011 | 0.65 | 0.46 to 0.90 |
| HAMA response | < .001 | 0.43 | 0.30 to 0.62 |
Abbreviations: HAMA, human antimouse antibody; HR, hazard ratio; OS, overall survival; PFS, progression-free survival; postMRD, bone marrow minimal residual disease after two cycles of immunotherapy.
DISCUSSION
Cancer immunotherapy, in particular the use of monoclonal antibodies to target malignant cells, has shown tremendous potential in the clinic, especially when the patients are treated at the time of MRD. For patients with high-risk neuroblastoma, immunotherapy has become a standard of care, ideally given in an adjuvant setting with disease undetectable by conventional histologic and radiographic tools. Finding an early response marker that is predictive of survival is particularly relevant, because alternative treatment options could be provided for a subset of patients who do not benefit from this therapy. For high-risk neuroblastoma, few MRD markers have been discovered using an unbiased genome-wide profiling approach. Although marker panels are often advocated, their individual performances (predictive accuracy) versus the combined panel have not been vigorously tested in the appropriate clinical setting. Furthermore, few studies perform multivariable analyses to confirm the independent significance of MRD or to compare its performance in the bigger context of the established predictors in other cancer types.
In this report, we evaluated BM MRD among patients with high-risk metastatic stage 4 neuroblastoma who were diagnosed at ≥ 18 months of age or with MYCN amplification. The patients were categorized into three clinical groups based on their disease status before start of 3F8 immunotherapy; all patients had no (first remission and second remission) or minimal (primary refractory) clinical evidence of disease. Because BM is a prevalent metastatic site, our four-marker panel including PHOX2B, ISL1, and CCND1 (identified previously by genome-wide marker discovery strategy) and B4GALNT1 (GD2 synthase) was used to measure BM MRD at two time points, namely before 3F8 immunotherapy and after two cycles of 3F8, while patients continued to receive 3F8 for up to 2 years. Using multivariable analyses accounted for tumor and patient variables, we showed that MRD, composed of qRT-PCR measurements of these four markers, was an early response marker after two cycles of anti-GD2 antibody 3F8 and was a highly significant independent predictor of PFS and OS. Given the fact that the pre-3F8 MRD status had no impact on survival, 3F8 therapy changed the pretreatment disease status to a true remission status predictive of long-term outcome, a strong suggestion that MRD elimination by 3F8 immunotherapy could be permanent.
We observed that with a better quality of remission (first remission cohort), it did not matter which preMRD marker was positive; any of the four markers could turn positive if the immunotherapy failed. In contrast, with a lower quality of remission (primary refractory disease), MRD was likely to be found in the same marker in the BM before and after cycle 2. We interpret these results to mean that in the primary refractory group, if neuroblastoma was not eradicated and regrew, the same positive markers re-emerged. In contrast, neuroblastoma in the first remission cohort was indeed eradicated in the BM, and recurrence likely reflected a new lesion. The second remission cohort behaved more like the first remission cohort than the primary refractory cohort.
Although individual markers tested after two cycles of 3F8 were predictive of outcome, the binary composite postMRD marker defined as either all negative or at least one positive showed a superior predictive accuracy. The composite marker created as the equal sum of the four postMRD markers (postMRDSum) was even better than postMRD. These findings support the hypothesis that a single marker could not perform as well as a multiple-marker panel, although B4GALNT did rank highest among the four markers in the leave-one-out OS analysis. We expect that the magnitude of MRD positivity (qRT-PCR units) could be exploited to further refine the predictive models.
The potential of BM MRD measurement in personalized medicine,39 where prognostic and early response biomarkers are of particular relevance, was also evident in this study. For anti-GD2 antibody immunotherapy, prognostic analyses have implicated the quality of remission at the beginning of immunotherapy (ie, disease status at enrollment), KIR mismatch (facilitating unlicensed natural killer cells to kill tumor cells), and HAMA response (which may have served as a surrogate marker of an anti-idiotype network in prolonging the antitumor effect).40 BM MRD after two cycles of 3F8 was the only consistent early response predictor. The bootstrap-adjusted c-indices combining all of the independently significant variables with postMRDSum (0.687 for PFS and 0.704 for OS) compared favorably with other predictive models (eg, c-index of 0.69 in the Kattan nomograms for prostate cancer relapse).41 Analogous to the concept of liquid biopsy (either cell free DNA42 or circulating tumor cells43) for hematogenous metastasis, BM is a well-known depot and flight path for leukemias and neuroblastoma. Indeed, BM MRD is the strongest prognostic predictor for pediatric acute lymphoblastic leukemia, effectively taking into account the variations in dose and dose-intensity, pharmacogenomics, pharmacodynamics, tumor microenvironment, and compliance in individual patients.44 What is most compelling regarding acute lymphoblastic leukemia MRD is the timing of MRD measurement (ie, early in induction therapy). Early response markers provide a rapid assessment of patient-specific tumor response to treatment. Whether small molecules for breast cancer43 or immunotherapy for prostate cancer,45 such markers have been proposed to guide timely treatment modifications. For 3F8 antibody immunotherapy, postMRD biomarkers could provide a sensitive gauge if treatment modifications were to be individualized to avoid futile treatments with adverse effects and, more importantly, to initiate additional or alternative therapy to improve outcome.
Acknowledgment
We thank Brian Kushner, MD, Shakeel Modak, MD, Kim Kramer, MD, Stephen Roberts, MD, and Ellen Basu, MD, as well as our research nurses, Catherine Enero and Lea Gregorio; our data management staff, Elizabeth Chamberlain, Virginia Carbezon-Soriano, Samantha Leyco, and Daniela Sanchez; and our research staff, Yi Feng and Hoa Tran.
Glossary Terms
- bootstrap procedure:
a nonparametric statistical method to estimate sampling distributions of an estimator by resampling with a replacement from the original sample. In prognostic research, the bootstrap helps to obtain an impression of the validity of predictions in new but similar patients.
- concordance index (c-index):
the probability that given two randomly selected patients, the patient with the worst outcome is, in fact, predicted to have the worst outcome. The measure is similar to an area under the receiver operating characteristics curve and ranges from 0.5 (chance or coin flip) to 1.0 (perfect ability to rank patients).
- Cox proportional hazards regression model:
a statistical model for regression analysis of censored survival data, examining the relationship of censored survival distribution to one or more covariates. This model produces a baseline survival curve, covariate coefficient estimates with their standard errors, risk ratios, 95% CIs, and significance levels.
- immunotherapy:
a therapeutic approach that uses cellular and/or humoral elements of the immune system to fight a disease.
- landmark analysis:
the conditional landmark analysis selects a fixed time during follow-up as the landmark. The subset of patients still in the study at the landmark time is separated into categories described by the classifying event and observed forward in time. Patients who cease follow-up before the landmark time are excluded from the analysis, and membership in the classifying event group is defined at the landmark time regardless of any shifts that may occur later. In essence, the analysis clock is reset at the landmark.
- minimal residual disease (MRD):
the low level of tumor cells (eg, after chemotherapy) that can only be detected with highly sensitive molecular methods (eg, polymerase chain reaction) or to molecularly defined relapse after long-term remission.
- monoclonal antibody:
an antibody that is secreted from a single clone of an antibody-forming cell. Large quantities of monoclonal antibodies are produced from hybridomas, which are produced by fusing single antibody-forming cells to tumor cells. The process is initiated with initial immunization against a particular antigen, stimulating the production of antibodies targeted to different epitopes of the antigen. Antibody-forming cells are subsequently isolated from the spleen. By fusing each antibody-forming cell to tumor cells, hybridomas can each be generated with a different specificity and targeted against a different epitope of the antigen.
- prognostic factor:
a measurable patient characteristic that is associated with the subsequent course of disease (whether or not therapy is administered). The identification of a prognostic factor does not necessarily suggest a cause-and-effect relationship. However, within a suitable outcome model, the measurement of a prognostic factor contributes to an estimate of an outcome probability (eg, the probability of disease-free survival within a given time interval).
Appendix
Table A1.
Patient Characteristics Among the Three Clinical Groups (according to disease status at enrollment)

| Characteristic | All Patients (N = 360) |
First Remission (n = 163) |
Primary Refractory Disease (n = 102) |
Second Remission (n = 95) |
P | ||||
|---|---|---|---|---|---|---|---|---|---|
| No. of Patients | % | No. of Patients | % | No. of Patients | % | No. of Patients | % | ||
| Age, months | .012 | ||||||||
| < 18 | 25 | 7 | 11 | 7 | 2 | 2 | 12 | 13 | |
| ≥ 18 | 335 | 93 | 152 | 93 | 100 | 98 | 83 | 87 | |
| Sex | .828 | ||||||||
| Male | 215 | 60 | 100 | 61 | 59 | 58 | 56 | 59 | |
| Female | 145 | 40 | 63 | 39 | 43 | 42 | 39 | 41 | |
| MYCN | .003 | ||||||||
| Not amplified | 242 | 67 | 103 | 63 | 82 | 80 | 57 | 60 | |
| Amplified | 118 | 33 | 60 | 37 | 20 | 20 | 38 | 40 | |
| LDH, U/L | .871 | ||||||||
| < 1,500 | 189 | 52 | 90 | 55 | 57 | 56 | 42 | 44 | |
| ≥ 1,500 | 96 | 27 | 47 | 29 | 26 | 25 | 23 | 24 | |
| Bone | .021 | ||||||||
| No | 77 | 21 | 44 | 27 | 13 | 13 | 20 | 21 | |
| Yes | 283 | 79 | 119 | 73 | 89 | 87 | 75 | 79 | |
| BM | .001 | ||||||||
| No | 53 | 15 | 24 | 15 | 6 | 6 | 23 | 24 | |
| Yes | 307 | 85 | 139 | 85 | 96 | 94 | 72 | 76 | |
| FCGR2A polymorphism | .720 | ||||||||
| HH | 96 | 27 | 47 | 29 | 25 | 25 | 24 | 25 | |
| RH or RR | 264 | 73 | 116 | 71 | 77 | 75 | 71 | 75 | |
| FCGR3A polymorphism | .145 | ||||||||
| FF | 161 | 45 | 67 | 41 | 54 | 53 | 40 | 42 | |
| FV or VV | 199 | 55 | 96 | 59 | 48 | 47 | 55 | 58 | |
| Missing KIR ligand | .263 | ||||||||
| Unfavorable | 126 | 35 | 51 | 31 | 42 | 41 | 33 | 35 | |
| Favorable | 234 | 65 | 112 | 69 | 60 | 59 | 62 | 65 | |
| HAMA* | .481 | ||||||||
| No | 99 | 28 | 50 | 31 | 25 | 25 | 24 | 25 | |
| Yes | 261 | 72 | 113 | 69 | 77 | 75 | 71 | 75 | |
| PreMRD | .004 | ||||||||
| Negative | 218 | 61 | 107 | 66 | 48 | 47 | 63 | 66 | |
| Positive | 141 | 39 | 55 | 34 | 54 | 53 | 32 | 34 | |
| PostMRD | .028 | ||||||||
| Negative | 266 | 74 | 130 | 80 | 66 | 65 | 70 | 74 | |
| Positive | 94 | 26 | 33 | 20 | 36 | 35 | 25 | 26 | |
| Route of GM-CSF | < .001 | ||||||||
| No GM-CSF | 41 | 11 | 41 | 25 | 0 | 0 | 0 | 0 | |
| Intravenous | 63 | 18 | 39 | 24 | 24 | 24 | 0 | 0 | |
| Subcutaneous | 256 | 71 | 83 | 51 | 78 | 76 | 95 | 100 | |
NOTE. This table included overlapping patients; there were a total of 329 unique patients; however, 31 of these patients were in the first remission group or primary refractory group and experienced relapse after immunotherapy and were re-treated with 3F8 during second remission. The second remission group also included six patients who were diagnosed as infants but who experienced relapse at 10.8 to 36.5 months of age with BM, bone, or brain metastases. Associations between categorical and continuous variables and the three clinical groups were tested using the Fisher's exact and Kruskal-Wallis tests, respectively.
Abbreviations: BM, bone marrow; GM-CSF, granulocyte-macrophage colony-stimulating factor; HAMA, human antimouse antibody; LDH, lactate dehydrogenase; preMRD, bone marrow minimal residual disease before immunotherapy; postMRD, bone marrow minimal residual disease after two cycles of immunotherapy.
HAMA response as a time-dependent covariate is detailed by Cheung et al.4
Table A2.
Median Follow-Up Time and Number of 3F8 Cycles Among the Three Clinical Groups According to Their Clinical Protocols

| Group* and MSK Protocol Name | ClinicalTrials.gov Identifier | Drugs† | No. of Patients | Timeline | Follow-Up (months) |
No. of 3F8 Cycles |
Reference | ||
|---|---|---|---|---|---|---|---|---|---|
| Median | Range | Median | Range | ||||||
| First remission | 163 | 1988-2008 | 99 | 35-262 | 4 | 1-19 | Cheung et al4 | ||
| N6 | NCI-V90-0023 | 3F8 | |||||||
| N7 | NCT00002634 | 3F8‡ | |||||||
| 94-018 | NCT00002560 | 3F8 + IV GM-CSF | |||||||
| 03-077 | NCT00072358 | 3F8 + SC GM-CSF | |||||||
| Primary refractory | 102 | 1999-2008 | 72 | 15-203 | 6 | 1-25 | Cheung et al31 | ||
| 94-018 | NCT00002560 | 3F8 + IV GM-CSF | |||||||
| 03-077 | NCT00072358 | 3F8 + SC GM-CSF | |||||||
| Second remission | 95 | 2003-2008 | 45 | 21-105 | 4 | 1-12 | — | ||
| 03-077 | NCT00072358 | 3F8 + SC GM-CSF | |||||||
Abbreviations: GM-CSF, granulocyte-macrophage colony-stimulating factor; IV, intravenous; MSK, Memorial Sloan Kettering Cancer Center; SC, subcutaneous.
High-risk patients had stage 4 neuroblastoma diagnosed at ≥ 18 months of age or with MYCN amplification.
13-cis-retinoic acid monthly for six cycles was included in the protocols containing IV or SC GM-CSF.
A single cycle of iodine-131–3F8 was added as part of consolidation after induction chemotherapy.
Table A3.
Prognostic Impact of Individual MRD Markers Tested Before and After Two Cycles of 3F8 on PFS and OS

| Clinical Group and Outcome |
B4GALNT1 |
PHOX2B |
CCND1 |
ISL1 |
PreMRD or PostMRD |
|||||
|---|---|---|---|---|---|---|---|---|---|---|
| P | HR | P | HR | P | HR | P | HR | P | HR | |
| MRD from pretreatment markers | ||||||||||
| PFS | ||||||||||
| Primary refractory | .853 | 1.06 | .007 | 2.02 | .621 | 1.15 | .066 | 1.6 | .037 | 1.73 |
| First remission | .587 | 1.17 | .646 | 1.2 | .355 | 0.77 | .5 | 1.23 | .972 | 1.01 |
| Second remission | .722 | 0.87 | NA | .833 | 0.94 | .298 | 1.46 | .668 | 1.13 | |
| OS | ||||||||||
| Primary refractory | .437 | 0.77 | .152 | 1.51 | .247 | 0.67 | .791 | 0.93 | .521 | 0.84 |
| First remission | .95 | 1.02 | .722 | 1.16 | .152 | 0.62 | .871 | 0.94 | .948 | 1.02 |
| Second remission | .7 | 1.17 | NA | .873 | 1.05 | .257 | 1.56 | .314 | 1.36 | |
| MRD from markers after cycle 2 | ||||||||||
| PFS | ||||||||||
| Primary refractory | .001 | 2.63 | < .001 | 4.31 | < .001 | 2.96 | < .001 | 5.31 | < .001 | 3.12 |
| First remission | < .001 | 4.53 | < .001 | 9.3 | < .001 | 3.57 | < .001 | 11.49 | < .001 | 5.62 |
| Second remission | < .001 | 4.25 | < .001 | 10.92 | .019 | 2.04 | < .001 | 5.22 | < .001 | 2.74 |
| OS | ||||||||||
| Primary refractory | .001 | 2.86 | < .001 | 5.24 | .01 | 2.13 | < .001 | 3.65 | .004 | 2.24 |
| First remission | < .001 | 6.08 | < .001 | 7.22 | <.001 | 3.54 | < .001 | 8.34 | < .001 | 5.83 |
| Second remission | < .001 | 8.15 | < .001 | 9.32 | .001 | 3.01 | < .001 | 4.36 | < .001 | 4.08 |
NOTE. PreMRD and postMRD represent a binary composite of the four-marker panel, where negative indicates that all markers are negative and positive indicates that at least one marker is positive. NA indicates that no sample was positive for preMRD PHOX2B. Cox proportional hazards regression was used to estimate the P values and HRs.
Abbreviations: HR, hazard ratio; MRD, minimal residual disease; NA, not applicable; OS, overall survival; PFS, progression-free survival; postMRD, bone marrow minimal residual disease after two cycles of immunotherapy; preMRD, bone marrow minimal residual disease before immunotherapy.
Table A4.
Concordance Index for Individual Markers and the Four-Marker Panel

| Clinical Group and Outcome | Concordance Index* |
|||||
|---|---|---|---|---|---|---|
| Post-B4GALNT1 | Post-PHOX2B | Post-CCND1 | Post-ISL1 | PostMRD | PostMRDSum | |
| PFS | ||||||
| Primary refractory | 0.585 | 0.592 | 0.594 | 0.620 | 0.624 | 0.647 |
| First remission | 0.576 | 0.541 | 0.576 | 0.599 | 0.647 | 0.652 |
| Second remission | 0.586 | 0.532 | 0.556 | 0.553 | 0.599 | 0.608 |
| OS | ||||||
| Primary refractory | 0.610 | 0.630 | 0.595 | 0.631 | 0.609 | 0.644 |
| First remission | 0.602 | 0.543 | 0.578 | 0.602 | 0.661 | 0.667 |
| Second remission | 0.640 | 0.561 | 0.610 | 0.576 | 0.656 | 0.667 |
Concordance index of 0.5 indicates a toss-up, and concordance index of 1 indicates a perfect predictor.
Fig A1.
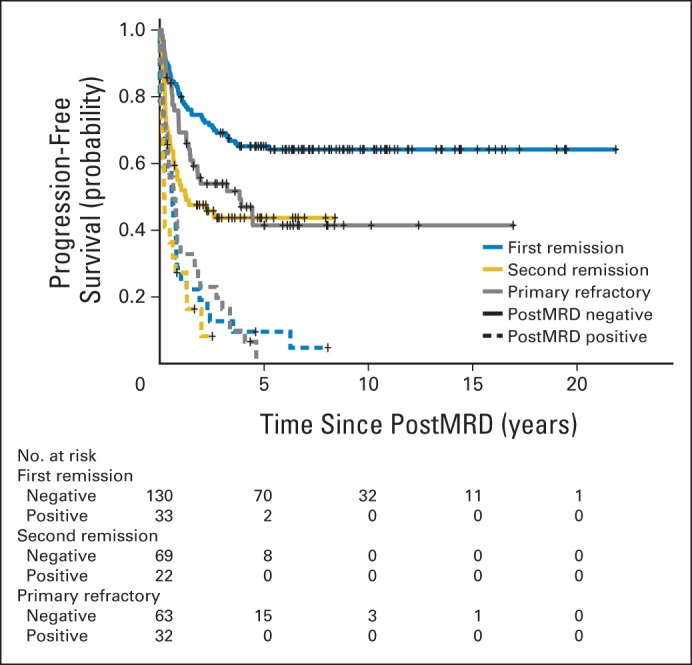
Prognostic impact of minimal residual disease after cycle 2 (postMRD) using the four-marker panel on progression-free survival stratified according to clinical groups. PostMRD is the composite of the four-marker panel, where negative indicates that all markers are negative and positive indicates that at least one marker is positive.
Fig A2.

Prognostic impact of individual postMRD marker positivity on overall survival: (A) post-B4GALNT1; (B) post-PHOX2B; (C) post-CCND1; and (D) post-ISL1. PostMRD, minimal residual disease after cycle 2 of 3F8.
Fig A3.

Prognostic significance of postMRDSum on progression-free survival among the three clinical groups: (A) primary refractory, (B) first remission, and (C) second remission. PostMRDSum indicates post-B4GALNT1 plus post-PHOX2B plus post-CCND1 plus post-ISL1, where each marker was given an equal weight, with a value of 0, 1, 2, 3, or 4. PostMRD, minimal residual disease after cycle 2 of 3F8.
Fig A4.

Prognostic significance of postMRDSum on overall survival among the three clinical groups: (A) primary refractory, (B) first remission, and (C) second remission. PostMRD, minimal residual disease after cycle 2 of 3F8.
Footnotes
Supported in part by Core Grant No. P30 CA008748 and the Katie Find a Cure Fund, Catie Hoch Foundation, and Robert Steel Foundation.
Presented in part at the 2014 Meeting of the Advances in Neuroblastoma Research Association, May 13-16, 2014, Cologne, Germany.
Terms in blue are defined in the glossary, found at the end of this article and online at www.jco.org.
Authors' disclosures of potential conflicts of interest are found in the article online at www.jco.org. Author contributions are found at the end of this article.
AUTHORS' DISCLOSURES OF POTENTIAL CONFLICTS OF INTEREST
Disclosures provided by the authors are available with this article at www.jco.org.
AUTHOR CONTRIBUTIONS
Conception and design: Nai-Kong V. Cheung, Irene Y. Cheung
Collection and assembly of data: Nai-Kong V. Cheung, Irene Y. Cheung
Data analysis and interpretation: Nai-Kong V. Cheung, Irina Ostrovnaya, Deborah Kuk, Irene Y. Cheung
Manuscript writing: All authors
Final approval of manuscript: All authors
AUTHORS' DISCLOSURES OF POTENTIAL CONFLICTS OF INTEREST
Bone Marrow Minimal Residual Disease Was an Early Response Marker and a Consistent Independent Predictor of Survival After Anti-GD2 Immunotherapy
The following represents disclosure information provided by authors of this manuscript. All relationships are considered compensated. Relationships are self-held unless noted. I = Immediate Family Member, Inst = My Institution. Relationships may not relate to the subject matter of this manuscript. For more information about ASCO's conflict of interest policy, please refer to www.asco.org/rwc or jco.ascopubs.org/site/ifc.
Nai-Kong V. Cheung
Patents, Royalties, Other Intellectual Property: beta-glucan (Inst), hu3F8, hu8H9, HLA-A2–restricted, peptide-specific antigen-binding proteins, multimerization technologies, antigen-binding proteins specific for HLA-A2–restricted Wilms tumor 1 peptide, methods for detecting minimal residual disease
Irina Ostrovnaya
No relationship to disclose
Deborah Kuk
No relationship to disclose
Irene Y. Cheung
Patents, Royalties, Other Intellectual Property: beta-glucan (I), hu3F8 (I), hu8H9 (I), HLA-A2–restricted, peptide-specific antigen-binding proteins (I), multimerization technologies (I), antigen-binding proteins specific for HLA-A2–restricted Wilms tumor 1 peptide (I), methods for detecting minimal residual disease (I)
REFERENCES
- 1.Cheung NV, Heller G. Chemotherapy dose intensity correlates strongly with response, median survival, and median progression-free survival in metastatic neuroblastoma. J Clin Oncol. 1991;9:1050–1058. doi: 10.1200/JCO.1991.9.6.1050. [DOI] [PubMed] [Google Scholar]
- 2.Matthay KK, Villablanca JG, Seeger RC, et al. Treatment of high-risk neuroblastoma with intensive chemotherapy, radiotherapy, autologous bone marrow transplantation, and 13-cis-retinoic acid: Children's Cancer Group. N Engl J Med. 1999;341:1165–1173. doi: 10.1056/NEJM199910143411601. [DOI] [PubMed] [Google Scholar]
- 3.Yu AL, Gilman AL, Ozkaynak MF, et al. Anti-GD2 antibody with GM-CSF, interleukin-2, and isotretinoin for neuroblastoma. N Engl J Med. 2010;363:1324–1334. doi: 10.1056/NEJMoa0911123. [DOI] [PMC free article] [PubMed] [Google Scholar]
- 4.Cheung NK, Cheung IY, Kushner BH, et al. Murine anti-GD2 monoclonal antibody 3F8 combined with granulocyte-macrophage colony-stimulating factor and 13-cis-retinoic acid in high-risk patients with stage 4 neuroblastoma in first remission. J Clin Oncol. 2012;30:3264–3270. doi: 10.1200/JCO.2011.41.3807. [DOI] [PMC free article] [PubMed] [Google Scholar]
- 5.Matthay KK, Reynolds CP, Seeger RC, et al. Long-term results for children with high-risk neuroblastoma treated on a randomized trial of myeloablative therapy followed by 13-cis-retinoic acid: A Children's Oncology Group study. J Clin Oncol. 2009;27:1007–1013. doi: 10.1200/JCO.2007.13.8925. [DOI] [PMC free article] [PubMed] [Google Scholar]
- 6.Cheung NK, Dyer MA. Neuroblastoma: Developmental biology, cancer genomics, and immunotherapy. Nat Rev Cancer. 2013;13:397–411. doi: 10.1038/nrc3526. [DOI] [PMC free article] [PubMed] [Google Scholar]
- 7.Brodeur GM, Pritchard J, Berthold F, et al. Revisions of the international criteria for neuroblastoma diagnosis, staging, and response to treatment. J Clin Oncol. 1993;11:1466–1477. doi: 10.1200/JCO.1993.11.8.1466. [DOI] [PubMed] [Google Scholar]
- 8.Eisenhauer EA, Therasse P, Bogaerts J, et al. New response evaluation criteria in solid tumours: Revised RECIST guideline (version 1.1) Eur J Cancer. 2009;45:228–247. doi: 10.1016/j.ejca.2008.10.026. [DOI] [PubMed] [Google Scholar]
- 9.Cheung NK, Heller G, Kushner BH, et al. Detection of metastatic neuroblastoma in bone marrow: When is routine marrow histology insensitive? J Clin Oncol. 1997;15:2807–2817. doi: 10.1200/JCO.1997.15.8.2807. [DOI] [PubMed] [Google Scholar]
- 10.Méhes G, Luegmayr A, Ambros IM, et al. Combined automatic immunological and molecular cytogenetic analysis allows exact identification and quantification of tumor cells in the bone marrow. Clin Cancer Res. 2001;7:1969–1975. [PubMed] [Google Scholar]
- 11.Moss TJ, Reynolds CP, Sather HN, et al. Prognostic value of immunocytologic detection of bone marrow metastases in neuroblastoma. N Engl J Med. 1991;324:219–226. doi: 10.1056/NEJM199101243240403. [DOI] [PubMed] [Google Scholar]
- 12.Combaret V, Bergeron C, Noguera R, et al. Circulating MYCN DNA predicts MYCN-amplification in neuroblastoma. J Clin Oncol. 2005;23:8919–8920. doi: 10.1200/JCO.2005.04.0170. [DOI] [PubMed] [Google Scholar]
- 13.Stutterheim J, Ichou FA, den Ouden E, et al. Methylated RASSF1a is the first specific DNA marker for minimal residual disease testing in neuroblastoma. Clin Cancer Res. 2012;18:808–814. doi: 10.1158/1078-0432.CCR-11-0849. [DOI] [PubMed] [Google Scholar]
- 14.Horibe K, Fukuda M, Miyajima Y, et al. Outcome prediction by molecular detection of minimal residual disease in bone marrow for advanced neuroblastoma. Med Pediatr Oncol. 2001;36:203–204. doi: 10.1002/1096-911X(20010101)36:1<203::AID-MPO1049>3.0.CO;2-T. [DOI] [PubMed] [Google Scholar]
- 15.Cheung IY, Barber D, Cheung NK. Detection of microscopic neuroblastoma in marrow by histology, immunocytology, and reverse transcription-PCR of multiple molecular markers. Clin Cancer Res. 1998;4:2801–2805. [PubMed] [Google Scholar]
- 16.Cheung IY, Feng Y, Vickers A, et al. Cyclin D1, a novel molecular marker of minimal residual disease, in metastatic neuroblastoma. J Mol Diagn. 2007;9:237–241. doi: 10.2353/jmoldx.2007.060130. [DOI] [PMC free article] [PubMed] [Google Scholar]
- 17.Cheung IY, Feng Y, Gerald W, et al. Exploiting gene expression profiling to identify novel minimal residual disease markers of neuroblastoma. Clin Cancer Res. 2008;14:7020–7027. doi: 10.1158/1078-0432.CCR-08-0541. [DOI] [PMC free article] [PubMed] [Google Scholar]
- 18.Stutterheim J, Gerritsen A, Zappeij-Kannegieter L, et al. PHOX2B is a novel and specific marker for minimal residual disease testing in neuroblastoma. J Clin Oncol. 2008;26:5443–5449. doi: 10.1200/JCO.2007.13.6531. [DOI] [PubMed] [Google Scholar]
- 19.Beiske K, Burchill SA, Cheung IY, et al. Consensus criteria for sensitive detection of minimal neuroblastoma cells in bone marrow, blood and stem cell preparations by immunocytology and QRT-PCR: Recommendations by the International Neuroblastoma Risk Group Task Force. Br J Cancer. 2009;100:1627–1637. doi: 10.1038/sj.bjc.6605029. [DOI] [PMC free article] [PubMed] [Google Scholar]
- 20.Naito H, Kuzumaki N, Uchino J, et al. Detection of tyrosine hydroxylase mRNA and minimal neuroblastoma cells by the reverse transcription-polymerase chain reaction. Eur J Cancer. 1991;27:762–765. doi: 10.1016/0277-5379(91)90184-f. [DOI] [PubMed] [Google Scholar]
- 21.Burchill SA, Bradbury FM, Smith B, et al. Neuroblastoma cell detection by reverse transcriptase-polymerase chain reaction (RT-PCR) for tyrosine hydroxylase mRNA. Int J Cancer. 1994;57:671–675. doi: 10.1002/ijc.2910570510. [DOI] [PubMed] [Google Scholar]
- 22.Viprey VF, Lastowska MA, Corrias MV, et al. Minimal disease monitoring by QRT-PCR: Guidelines for identification and systematic validation of molecular markers prior to evaluation in prospective clinical trials. J Pathol. 2008;216:245–252. doi: 10.1002/path.2406. [DOI] [PubMed] [Google Scholar]
- 23.Cheung IY, Lo Piccolo MS, Kushner BH, et al. Quantitation of GD2 synthase mRNA by real-time reverse transcriptase polymerase chain reaction: Clinical utility in evaluating adjuvant therapy in neuroblastoma. J Clin Oncol. 2003;21:1087–1093. doi: 10.1200/JCO.2003.02.055. [DOI] [PubMed] [Google Scholar]
- 24.Cheung IY, Lo Piccolo MS, Kushner BH, et al. Early molecular response of marrow disease to biologic therapy is highly prognostic in neuroblastoma. J Clin Oncol. 2003;21:3853–3858. doi: 10.1200/JCO.2003.11.077. [DOI] [PubMed] [Google Scholar]
- 25.Viprey VF, Gregory WM, Corrias MV, et al. Neuroblastoma mRNAs predict outcome in children with stage 4 neuroblastoma: A European HR-NBL1/SIOPEN study. J Clin Oncol. 2014;32:1074–1083. doi: 10.1200/JCO.2013.53.3604. [DOI] [PubMed] [Google Scholar]
- 26.Kushner BH, Kramer K, LaQuaglia MP, et al. Reduction from seven to five cycles of intensive induction chemotherapy in children with high-risk neuroblastoma. J Clin Oncol. 2004;22:4888–4892. doi: 10.1200/JCO.2004.02.101. [DOI] [PubMed] [Google Scholar]
- 27.Kushner BH, Kramer K, Modak S, et al. Camptothecin analogs (irinotecan or topotecan) plus high-dose cyclophosphamide as preparative regimens for antibody-based immunotherapy in resistant neuroblastoma. Clin Cancer Res. 2004;10:84–87. doi: 10.1158/1078-0432.ccr-1147-3. [DOI] [PubMed] [Google Scholar]
- 28.Kushner BH, Cheung NK, Kramer K, et al. Topotecan combined with myeloablative doses of thiotepa and carboplatin for neuroblastoma, brain tumors, and other poor-risk solid tumors in children and young adults. Bone Marrow Transplant. 2001;28:551–556. doi: 10.1038/sj.bmt.1703213. [DOI] [PubMed] [Google Scholar]
- 29.Cheung NK, Kushner BH, Cheung IY, et al. Anti-G(D2) antibody treatment of minimal residual stage 4 neuroblastoma diagnosed at more than 1 year of age. J Clin Oncol. 1998;16:3053–3060. doi: 10.1200/JCO.1998.16.9.3053. [DOI] [PubMed] [Google Scholar]
- 30.Kushner BH, Kramer K, Cheung NK. Phase II trial of the anti-G(D2) monoclonal antibody 3F8 and granulocyte-macrophage colony-stimulating factor for neuroblastoma. J Clin Oncol. 2001;19:4189–4194. doi: 10.1200/JCO.2001.19.22.4189. [DOI] [PubMed] [Google Scholar]
- 31.Cheung NK, Cheung IY, Kramer K, et al. Key role for myeloid cells: Phase II results of anti-GD2 antibody 3F8 plus granulocyte-macrophage colony-stimulating factor for chemoresistant osteomedullary neuroblastoma. Int J Cancer. 2014;135:2199–2205. doi: 10.1002/ijc.28851. [DOI] [PMC free article] [PubMed] [Google Scholar]
- 32.Cheung NK, Sowers R, Vickers AJ, et al. FCGR2A polymorphism is correlated with clinical outcome after immunotherapy of neuroblastoma with anti-GD2 antibody and granulocyte macrophage colony-stimulating factor. J Clin Oncol. 2006;24:2885–2890. doi: 10.1200/JCO.2005.04.6011. [DOI] [PubMed] [Google Scholar]
- 33.Hsu KC, Liu XR, Selvakumar A, et al. Killer Ig-like receptor haplotype analysis by gene content: Evidence for genomic diversity with a minimum of six basic framework haplotypes, each with multiple subsets. J Immunol. 2002;169:5118–5129. doi: 10.4049/jimmunol.169.9.5118. [DOI] [PubMed] [Google Scholar]
- 34.Venstrom JM, Zheng J, Noor N, et al. KIR and HLA genotypes are associated with disease progression and survival following autologous hematopoietic stem cell transplantation for high-risk neuroblastoma. Clin Cancer Res. 2009;15:7330–7334. doi: 10.1158/1078-0432.CCR-09-1720. [DOI] [PMC free article] [PubMed] [Google Scholar]
- 35.Harrell F. Logistic Regression, and Survival Analysis. New York, NY: Springer; 2001. Regression Modeling Strategies: With Applications to Linear Models; pp. 1–571. [Google Scholar]
- 36.Klein JP, van Houwelingen HC, Ibrahim JG, et al. Handbook of Survival Analysis (ed 1) Boca Raton, FL: CRC Press; 2013. [Google Scholar]
- 37.Simon N, Friedman T, Hastie T, et al. Regularization paths for Cox's proportional hazards model via coordinate descent. J Stat Softw. 2011;39:1–13. doi: 10.18637/jss.v039.i05. [DOI] [PMC free article] [PubMed] [Google Scholar]
- 38.R Development Core Team: R. A Language and Environment for Statistical Computing. Vienna, Austria: R Foundation for Statistical Computing; 2011. http://www.R-project.org/ [Google Scholar]
- 39.Kalia M. Personalized oncology: Recent advances and future challenges. Metabolism. 2013;62(suppl 1):S11–S14. doi: 10.1016/j.metabol.2012.08.016. [DOI] [PubMed] [Google Scholar]
- 40.Cheung NK, Guo HF, Heller G, et al. Induction of Ab3 and Ab3′ antibody was associated with long-term survival after anti-G(D2) antibody therapy of stage 4 neuroblastoma. Clin Cancer Res. 2000;6:2653–2660. [PubMed] [Google Scholar]
- 41.Lowrance WT, Scardino PT. Predictive models for newly diagnosed prostate cancer patients. Rev Urol. 2009;11:117–126. [PMC free article] [PubMed] [Google Scholar]
- 42.Crowley E, Di Nicolantonio F, Loupakis F, et al. Liquid biopsy: Monitoring cancer-genetics in the blood. Nat Rev Clin Oncol. 2013;10:472–484. doi: 10.1038/nrclinonc.2013.110. [DOI] [PubMed] [Google Scholar]
- 43.De Mattos-Arruda L, Cortes J, Santarpia L, et al. Circulating tumour cells and cell-free DNA as tools for managing breast cancer. Nat Rev Clin Oncol. 2013;10:377–389. doi: 10.1038/nrclinonc.2013.80. [DOI] [PubMed] [Google Scholar]
- 44.Campana D. Minimal residual disease monitoring in childhood acute lymphoblastic leukemia. Curr Opin Hematol. 2012;19:313–318. doi: 10.1097/MOH.0b013e3283543d5c. [DOI] [PubMed] [Google Scholar]
- 45.Kogan Y, Halevi-Tobias K, Elishmereni M, et al. Reconsidering the paradigm of cancer immunotherapy by computationally aided real-time personalization. Cancer Res. 2012;72:2218–2227. doi: 10.1158/0008-5472.CAN-11-4166. [DOI] [PubMed] [Google Scholar]