

Abstract
Background
Current prognostic tools in colon cancer use relatively few patient characteristics. We constructed and validated clinical calculators for overall survival (OS) and time to recurrence (TTR) for stage III colon cancer and compared their performance against an existing tool (Numeracy) and American Joint Committee on Cancer (AJCC) version 7 staging.
Methods
Data from 15936 stage III patients accrued to phase III clinical trials since 1989 were used to construct Cox models for TTR and OS. Variables included age, sex, race, body mass index, performance status, tumor grade, tumor stage, ratio of positive lymph nodes to nodes examined, number and location of primary tumors, and adjuvant treatment (fluoropyrimidine single agent or in combination). Missing data were imputed, and final models internally validated for optimism-corrected calibration and discrimination and compared with AJCC. External validation and comparisons against Numeracy were performed using stage III patients from NSABP trial C-08. All statistical tests were two-sided.
Results
All variables were statistically and clinically significant for OS prediction, while age and race did not predict TTR. No meaningful interactions existed. Models for OS and TTR were well calibrated and associated with C-indices of 0.66 and 0.65, respectively, compared with C-indices of 0.58 and 0.59 for AJCC. These tools, available online, better predicted patient outcomes than Numeracy, both overall and within patient subgroups, in external validation.
Conclusions
The proposed ACCENT calculators are internally and externally valid, better discriminate patient risk than AJCC version 7 staging, and better predict patient outcomes than Numeracy. These tools have replaced Numeracy for online clinical use and will aid prognostication and patient/physician communication.
Colon cancer is the second leading cause of cancer-related death in the United States, ranking third for both men and women (1). While prevention and screening are key to reducing disease impact at the population level, during the past few decades, adjuvant therapeutic options for early-stage colon cancer have increased in effectiveness. In stage III colon cancer, the benefit of adjuvant chemotherapy following curative resection has been well established, with the definitive trials for FOLFOX (2,3), CAPOX/XELOX (4), and FLOX (5) completed within the past 15 years. However, accurate determination of individual patient prognoses remains difficult.
Current staging systems and prognostic tools in colon cancer utilize relatively few patient characteristics compared with the breadth of information that is generally available. Additionally, many of these tools were developed using observational data from a limited context and may include biases inherent to nonrandomized studies. Furthermore, most existing tools do not provide measures of uncertainty (such as confidence intervals) around individual predictions, which may consequentially inflate a user’s trust in the published point estimates.
Existing Prognostic Tools in Colon Cancer
One predictive tool created for early colon cancer is Numeracy, a calculator developed using 3341 individual patients accrued to seven clinical trials between 1978 and 1992 (6). Input patient characteristics include the (categorized) number of positive nodes, categorized tumor stage, low vs high tumor grade, and grouped age. The calculator returns five-year overall survival (OS) and recurrence-free survival (RFS) probabilities by adjuvant treatment option. Numeracy has some weaknesses, including utilization of few patient characteristics, aggregated rather than detailed levels of each variable, and lack of intervals with predictions. The tools described herein were developed to replace Numeracy.
Memorial Sloan-Kettering offers online colorectal cancer tools to predict recurrence and survival, developed using observational data from 1320 patients (7–9). The recurrence tool inputs the following variables (the survival tool uses a subset): age, sex, tumor location, presurgical carcinoembryonic antigen, tumor stage, differentiation, lymphovascular invasion, perineural invasion, number of positive and negative lymph nodes, and whether a patient will receive chemotherapy. Estimated disease-free survival (DFS) probabilities at five and 10 years postsurgery and estimated five-year survival probabilities are provided, but without confidence intervals. Furthermore, as observational data used to construct these models were collected from a single academic center, their broad applicability remains unclear.
A third adjuvant colon cancer prognostic tool, Adjuvant! Online, was developed using data from the United States Surveillance Epidemiology and End Results (SEER) tumor registry (10). Input variables include: age, sex, comorbidities (scale variable), tumor stage, categorized number of examined and positive nodes, and histologic grade. Returned are estimated probabilities of survival, death because of cancer, and death because of other causes after five years, with and without chemotherapy (without confidence intervals). While more comprehensive, the statistical model behind this calculator has never been published or internally validated.
In 2011, Gill et al. performed an external validation and comparison of Numeracy and Adjuvant! Online using data from the British Columbia Colorectal Cancer Outcomes Unit database and two North Central Cancer Trials Group (NCCTG) studies. The authors concluded that both calculators performed reasonably well at predicting outcomes in stage III disease (11).
Perhaps the most widely used risk classification system is that of the American Joint Committee on Cancer (AJCC) staging system, now in its 7th edition, which uses tumor stage, nodal status, and metastases to “stage” patients, thereby implying stage-specific prognoses (12). However, additional patient or disease characteristics known to affect recurrence or survival, such as age, tumor grade, body mass index (BMI), and performance status, are ignored in AJCC-based risk determinations.
Rationale for a New Colon Cancer Tool
Without available tools that utilize a comprehensive spectrum of patient characteristics, are easy to use and interpret, and are both internally and externally valid for use in a broad population, physicians must rely primarily on personal experience or intuition to determine prognoses for individual patients. This leads to prognoses that are inherently physician-dependent, where different physicians may disagree on the likely course of disease for the same patient. In an era of personalized medicine and increased public awareness and access to health information, movement toward personalized prognoses is critical for both treatment planning and patient-physician communication. While the benefits of modern therapies are learned primarily through focused randomized clinical trials, individual clinical trials are not adequately sized to assess disease prognosis within small patient subsets, nor can they be used alone to develop the large multivariable prognostic models required to understand the relationships between an extensive set of clinical variables and patient outcomes.
To address this need, we constructed clinical prediction models (calculators) for overall survival (OS) and time to recurrence (TTR) for patients with stage III colon cancer, using pooled data from nearly 16000 patients from 12 randomized clinical trials contained in the Adjuvant Colon Cancer End Points (ACCENT) database (13,14). These models incorporate a larger set of clinical and disease features than any currently available tool, and for generalizability and ease of use, only variables commonly available at the time of adjuvant treatment initiation were considered. For a given set of patient characteristics, including treatment class, the calculators return predictions for the likelihood of being recurrence-free at three years and alive at five years, with 95% confidence intervals. We performed rigorous internal and external validation of our tools, conducted a formal comparison against Numeracy (the tool our calculators have replaced), and assessed whether they better discriminate risk among stage III patients than AJCC staging.
Methods
Database and Candidate Variables
Fifteen thousand, nine hundred ninety-five stage III patients accrued to 12 phase III clinical trials since 1989 (Supplementary Table 1, available online) were included in construction of clinical prediction models for TTR and OS. Patient variables considered for inclusion were as follows: age (continuous), sex, race (white, black, Asian, or other), BMI (continuous), performance status (PS; 0, 1, 2+), tumor grade (1, 2, 3+), tumor stage (T-stage; T1, T2, T3, T4), ratio of the number of positive lymph nodes to the number of nodes examined (continuous between 0 and 1), number and location of primary tumors (any multiple, single left, single right, or single transverse/flexures), and treatment class (oral/infusional/bolus 5FU variations vs 5FU with oxaliplatin vs 5FU with irinotecan).
Missing Data and Imputation
Variables were examined for individual and joint missingness, and the missing-at-random (MAR) assumption verified through logistic regression models predicting a variable’s missingness given other variables in the dataset (15). The MAR assumption was also practically assumed, as all independent variables were collected at baseline and missingness was generally study specific (ie, data item not collected on study case-report forms). Missing data were imputed using stochastic regression (single) imputation, with all variables (including outcomes) included in the imputation model (16). To avoid contradictions of available and imputed lymph node information, only ratio and number of positive nodes were imputed, with the number of nodes examined derived after imputation.
Model Construction
Following imputation, multivariable Cox proportional hazards models were formulated using variables that demonstrated both promising statistical (with P < .10 according to a likelihood ratio test) and clinical (as determined by sufficiently large hazard ratios) significance in univariate models. All Cox models were stratified by study, allowing effects to be averaged across study-specific baseline hazard functions. The proportional hazards assumption was verified using the methods of Grambsch and Therneau (17). Continuous variables (age, BMI, and node ratio) were modeled using restricted cubic splines, to assess possible nonlinearity of their effects and select the appropriate degrees of freedom for subsequent modeling (16). For each variable and endpoint, three automatically selected knots per model were initially used, with additional knots added as necessitated by visual inspection of spline plots and formal significance tests (16). To determine whether the effects of any covariables were dependent on other covariables, partial interaction tests were performed for each variable in the multivariable model, where a statistically significant (P < .05) partial interaction prompted exploration of its component pairwise interactions (18). Pairwise interactions were then included in final models if both statistical significance (P < .01 according to a likelihood ratio test) and clinical relevance (eg, meaningfully large hazard ratios) were satisfied. Final models were comprised of all relevant main effects and pairwise interactions, and the fitted models were subsequently used to construct both visual nomograms and online web calculators for three-year recurrence-free and five-year survival probabilities. Irinotecan was excluded from both presentations for clinical reasons (see Discussion). All statistical tests were two-sided, and all imputation, analyses, and figures were produced using package “rms” within the R statistical software version 2.15.2 (19).
Internal Validation and Comparison With AJCC
Final models for OS and TTR were internally validated using bootstrapping to obtain optimism-corrected discrimination via the concordance index for survival data (16,18) as well as calibration plots (16). Risk discrimination for TTR and OS was also computed for models including only AJCC Version 7 stage (12).
External Validation on NSABP C-08 and Comparison With Numeracy
External validation was performed by comparing the predicted three-year recurrence and five-year survival probabilities of patients enrolled to the National Surgical Adjuvant Breast and Bowel Project (NSABP) trial C-08 (20) versus the observed probabilities of the same patients, as follows. For each endpoint, the median ACCENT-based prediction across C-08 patients was compared with the observed Kaplan-Meier estimate (and its confidence interval) for the same patients and time point, both overall and within patient subgroups. Observed vs expected survival rates were also compared for Numeracy (TTR is not an endpoint in Numeracy). As another measure of external validation, rates of correct prediction, ie, the concordance of observed (event, no event) vs predicted (using 50% predicted probability as a dichotomizing threshold) five-year survival and three-year recurrence status across C-08 patients and subgroups, were also computed for both ACCENT tools (OS concordance was further computed for Numeracy, for comparison versus ACCENT).
Results
Missing Data and Imputation
Prior to imputation, 59 discrepant cases were removed from the dataset for the following reasons: no positive nodes, fewer examined nodes than positive nodes, missing OS or TTR, or missing five or more of the 10 candidate variables. Across the remaining 15936 patients, missingness was less than 18% for each variable. Patterns of comissingness among multiple variables were generally attributable to the specific data collection patterns of individual studies. Because of this, and because only baseline variables were considered for the prediction models, the MAR assumption was deemed satisfied for these data. A demographics profile for the final model construction cohort (n = 15936) is given in Table 1.
Table 1.
Demographics and disease characteristics of patients used for nomogram construction: preimputation and postimputation*
| Characteristic | Preimputation | Postimputation |
|---|---|---|
| No. (%) | No. (%) | |
| Age, y | ||
| Mean (SD) | 60.0 (11.0) | 60.0 (11.0) |
| Median (IQR) | 62.0 (53.0–68.0) | 62.0 (53.0–68.0) |
| Sex | ||
| Male | 8644 (54) | 8644 (54) |
| Female | 7292 (46) | 7292 (46) |
| Race | ||
| White | 13895 (92) | 14638 (92) |
| Black | 762 (5) | 793 (5) |
| Asian | 238 (2) | 251 (2) |
| Other | 242 (2) | 254 (2) |
| BMI, kg/m2 | ||
| Mean (SD) | 26.4 (5.1) | 26.4 (5.1) |
| Median (IQR) | 25.7 (23.0–28.9) | 25.7 (23.0–28.9) |
| PS | ||
| 0 | 12302 (78) | 12457 (78) |
| 1 | 3270 (21) | 3302 (21) |
| 2+ | 174 (1) | 177 (1) |
| Tumor grade | ||
| 1 | 1501 (11) | 1725 (11) |
| 2 | 9146 (68) | 10832 (68) |
| 3+ | 2849 (21) | 3379 (21) |
| Tumor stage | ||
| T1 | 551 (4) | 565 (4) |
| T2 | 2426 (16) | 2500 (16) |
| T3 | 10697 (69) | 11079 (70) |
| T4 | 1742 (11) | 1792 (11) |
| # Pos. nodes | ||
| Mean (SD) | 3.5 (3.4) | 3.4 (3.3) |
| Median (IQR) | 2.0 (1.0–4.0) | 2.0 (1.0–4.0) |
| # Nodes exam | ||
| Mean (SD) | 14.1 (9.6) | 14.1 (9.7) |
| Median (IQR) | 12.0 (8.0–18.0) | 12.0 (8.0–18.0) |
| Node ratio | ||
| Mean (SD) | 0.31 (0.25) | 0.31 (0.25) |
| Median (IQR) | 0.23 (0.11–0.44) | 0.23 (0.11–0.43) |
| Location | ||
| Any multiple | 349 (3) | 436 (3) |
| Sing. left | 6072 (46) | 7434 (47) |
| Sing. transverse | 2188 (17) | 2651 (17) |
| Sing. right | 4453 (34) | 5415 (34) |
| Trt class | ||
| 5FU variations | 12661 (79) | 12661 (79) |
| 5FU + Ox | 1530 (10) | 1530 (10) |
| 5FU + Iri | 1745 (11) | 1745 (11) |
| Total | 15936 (100) | 15936 (100) |
* BMI = body mass index; IQR = interquartile range; Iri = irinotecan; Ox = oxaliplatin; PS, performance status; Sing = single.
Model Construction
All variables demonstrated statistical and clinical association with OS in univariate analyses; age and race were not associated with TTR. The effect of each continuous variable (age, BMI, and lymph node ratio) was nonlinear (P < .05), and restricted cubic spline models with three degrees of freedom were subsequently used within Cox models (Figure 1). No interactions exhibiting both statistical significance and interpretable clinical relevance were identified, where the latter was determined by examination of spline plots and hazard ratios across subgroups for continuous and categorical variables, respectively.
Figure 1.

Risk of death (on the log hazard ratio scale, y-axis), as a function of (A) age, (C) body mass index (BMI), and (E) lymph node ratio. Risk of recurrence as a function of (B) age, (D) BMI, and (F) lymph node ratio. Solid line = risk function. Dashed lines = 95% confidence bands for the risk function.
The final multivariable models for OS and TTR are presented in Table 2, and corresponding nomograms for OS and TTR presented in Figures 2 and 3, respectively. While familiarity with nomograms is not required to utilize the web-based tools, brief instructions are provided in the Figure 2 legend. From Figures 2 and 3, the relative importance of the variables may be readily gauged; eg, baseline lymph node ratio and tumor stage have the largest impact on OS risk, while sex and (grouped) treatment have the smallest impact. Directional influence (ie, benefit vs harm) of individual variables from ACCENT was similar to that previously published (21). Based on the sizes of adjusted hazard ratios in Table 2 and relative risk contributions in Figures 2 and 3, each variable in the final models for OS and TTR was deemed clinically significant.
Table 2.
Final multivariable Cox models associated with nomogram for OS and TTR*
| Variable | OS | TTR | ||||||
|---|---|---|---|---|---|---|---|---|
| Coef | Sth. err | HR | Factor P | Coef | Sth. err | HR | Factor P | |
| Age† | −0.0004 | 0.0025 | <.0001 | ‡ | ||||
| 0.0149 | 0.0028 | |||||||
| Sex | <.0001 | .0011 | ||||||
| Female | - | - | - | - | - | - | ||
| Male | 0.1740 | 0.0271 | 1.190 | 0.0866 | 0.0265 | 1.090 | ||
| Race | .0094 | ‡ | ||||||
| White | - | - | - | |||||
| Black | 0.1869 | 0.0580 | 1.205 | |||||
| Asian | 0.1220 | 0.1080 | 1.130 | |||||
| Other | 0.0361 | 0.1038 | 1.037 | |||||
| BMI† | −0.0310 | 0.0069 | <.0001 | −0.0365 | 0.0066 | <.0001 | ||
| 0.0370 | 0.0077 | 0.0418 | 0.0074 | |||||
| PS | <.0001 | .0002 | ||||||
| 0 | - | - | - | - | - | - | ||
| 1 | 0.1330 | 0.0318 | 1.142 | 0.1110 | 0.0315 | 1.117 | ||
| 2+ | 0.3514 | 0.1021 | 1.421 | 0.2850 | 0.1129 | 1.330 | ||
| Grade | <.0001 | .0002 | ||||||
| 1 | - | - | - | - | - | - | ||
| 2 | 0.0725 | 0.0468 | 1.075 | 0.1069 | 0.0451 | 1.113 | ||
| 3+ | 0.2262 | 0.0519 | 1.254 | 0.2008 | 0.0507 | 1.222 | ||
| T-Stage | <.0001 | <.0001 | ||||||
| T1 | - | - | - | - | - | - | ||
| T2 | 0.3748 | 0.0951 | 1.455 | 0.5317 | 0.1044 | 1.702 | ||
| T3 | 0.9086 | 0.0945 | 2.481 | 1.1514 | 0.1030 | 3.163 | ||
| T4 | 1.3469 | 0.0993 | 3.845 | 1.5682 | 0.1072 | 4.798 | ||
| Node Ratio† | 2.9665 | 0.1870 | <.0001 | 2.8326 | 0.1822 | <.0001 | ||
| −2.7422 | 0.3306 | −2.5617 | 0.3235 | |||||
| Location | <.0001 | .0178 | ||||||
| Left | - | - | - | - | - | - | ||
| Right | 0.2297 | 0.0306 | 1.258 | 0.0796 | 0.0298 | 1.083 | ||
| Transv | 0.1907 | 0.0377 | 1.210 | 0.0578 | 0.0371 | 1.059 | ||
| Multi | 0.2380 | 0.0813 | 1.269 | 0.1627 | 0.0788 | 1.177 | ||
| Treatment | .0219 | <.0001 | ||||||
| 5FU | - | - | - | - | - | - | ||
| 5FU+Ox | −0.1718 | 0.0661 | 0.842 | −0.2866 | 0.0626 | 0.751 | ||
| 5FU+Iri | −0.0571 | 0.0608 | 0.944 | −0.0697 | 0.0554 | 0.933 | ||
* The symbol (−) denotes reference groups for hazard ratio construction. BMI = body mass index; Coef = coefficient; HR = hazard ratio; Multi = multiple; OS = overall survival; PS, performance status; Std. err = standard error; Transv = transverse; TTR = time to recurrence.
† Multiple terms because of restricted cublic spline fits for these continuous variables.
‡ Age and race did not contribute to the model for TTR.
Figure 2.

Nomogram for overall survival (OS). Using Figure 2, an example patient’s predictions may be obtained from a single nomogram as follows. First, risk points associated with each variable are obtained via vertical translation of the patient’s variable value (eg, “Male”) to the scale labeled “Points” in the nomogram (ie, being male contributes 12 points to OS risk). Next, the points associated with each variable value for the patient are totaled across the variables. This total is then located on the scale “Total Points” (eg, 119 for OS) and then vertically mapped to obtain the prediction of interest (ie, five-year OS probability of 78%). In the web implementation, 95% confidence intervals for each prediction are also provided. BMI = body mass index; PS = performance status; OS = overall survival.
Figure 3.

Nomogram for TTR. BMI = body mass index; PS = performance status; TTR = time to recurrence.
Internal Validation and Comparison With AJCC
The final model for OS demonstrated a concordance index of C = 0.66, while the model for TTR yielded concordance C = 0.65. Optimism-corrected concordance indices were equal to the second decimal place, as the amount of optimism (bias) was negligibly small given the large size of the dataset. The calibration of observed versus predicted three-year TTR and five-year OS rates was strong across the spectrum of ordered risk groups, with approximately 200 subjects per group (Figure 4). In contrast, AJCC demonstrated reduced C-indices of C = 0.58 for OS and C = 0.59 for TTR, indicating weak discrimination.
Figure 4.
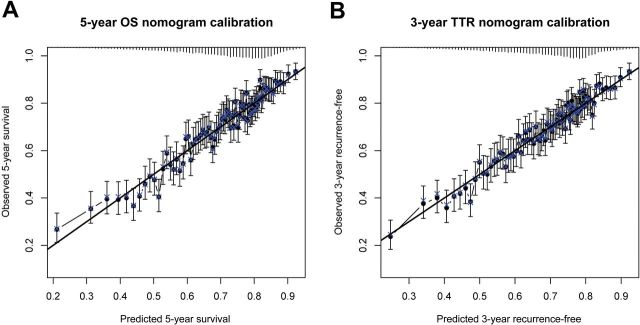
Calibration plots for (A) overall survival at five years and (B) time to recurrence at three years. Error bars are 95% confidence intervals. OS = overall survival; TTR = time to recurrence.
External Validation and Comparison to Numeracy
External validation for OS and comparisons to Numeracy are shown in Table 3, while external validation for TTR is shown in Supplementary Table 2 (available online). When median (across C-08 patients) five-year OS predictions obtained from the ACCENT and Numeracy calculators were compared with the observed Kaplan-Meier five-year OS rates and corresponding 95% confidence intervals (CIs), ACCENT demonstrated greater accuracy than Numeracy, both overall and within 11 of the 13 patient subgroups defined by the five variables in Numeracy. In two cases where Numeracy showed slightly greater accuracy than ACCENT, both methods’ median predictions fell within the observed 95% K-M CI. Average predictions fell outside of the observed 95% K-M CI for seven of 13 subgroups under Numeracy, but only one subgroup for ACCENT. In terms of percentage of correct classification of five-year survival status of C-08 patients, ACCENT was always at least as accurate as Numeracy, both overall (77.5% correct Numeracy; 79.2% correct ACCENT) and within every patient subgroup explored. Differences within subgroups were more pronounced, such as for T4 patients (58.9% accuracy for Numeracy versus 64.9% accuracy for ACCENT) or patients with five or more positive lymph nodes (63.7% accuracy for Numeracy vs 68.7% for ACCENT). Similarly strong external validation results are presented for the TTR final model in Supplementary Table 2 (available online).
Table 3.
Results of external validation of the Adjuvant Colon Cancer End Points (ACCENT) nomogram for overall survival (OS) and comparison of five-year OS predictions for ACCENT vs Numeracy*
| Variable | N | Observed 5-year OS (%) | Median 5-year OS prediction (%) | % Delta: predicted – observed | % Correct: predicted vs observed | ||||
|---|---|---|---|---|---|---|---|---|---|
| K-M | 95% CI | ACCENT | Numeracy | ACCENT | Numeracy | ACCENT | Numeracy | ||
| Overall | 1903 | 78.4 | 76.5 to 80.3 | 77.2 | 75.0 | −1.2 | −3.4 | 79.2 | 77.5 |
| Age, y | |||||||||
| ≤49 | 469 | 81.8 | 78.3 to 85.5 | 79.5 | 81.0 | −2.3 | −0.8 | 82.4 | 82.0 |
| 50–59 | 606 | 81.1 | 78.0 to 84.3 | 79.7 | 78.0 | −1.4 | −3.1 | 81.1 | 79.5 |
| 60–69 | 525 | 77.9 | 74.4 to 81.6 | 76.2 | 76.0 | −1.7 | −1.9 | 79.5 | 76.7 |
| ≥70 | 303 | 68.4 | 63.3 to 73.9 | 68.1 | 74.0 | −0.3 | 5.6 | 70.2 | 68.8 |
| Sex | |||||||||
| Male | 934 | 76.9 | 74.3 to 79.7 | 75.2 | 75.0 | −1.7 | −1.9 | 77.7 | 76.8 |
| Female | 969 | 79.7 | 77.2 to 82.3 | 78.8 | 75.0 | −0.9 | −4.7 | 80.7 | 78.3 |
| Grade | |||||||||
| Low | 1455 | 80.6 | 78.6 to 82.7 | 79.0 | 76.0 | −1.6 | −4.6 | 80.6 | 79.8 |
| High | 448 | 70.9 | 66.7 to 75.3 | 69.6 | 67.0 | −1.3 | −3.9 | 74.6 | 70.3 |
| T-stage | |||||||||
| T1/T2 | 298 | 89.4 | 85.9 to 93.0 | 88.4 | 82.0 | −1.0 | −7.4 | 89.0 | 89.0 |
| T3 | 1443 | 78.3 | 76.2 to 80.5 | 76.1 | 74.0 | −2.2 | −4.3 | 78.7 | 77.3 |
| T4 | 162 | 57.4 | 50.1 to 65.8 | 63.7 | 59.0 | 6.3 | 1.6 | 64.9 | 58.9 |
| Pos. nodes | |||||||||
| 1–4 | 1338 | 84.1 | 82.1 to 86.1 | 80.6 | 78.0 | −3.5 | −6.1 | 83.7 | 83.5 |
| 5+ | 565 | 64.9 | 61.0 to 69.0 | 65.0 | 57.0 | 0.1 | −7.9 | 68.7 | 63.7 |
* Median predictions in bold fall outside the observed 95% K-M confidence interval (CI). Italicized comparisons indicate where Adjuvant Colon Cancer End Points (ACCENT) is worse than Numeracy (though in both cases, the ACCENT predictions are within the observed 95% CI). ACCENT = Adjuvant Colon Cancer End Points; K-M = Kaplan-Meier; OS = overall survival; Pos = positive.
Discussion
The proposed ACCENT-based colon cancer calculators, which we have demonstrated to be both internally and externally valid, have the potential to aid prognostication, patient/physician communication, and risk determination. Intended uses of these tools include physician determination of patient prognosis based on clinical and pathologic features, enhanced discussion of prognosis and treatment plan with individual patients, and risk stratification for future planned clinical trials in stage III disease. In the latter case, quantiles of calculator-obtained predictions—which condense a large set of risk variables into a single score—could replace the typical long list of distinct stratification factors used to balance baseline risk across treatment arms at randomization. In the former case, these calculators may serve as a useful clinical tool to supplement a physician’s intimate knowledge of a patient’s less quantifiable characteristics, such as general overall health or comorbidities.
It should be emphasized that our colon cancer calculators were intentionally constructed using readily available clinical information. At this point in time, purported prognostic or predictive biomarkers such as microsatellite instability (MSI), KRAS, and BRAF and assays such as Oncotype DX were not considered, as the required tests for these biomarkers are not yet widely performed in routine (nontrial) clinical practice. However, as practice changes, these calculators will be extended using accumulating biomarker data from ACCENT. The present tools will also be extended to include stage II disease, where true classification of stage II patients (ie, adequate nodal staging) will be an important consideration.
Because two of the ACCENT trials used for model construction contained irinotecan arms, we chose to model the contribution of these patients by including irinotecan as a treatment class, rather than exclude or ignore irinotecan in the construction process. This inclusion was meant to be comprehensive rather than suggestive: While separate prognoses by treatment class (eg, 5FU with or without addition of oxaliplatin) may be obtained from the published tools and useful in certain situations, it is not our intention that they be utilized for treatment decision-making. We note that for practical clinical purposes, the web calculators omit irinotecan, as irinotecan has failed to demonstrate efficacy in randomized trials. As previously reported, a partial interaction between treatment and all other risk variables was nonsignificant, indicating that absolute treatment benefit was not found to change according to the level of baseline risk.
One potential limitation of our prognostic models is their development using data from clinical trials, as opposed to broader observational or population data. While the advantages inherent to randomized clinical trials—namely, balance of patient characteristics across arms, controlled sources of bias, and meticulous follow-up—would lead to improved prediction modeling in theory, we also recognize the potentially limited generalizability to patients who might not resemble those eligible for enrollment to one of the included trials. It should be noted that Numeracy originated from an even smaller collection of studies (seven vs our 12 ACCENT trials) representing far fewer individual patients (3302 vs our 15936). As our comparison to Numeracy in this article demonstrates, our proposed tools offer improvements in predictive accuracy warranting Numeracy’s replacement in practice.
Of note, we explored a possible time trend (ie, general improvement in outcomes over time) by adding year of patient enrollment to the final models for OS and TTR. While the observed time effect in each case was in the expected direction (specifically, each subsequent year of enrollment was associated with approximately 1% decrease in the hazard of recurrence or death), the trend was highly nonsignificant. Because of difficulties in extrapolating the time effect from the ACCENT trials to the present day, year of enrollment was not included in the final models but will be considered in a planned update and expanded validation of the tools using comprehensive data from C-08 (20), N0147 (22), AVANT (23), and PETACC8 (24) once sufficient follow-up is achieved for integration with ACCENT.
The colon cancer prediction tools described herein are available for use at the following URL: http://www.mayoclinic.org/medical-professionals/adjuvant-systemic-therapy-tools/colon-cancer. Here, the user inputs patient characteristics to obtain predicted probabilities of being recurrence-free at three years and alive at five years beyond treatment initiaton, with confidence intervals. We hope that these calculators, based on a large, rigorously constructed database and demonstrated to be internally and externally valid, will help aid physicians in their discussions with patients with stage III colon cancer.
Funding
Funding was provided by National Cancer Institute Grant CA 25224.
Supplementary Material
This work was previously presented at the American Society of Clinical Oncology 2013 meeting: http://meeting.ascopubs.org/cgi/content/abstract/ 31/15_suppl/3618.
References
- 1. CDC – Colorectal Cancer Statistics. Centers for Disease Control and Prevention. Atlanta, GA: Available at: http://www.cdc.gov/cancer/colorectal/statistics Accessed March 22, 2013. [Google Scholar]
- 2. André T, Boni C, Mounedji-Boudiaf L, et al. Oxaliplatin, fluorouracil, and leucovorin as adjuvant treatment for colon cancer. N Engl J Med. 2004;350(23):2343–2351. [DOI] [PubMed] [Google Scholar]
- 3. André T, Boni C, Navarro M, et al. Improved overall survival with oxaliplatin, fluorouracil, and leucovorin as adjuvant treatment in stage II or III colon cancer in the MOSAIC trial. J Clin Oncol. 2009;27(19):3109–3116. [DOI] [PubMed] [Google Scholar]
- 4. Schmoll H-J, Cartwright T, Tabernero J, et al. Phase III trial of capecitabine plus oxaliplatin as adjuvant therapy for stage III colon cancer: a planned safety analysis in 1,864 patients. J Clin Oncol. 2006;25(1):102–109. [DOI] [PubMed] [Google Scholar]
- 5. Yothers G, O’Connell M, Allegra CJ, et al. Oxaliplatin as adjuvant therapy for colon cancer: updated results of NSABP C-07 trial, including survival and subset analyses. J Clin Oncol. 2011;29(28):3768–3774. [DOI] [PMC free article] [PubMed] [Google Scholar]
- 6. Gill S, Loprinzi CL, Sargent DJ, et al. Pooled analysis of fluorouracil-based adjuvant therapy for stage II and III colon cancer: who benefits and by how much? J Clin Oncol. 2004;22(10):1797–1806. [DOI] [PubMed] [Google Scholar]
- 7. Colorectal Cancer: Prediction Tools. Memorial Sloan-Kettering Cancer Center. New York, NY: Available at: http://www.mskcc.org/cancer-care/adult/colorectal/prediction-tools Accessed March 22, 2013. [Google Scholar]
- 8. Weiser MR, Landmann RG, Kattan MW, et al. Individualized prediction of colon cancer recurrence using a nomogram. J Clin Oncol. 2008;26(3):380–385. [DOI] [PubMed] [Google Scholar]
- 9. Weiser MR, Gönen M, Chou JF, et al. Predicting survival after curative colectomy for cancer: individualizing colon cancer staging. J Clin Oncol. 2011;29(36):4796–4801. [DOI] [PMC free article] [PubMed] [Google Scholar]
- 10. Adjuvant! Online. Adjuvant! Inc. Available at: http://www.adjuvantonline.com/index.jsp Accessed March 22, 2013.
- 11. Gill S, Loprinzi C, Kennecke H, et al. Prognostic web-based models for stage II and III colon cancer. Cancer. 2011;117(18):4155–4165. [DOI] [PMC free article] [PubMed] [Google Scholar]
- 12. Edge SB, Byrd DR, Compton CC, et al. , eds. AJCC Cancer Staging Manual, 7 th ed. New York: Springer; 2010. [Google Scholar]
- 13. Sargent DJ, Wieand HS, Haller DG, et al. Disease-free survival versus overall survival as a primary end point for adjuvant colon cancer studies: individual patient data from 20,898 patients on 18 randomized trials. J Clin Oncol. 2005;23(34):8664–8670. [DOI] [PubMed] [Google Scholar]
- 14. Sargent DJ, Shi Q, Yothers G, et al. Two or three year disease free survival (DFS) as a primary endpoint in stage III adjuvant colon cancer trials with fluoropyrimidines with or without oxaliplatin or irinotecan: data from 12,676 patients from MOSAIC, X-ACT, PETACC-3, C-06, C-07, and C89803. Eur J Cancer. 2011;47(7):990–996. [DOI] [PMC free article] [PubMed] [Google Scholar]
- 15. Little RJ, Rubin D. Statistical Analysis with Missing Data. New York, NY: John Wiley and Sons, Inc.; 2002. [Google Scholar]
- 16. Harrell FE., Jr Regression Modeling Strategies with Applications to Linear Models, Logistic Regression, and Survival Analysis. New York: Springer; 2010. [Google Scholar]
- 17. Grambsch P, Therneau T. Proportional hazards tests and diagnostics based on weighted residuals. Biometrika. 1994;81(3):515–526. [Google Scholar]
- 18. Steyerberg EW. Clinical Prediction Models. New York: Springer; 2010. [Google Scholar]
- 19. R Development Core Team. R: A language and environment for statistical computing (http://www.R-project.org). Vienna: R Foundation for Statistical Computing; 2008.
- 20. Allegra CJ, Yothers G, O’Connell MJ, et al. Phase III trial assessing bevacizumab in stages II and III carcinoma of the colon: results of NSABP protocol C-08. J Clin Oncol. 2011;29(1):11–16. [DOI] [PMC free article] [PubMed] [Google Scholar]
- 21. Renfro LA, Shi Q, Sargent DJ. Mining the ACCENT database: a review and update. Chinese Clin Oncol. 2013;2(2):1–8. [DOI] [PMC free article] [PubMed] [Google Scholar]
- 22. Alberts SR, Sargent DJ, Smyrk TC, et al. Adjuvant mFOLFOX6 with or without cetuximab (Cmab) in KRAS wild-type (WT) patients (pts) with resected stage III colon cancer (CC): Results from NCCTG Intergroup phase III trial N0147. J Clin Oncol. 2010;28 suppl 18. Abstract CRA3507. [Google Scholar]
- 23. de Gramont A, Van Cutsem E, Schmoll HJ, et al. Bevacizumab plus oxaliplatin-based chemotherapy as adjuvant treatment for colon cancer (AVANT): a phase 3 randomised controlled trial. Lancet Oncol. 2012;13(12):1225–1233. [DOI] [PubMed] [Google Scholar]
- 24. Taieb J, Puig PL, Bedenne L. Cetuximab plus FOLFOX-4 for fully resected stage III colon carcinoma: scientific background and the ongoing PETACC-8 trial. Expert Rev Anticancer Ther. 2008;8(2):183–189. [DOI] [PubMed] [Google Scholar]
Associated Data
This section collects any data citations, data availability statements, or supplementary materials included in this article.