

Abstract
Even with prolonged antiretroviral therapy (ART), many human immunodeficiency virus-infected individuals have <500 CD4+ T cells/µL, and CD4+ T cells in lymphoid tissues remain severely depleted, due in part to fibrosis of the paracortical T-cell zone (TZ) that impairs homeostatic mechanisms required for T-cell survival. We therefore used antifibrotic therapy in simian immunodeficiency virus-infected rhesus macaques to determine whether decreased TZ fibrosis would improve reconstitution of peripheral and lymphoid CD4+ T cells. Treatment with the antifibrotic drug pirfenidone preserved TZ architecture and was associated with significantly larger populations of CD4+ T cells in peripheral blood and lymphoid tissues. Combining pirfenidone with an ART regimen was associated with greater preservation of CD4+ T cells than ART alone and was also associated with higher pirfenidone concentrations. These data support a potential role for antifibrotic drug treatment as adjunctive therapy with ART to improve immune reconstitution.
Keywords: HIV, fibrosis, immune reconstitution, fibroblastic reticular cell network, T-cell depletion
Normal T-cell homeostasis and immune system function depend on the organized structure of the paracortical T-cell zone (TZ) of secondary lymph nodes (LNs). Here, the fibroblastic reticular cell network (FRCn) provides a highly organized framework where T cells and antigen-presenting cells interact by rolling along the exterior surface of the FRCn, directed in their movement via interaction of cell-associated L-selectin adhesion molecules with peripheral LN node addressins on the FRCn [1–5]. These hollow FRCn fibers also form a conduit system for delivery of soluble antigen and cytokines, and provide a source and access to growth factors critical for T-cell survival and proliferation such as interleukin 7 (IL-7) [1, 6–10].
Human immunodeficiency virus (HIV) infection significantly damages the FRCn, which leads to T-cell depletion and limits immune reconstitution with antiretroviral treatment (ART). Regulatory T cells are recruited into lymphoid tissues where the virus is replicating and produce transforming growth factor β (TGF-β) [11]. While TGF-β moderates the immunopathologic consequences of immune activation, it also induces fibroblasts to produce collagen and other extracellular matrix proteins that eventually replace the FRCn, resulting in loss of the important T-cell survival cytokine IL-7 [11–13] and leading to naive T-cell depletion [14].
Given the key roles of collagen in CD4+ T-cell loss before initiation of ART [15, 16] and immune reconstitution with ART [17] and the key role of TGF-β in driving lymphoid tissue fibrosis, we reasoned that interfering with this process could preserve and restore CD4+ T-cell populations. We investigated the potential benefit of the antifibrotic drug pirfenidone (5-methyl-1-phenylpyridin-2-one), which is a pyridone molecule that inhibits TGF-β–signaling pathways [18–20]. Pirfenidone has been effective in preventing or reversing fibrosis in several experimental models of fibrosis [21–26].
We used a nonhuman primate model of simian immunodeficiency virus (SIV) infection, having previously shown that the lymphoid tissue fibrosis seen in HIV-infected humans is recapitulated in SIV-infected rhesus macaques [12, 14]. Our experiments were designed to determine whether antifibrotic therapy limits loss of CD4+ T cells in lymphoid tissues and improves immune reconstitution. We show that SIV-infected animals treated with pirfenidone have significantly less TZ collagen and significantly greater numbers of CD4+ T cells in peripheral blood and LNs than untreated controls and that pirfenidone in combination with ART significantly improves restoration of CD4+ T-cell populations. These data provide a rationale for testing antifibrotic drugs as adjunctive treatment in HIV infection to slow progression of disease and improve immune reconstitution.
MATERIALS AND METHODS
Protocol Description
Experimental Design
We used a 2-step approach. In the first series of experiments, we initiated pirfenidone treatment at the time of SIV infection to determine whether LN fibrosis could be prevented and whether the rate of CD4+ T-cell loss would be decreased. In the second experiment, we infected a group of animals and waited 6 weeks (ie, until onset of early chronic infection) before starting pirfenidone therapy, to see whether collagen formation in the LN could be reversed, as this more closely recapitulates timing of therapy in HIV infection. Preliminary pharmacokinetic studies identified 200 mg/kg as a dose providing targeted serum levels.
In experiment 1, we used 22 animals divided into 6 groups (Figure 1A) followed for 24 weeks after infection. Group A (n = 3) were controls and did not receive any antifibrotic or antiretroviral therapy; group B (n = 3) received pirfenidone from week 2 before infection through 12 weeks after infection; group C (n = 3) received ART only, starting 8 weeks after infection; group D (n = 3) received pirfenidone, starting 2 weeks before infection, and ART, starting 8 weeks after infection, with both regimens continued through 24 weeks after infection; group E (n = 5) received ART only, starting 6 weeks after infection and continuing through 24 weeks after infection; and group F (n = 5) received pirfenidone, starting 2 weeks before infection, and ART, starting 6 weeks after infection.
Figure 1.

Protocol schema. Timeline of protocol events are shown. A, Events for the first set of experiments, in which pirfenidone therapy was started before the time of infection. Pirfenidone treatment was started 2 weeks before infection, to ensure steady state levels of drug in groups B, D, and E at the time of infection. Pirfenidone therapy was discontinued in group B after 12 weeks, to determine whether collagen levels increased after treatment cessation. In groups D and F, pirfenidone therapy was continued from 2 weeks before infection through the full 24 weeks of postinfection follow-up. B, Events for the second experiment, in which pirfenidone treatment was started 6 weeks after infection. Abbreviations: ART, antiretroviral therapy; SIV, simian immunodeficiency virus.
In experiment 2, in which pirfenidone therapy was started 6 weeks after infection, we used 12 animals divided into 2 groups (Figure 1B) and followed through 24 weeks after infection. Group G (n = 6) started pirfenidone treatment and ART 6 weeks after infection, and group H (n = 6) started ART only 6 weeks after infection.
In vivo primate studies were conducted at the National Cancer Institute, National Institutes of Health (NIH; Bethesda, Maryland), and at Bioqual (Rockville, Maryland). Animals were housed and cared for in accordance with American Association for Accreditation of Laboratory Animal Care (AAALAC) standards in AAALAC-accredited facilities, and all animal procedures were performed according to protocols approved by the Institutional Animal Care and Use Committees of the University of Minnesota, by the National Cancer Institute, and by Bioqual. Animals were screened to exclude the major histocompatibility complex class I alleles Mamu B*17 and B*08, to exclude spontaneous control of viral replication [27, 28]. Animals were inoculated intravenously with 30 50% monkey infective doses of SIVmac239 (courtesy of Dr R. Desrosiers, Harvard Medical School/New England Primate Research Center). Pirfenidone was obtained from InterMune (Brisbane, California) for the 3 group B animals; for the other groups, it was obtained through the NIH AIDS Research and Reference Reagents Program. The dose was 200 mg/kg, orally, twice daily, which provided serum levels equivalent to those that were shown in clinical trials to be effective in humans with idiopathic pulmonary fibrosis.
In experiment 1, we used PMPA (20 mg/kg/day) and emtricitabine (FTC; 50 mg/kg/day), administered subcutaneously, and the integrase strand transfer inhibitor L-870812 (Merck Research Laboratories, West Point, Pennsylvania) at 100 mg, administered twice daily with food. In experiment 2, we used FTC and PMPA (at the same doses) plus raltegravir (100 mg twice daily orally), darunavir (400 mg twice daily orally), and ritonavir (100 mg twice daily orally).
Plasma Viral Load
SIV RNA in plasma was quantified using a quantitative, real-time polymerase chain reaction assay [29].
Quantitative Image Analysis
High magnification images from whole tissue scans were obtained with an Aperio Scanscope (Aperio, Vista, California) after trichrome, picrosirius red, or antibody staining. We used Photoshop CS5 (Adobe, San Jose, California) to quantify the positively stained area of the tissue, using specialized plug-in tools from Reindeer Graphics (Reindeer Graphic, Asheville, North Carolina) as detailed previously [15, 17, 30].
Inflammation and Fibrosis Candidate Biomarkers
d-dimer levels were measured by the STAR automated coagulation analyzer (Diagnostica Stago), using an immunoturbidometric assay (Liatest D-DI; Diagnostica Stago, Parsippany, New Jersy). Interleukin 6 (IL-6) levels were measured by the quantitative sandwich enzyme immunoassay technique (Quantiglo Human IL-6 Immunoassay; R&D Systems, Minneapolis, Minnesota). Levels of serum C-terminal propeptide of type I collagen (CICP) were measured using a commercial sandwich enzyme immunoassay according to the manufacturer's instructions (Metra CICP, Quidel, San Diego, California). Levels of serum hyaluronan were measured using a commercial, competitive enzyme-linked immunosorbent assay according to the manufacturer's instructions (Echelon Biosciences, Salt Lake City, Utah).
Flow Cytometry
Freshly isolated cells (peripheral blood mononuclear cells [PBMCs] or lymph node mononuclear cells [LNMCs]) were immunophenotyped using the following antibody panel: CD4 Pacific Blue (clone OKT4; BioLegend), CCR5 phycoerythrin (PE; clone 3A9; BD Biosciences), CD28 ECD (clone CD28.2; Beckman Coulter, Miami, Florida), CD95 PE-Cy5 (clone DX2; BD), CD8 PE-Cy7 (clone SK1: BD), CD38 allophycocyanin (APC; clone OK10; NIH Nonhuman Primate Reagent Resource), CD3 APC-Cy7 (clone SP34-2; BD), and Ki67 fluorescein isothiocyanate (clone B56; BD). Surface and intracellular staining were performed using the eBioscience Fix/Perm reagents and protocol.
Statistical Analysis
To test for differences between 2 independent groups, 2-sample t tests were used. To test for differences between groups over time when there were only data for 2 time points, differences over time were computed for each animal, and a 2-sample t test was used to test for differences over time. In addition, mixed-effects models were used to analyze data obtained from these longitudinal studies. For the CD4+ T-cell outcomes and extent of fibrosis, we assumed that after infection there is a linear trajectory over time, with slopes that are potentially pirfenidone dependent upon administration of pirfenidone. We also considered extensions of these models that allowed for nonlinear trajectories (parameterized as polynomials), but none of the variables we investigated supported nonlinear trajectories in the sense that the regression coefficients for the nonlinear terms were not statistically significant. The test for the effect of pirfenidone, then, is the test for a difference in slopes over time between the group of animals receiving pirfenidone and those animals not receiving pirfenidone. These models also have effects for which experiment the animals was from and whether the animal was receiving ART at the time the data were collected. Logarithmic transformations were used before model fitting. To test for differences in pSmad2,3 levels between animals given pirfenidone and those not given pirfenidone, a mixed-effects model was fit that modeled the log of pSmad2,3 levels as depending on time (parameterized so each time point had its own parameter), group membership, baseline pSmad2,3 level, and the interaction between time and group membership. The test for a group difference was then conducted using a likelihood ratio test for the model just described, compared with a model that had no effect of pirfenidone. All mixed-effects models were fit using the lme routine in the nlme package for the R statistical software language, version 2.15.
RESULTS
No Effect of Pirfenidone on Viral Replication
Animals receiving ART had a significant decrease in plasma viral load, as expected (P < .0001). Consistent with other nonhuman primate models of SIV infection, the ability of the regimen to fully suppress viral replication was incomplete, but all animals experienced at least a 3-log reduction in plasma viremia, with one third ultimately suppressing replication to below the limits of detection (50 copies/mL). We found no direct effect of pirfenidone on viral replication over time (P = .41).
Pirfenidone Therapy Inhibits Fibrosis in the TZ When Started at the Time of Infection and Reverses Fibrosis in Chronic Infection
We used 4 different established methods to assess lymphoid tissue fibrosis in vivo: (1) a modified trichrome stain, (2) immunohistochemistry (IHC) analysis for collagen type I, (3) IHC analysis for fibronectin, and (4) picrosirius red staining to identify collagen fibers. Although each assay identified a different component of the fibrotic scar in lymphoid tissue, we used the modified trichrome or picrosirius red histological staining approaches for all quantitative image analyses throughout this study, because these methods are not based on identification of a single extracellular matrix protein within the fibrotic scar, because we have extensively published on the trichrome approach [12, 15–17, 30], and because all methods gave comparable results when compared to quantitative IHC for collagen type 1 and fibronectin.
Pirfenidone treatment beginning 2 weeks before infection and continued through 24 weeks after infection significantly limited lymphoid tissue fibrosis (Figure 2A) and was associated with a lower rate of collagen formation (P = .005). Animals that did not receive pirfenidone had a statistically significant increase in collagen formation, compared with baseline (P <.0001; 95% confidence interval [CI] for the rate of change, .196–.424; Figure 2B). Importantly, the proportion of the TZ occupied by collagen in the 3 animals receiving no ART and no pirfenidone (group A) was similar to levels previously reported in HIV-infected humans [11]. In striking contrast, there was no significant change from baseline in the amount of collagen in the 11 animals treated with pirfenidone (ie, groups B, D, and F; P = .609; 95% CI for the rate of change, −.141 to .241). These results, adjusted for the effect of ART, experiment-specific effects, and time, demonstrate that the effect of pirfenidone on the rate of collagen deposition is independent of the effect of ART.
Figure 2.
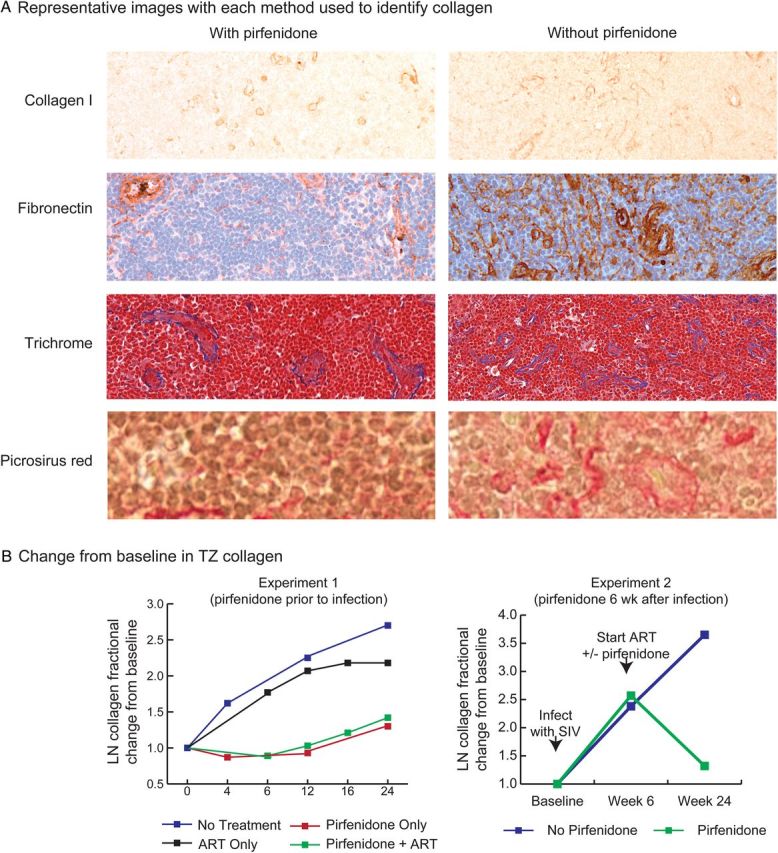
Quantitative analysis of paracortical T-cell zone (TZ) collagen between treatment groups. A, Representative sections from biopsy specimens obtained at week 24 from 2 animals, one treated with pirfenidone and one not treated with pirfenidone. Sections of lymph node (LN) specimens were stained with antibodies to collagen I, fibronectin, trichrome (collagen fibers staining blue), and picrosirius red. All 4 methods demonstrated significant increases in collagen in the animal that did not receive pirfenidone, compared with the animal that did. B, Results of quantitative image analyses on trichrome-stained sections (experiment 1) and picrosirius red–stained sections (experiment 2) of tissues obtained from before and during therapy to determine whether there were significant changes in TZ collagen within each group over time. In experiment 1, in which pirfenidone therapy was started at the time of infection, there was no significant increase in TZ collagen over 24 weeks in groups B, D, and F, which received pirfenidone (P = .609 relative to baseline), but there was a significant increase from baseline in groups A, C, and E, which did not receive pirfenidone (P < .0001 relative to baseline). In experiment 2, the animals that did not receive pirfenidone had progressively greater amounts of collagen in the TZ at each time point, whereas in the animals that received pirfenidone there was an increase in TZ collagen in the first 6 weeks after infection, as expected, but after 18 weeks of pirfenidone therapy there was a significant decrease in TZ collagen (P = .0356, by the 2 sample t test) and a significant difference in the total amount of TZ collagen between groups (P = .0068, by the 2 sample t test). Abbreviations: ART, antiretroviral therapy; SIV, simian immunodeficiency virus.
In the second experiment, we started pirfenidone therapy 6 weeks after infection (groups G and H; Figure 1B) and compared changes in TZ collagen between groups. Pirfenidone therapy was associated with a reduction in levels of TZ fibrosis (Figure 2B). Comparison of week 6 and week 24 collagen levels between the 2 groups showed them to be significantly different (P = .0356, by the 2-sample t test), with the pirfenidone group showing a significant decline (P = .0068, by the 2-sample t test) and levels in the animals not receiving pirfenidone continuing to increase.
We examined the mechanism for pirfenidone-based inhibition of collagen formation and found that it was associated with reductions in phosphorylated SMAD2,3 (pSMAD2,3) but not TGF-β protein expression (Figure 3).
Figure 3.

Transforming growth factor β (TGF-β) and pSmad2,3 expression in animals receiving or not receiving pirfenidone treatment. We analyzed tissue specimens from groups E and F for quantitative differences in TGF-β and pSmad2,3 levels. A, Representative images of immunohistochemistry analysis of TGF-β and pSmad2,3 expression, showing comparable frequencies of TGF-β–expressing cells in both groups. However, there was a significant decrease in pSmad2,3 expression in animals that received pirfenidone (group F). Quantitative image analysis demonstrated significant differences in levels of pSmad2,3 staining between treatment groups. Abbreviation: TZ, paracortical T-cell zone.
Pirfenidone Treatment Is Associated With Preservation of CD4+ T Cells in Both Peripheral Blood and LNs When Initiated at the Time of Infection
We next measured the impact of pirfenidone therapy on changes in peripheral blood CD4+ T-cell populations. PBMC samples from animals starting pirfenidone therapy at the time of infection (groups A–F) were analyzed by flow cytometry to assess the total CD4+ T lymphocyte population and the relative subpopulations of naive, effector memory, and central memory CD4+ T cells. Mixed-effects models that controlled for the effect of ART, experimental effects and time indicate that pirfenidone had a statistically significant impact on limiting the rate of decay of the total CD4+ T-cell count in peripheral blood (P < .0001; Figure 4). Similar models applied to the CD4+ T-cell subsets demonstrated a significant decline in the numbers of all 3 subsets in animals that did not receive pirfenidone (P < .0001 for naive cells, P = .0061 for central memory cells, and P < .0001 for effector memory cells), but the rate of decay of naive and central memory CD4+ T cells was significantly slower in animals that received pirfenidone (P = .0006 and P < .0001, respectively). Moreover, the 95% CI for the rate of change in the central memory population among animals receiving pirfenidone was .0075–.0218 (log percent of cells) per day, indicating that central memory cells are actually increasing over time. Thus, treatment with pirfenidone was associated with a slower rate of decline in the total CD4+ T-cell population and increases in the population of central memory cells in peripheral blood. Of interest, we found no significant difference in the frequency of Ki67+ cells in peripheral blood between animals starting pirfenidone therapy at the time of infection and controls, but there was a trend toward an increased frequency of Ki67+ cells in peripheral blood among animals receiving pirfenidone (P = .0515).
Figure 4.

Pirfenidone therapy is associated with preservation of CD4+ T cells in peripheral blood mononuclear cells. Comparison of the mean change from baseline in the percentage of T cells expressing CD4 for the groups receiving pirfenidone (B, D, and E) to that for the groups that did not receive pirfenidone (A, C, and F) revealed a significant difference in the rate of decay of CD4+ T cells (P < .0001).
The impact of pirfenidone therapy on CD4+ T-cell populations among animals in which this treatment was started at the time of infection was even more pronounced in LNs (Figure 5 and Supplementary Figure 1). The rate of change in the overall CD4+ T-cell frequency, in addition to the frequency of each population subset, was found to be significantly impacted by pirfenidone (P < .0001 for the overall count, P < .0001 for the naive population, P = .0017 for the central memory population, and P = .0003 for the effector memory population). The 95% confidence interval for the rate of change in the overall count was .006–.032 cells/µ, indicating that pirfenidone treatment was associated with an increase in the overall CD4+ T-cell count. There was an estimated 14% increase over 24 weeks in overall CD4+ T-cell levels in LNs, compared with an 8% reduction among animals not receiving pirfenidone. We did not detect a significant difference in the size of the peripheral blood or LN CD4+ T-cell population in animals starting pirfenidone therapy 6 weeks after infection. This may be because reversing fibrosis is a slow and inefficient process and the duration of this study was only 24 weeks.
Figure 5.
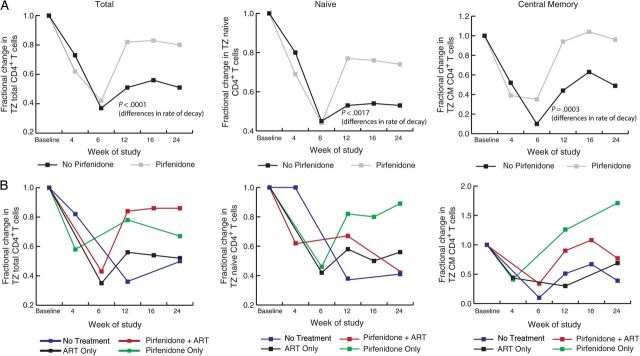
Pirfenidone therapy is associated with preservation of the total, naive, and central memory populations of CD4+ T cells in lymphatic tissues. A, Comparison of the area of the paracortical T-cell zone (TZ) containing total, naive, and central memory CD4+ T cells between groups B, D, and F (all of which received pirfenidone) and groups A, C, and E (all of which did not receive pirfenidone). Pirfenidone therapy was associated with preservation of CD4+ T cells, whereas the groups that did not receive pirfenidone had significant decreases. B, The fractional change in TZ CD4+ T-cell populations over time in the individual treatment groups (group A, no treatment; group B, pirfenidone only; groups C and E, antiretroviral therapy [ART] only; and groups D and F, pirfenidone plus ART).
FRCn Preservation With Pirfenidone Treatment
Desmin is a marker for the FRCs that make up the FRCn, and desmin levels are significantly decreased in association with collagen deposition in the TZ in SIV-infected macaques [13]. We compared immunostaining for desmin in the TZ of LNs obtained before infection and 24 weeks after infection from animals in groups C and D (all of which were treated with pirfenidone prior before infection). There was significant loss of the FRCn in the control animals that did not receive pirfenidone, but there was no significant change from baseline in the pirfenidone-treated animals (P = .005, by the 2 sample t test; Figure 6). The 95% CI for the change over time in the pirfenidone-treated group was −.0290 to .0521, whereas it was −.1073 to −.0903 in the group that did not receive pirfenidone (Figure 6B).
Figure 6.
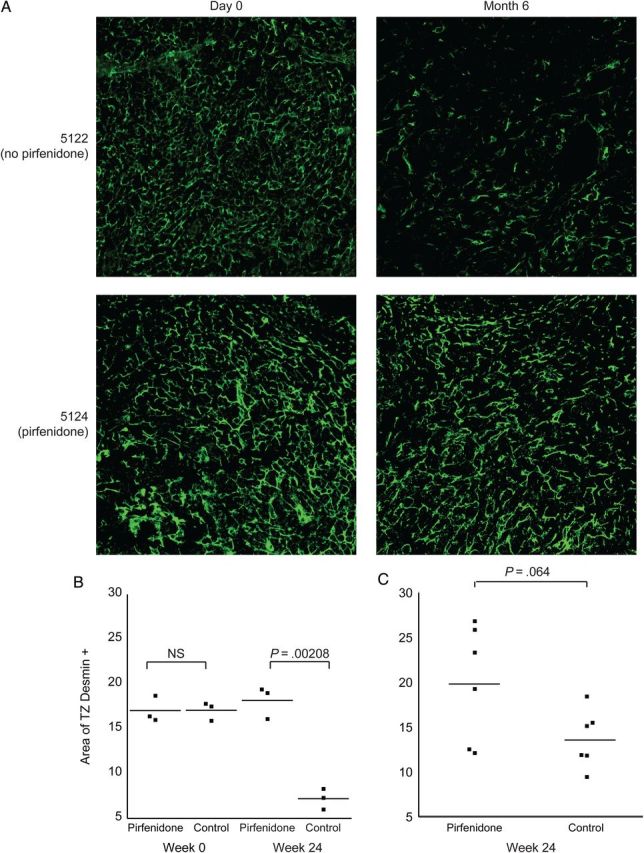
Evidence for preservation and restoration of the fibroblastic reticular cell network (FRCn). A, Results of immunohistochemistry analysis with antibodies against desmin, illustrating differences in the size of the FRCn in 2 representative animals at baseline and the final time point. Animal 5122 did not receive pirfenidone, and there was significant depletion of the FRCn. In contrast, animal 5124 received pirfenidone, and there was preservation of the FRCn. B, Findings of quantitative image analysis of the size of the FRCn in groups C and D (group C is the control group, which did not receive pirfenidone, and group D is the treated group that started pirfenidone at the time of infection). There was a significant decrease in the FRCn in animals that did not receive pirfenidone (group C), but there was preservation of the FRCn in animals that received pirfenidone (group D). C, Findings of quantitative image analysis for animals that received pirfenidone 6 weeks after infection (experiment 2; group H), compared with those for animals that did not receive pirfenidone (experiment 2; group G). Although the difference did not achieve statistical significance (P = .064), there was a trend toward restoration of the FRCn with pirfenidone treatment. Abbreviations: NS, not significant; TZ, paracortical T-cell zone.
We next measured desmin staining for the animals that received pirfenidone 6 weeks after infection, for comparison to findings for the group that did not receive pirfenidone. Although we did not detect significant differences in the amount of TZ desmin between the groups, there was a trend toward increased desmin levels in the pirfenidone-treated group (P = .0698, by the 2 sample t test).
Serum Markers of Fibrosis
We measured levels of 4 inflammatory biomarkers as potential correlates for fibrosis in lymphoid tissue: (1) d-dimer, a small protein that is a byproduct of fibrin degradation; (2) the inflammatory cytokine IL-6; (3) hyaluronan, a high-molecular-weight anionic polysaccharide composed of repeating disaccharides of glucuronate acetylglucosamine that is an indicator of tissue fibrosis and was recently linked to mortality in patients with HIV infection [31]; and (4) C-terminal propeptide of type I collagen (CICP), which increases with collagen synthesis and is produced in a constant molar ratio to type I collagen [32]. We measured these biomarkers in serum samples from groups E and F and found that pirfenidone therapy was associated with a 31% reduction in CICP levels over the 24-week study period (P = .032 for CICP; 95% CI, −.311 to −.015 ng/ml). There was no significant difference in measures of hyaluronan (95% CI, −.057 to .020 ng/ml), d-dimer (95% CI, −.030 to .046 µg/ml), and IL-6 (95% CI, −.080 to .023 pg/ml). Thus, CICP may have potential as a serum marker of antifibrotic treatment activity.
DISCUSSION
We have previously shown that lymphoid tissue TZ fibrosis associated with SIV and HIV infection is a significant factor in both CD4+ T-cell loss and incomplete immune reconstitution with ART [12, 17, 30]. In this study, we show that lymphoid tissue fibrosis can be prevented and potentially reversed with antifibrotic therapy, which may have a significant CD4+ T-cell benefit. We did not show a significant CD4+ T-cell gain when pirfenidone was given 6 weeks after infection and believe this was due to the animals receiving drug for only 18 weeks. It is likely that a longer period of therapy will be required to more completely restore the FRCn and have a significant increase on CD4+ T cell count.
We chose pirfenidone as an agent with the potential to inhibit lymphoid tissue fibrosis, based on in vitro and in vivo data demonstrating an ability to prevent collagen formation and restore normal tissue architecture and function in diseases associated with fibrosis [18–20, 22–24, 26, 33–36]. We did not establish that pirfenidone blocks production of TGF-β but did show that it inhibits TGF-β–dependent pSmad2,3 signaling, resulting in prevention of fibrosis and substantial protection of the FRCn. We found that starting pirfenidone therapy and ART after 6 weeks of infection led to a significant decrease in TZ collagen and a trend toward increasing restoration of the FRCn (ie, increasing desmin).
Pirfenidone was safe and effective when given at the treatment doses we used. The pharmacokinetic characteristics at a dose of 200 mg/kg are comparable to published pharmacokinetic data in humans [4, 37].
We identified a potential biomarker to monitor the effects of antifibrotic therapy, which could circumvent the difficulties in obtaining and analyzing large numbers of longitudinal LN biopsy specimens. We looked at several serum markers of inflammation in our study, including IL-6 and d-dimer, levels of which did not correlate with TZ fibrosis or changes in CD4+ T-cell populations. However, when we examined changes in hyaluronan and CICP levels, we found significant differences. Of interest, this may be a reason that hyaluronan has been linked to disease progression and survival [31]. It will be important to identify and validate markers such as these as we contemplate clinical efficacy trials.
There is now little doubt of the importance of lymphatic fibrosis as a key factor contributing to the pathogenesis of HIV infection. It is a significant cause of CD4+ T-cell depletion in untreated individuals and a significant cause of impaired immune reconstitution, despite good control of viral replication and normalization of immune activation during ART. Collagen deposition into the TZ occurs in a disease-stage-dependent fashion, with increasing levels seen with progression toward AIDS. It seems likely that a strategy of early initiation of antifibrotic therapy would provide the best opportunity for improved immune reconstitution when combined with effective ART, and, if initiated early, such adjunctive antifibrotic therapy may only need to be used for a limited time, until effective viral suppression is achieved.
Supplementary Data
Supplementary materials are available at The Journal of Infectious Diseases online (http://jid.oxfordjournals.org/). Supplementary materials consist of data provided by the author that are published to benefit the reader. The posted materials are not copyedited. The contents of all supplementary data are the sole responsibility of the authors. Questions or messages regarding errors should be addressed to the author.
Notes
Acknowledgments. We thank Daria Hazuda (Merck Research Laboratories; West Point, Pennsylvania), for providing the integrase strand transfer inhibitor L-870812; Dr N. Bischofberger (Gilead Sciences; Foster City, California), for providing (R)-9-(2-phosphonylmethoxypropyl) adenine (tenofovir) and 4-amino-5-fluoro-1-[(2R,5S)-2-(hydroxymethyl)-1,3-oxathiolan-5-yl]-1,2-dihydropyrimidin-2-one (emtricitabine); InterMune, for providing pirfenidone for group B; and the National Institutes of Health AIDS Research and Reference Reagents program, for providing pirfenidone.
Financial support. This work was supported by the National Institutes of Health (grants R01AI054232, K24AI056986, and R01AI093319 to P. I. S.; and grants AI028246, AI048484, and AI056997 to A. T. H.) and the National Cancer Institute (grant HHSN261200800001E).
Potential conflicts of interest. All authors: No reported conflicts.
All authors have submitted the ICMJE Form for Disclosure of Potential Conflicts of Interest. Conflicts that the editors consider relevant to the content of the manuscript have been disclosed.
References
- 1.Dummer W, Ernst B, LeRoy E, Lee D, Surh C. Autologous regulation of naive T cell homeostasis within the T cell compartment. J Immunol. 2001;166:2460–8. doi: 10.4049/jimmunol.166.4.2460. [DOI] [PubMed] [Google Scholar]
- 2.Gretz JE, Anderson AO, Shaw S. Cords, channels, corridors and conduits: critical architectural elements facilitating cell interactions in the lymph node cortex. Immunol Rev. 1997;156:11–24. doi: 10.1111/j.1600-065x.1997.tb00955.x. [DOI] [PubMed] [Google Scholar]
- 3.Kaldjian EP, Gretz JE, Anderson AO, Shi Y, Shaw S. Spatial and molecular organization of lymph node T cell cortex: a labyrinthine cavity bounded by an epithelium-like monolayer of fibroblastic reticular cells anchored to basement membrane-like extracellular matrix. Int Immunol. 2001;13:1243–53. doi: 10.1093/intimm/13.10.1243. [DOI] [PubMed] [Google Scholar]
- 4.Kataki T, Shimizu A. The network of fibroblastic reticular cells in the lymph node: functional framework for immune surveillance. Curr Immunol Rev. 2007;3:251–7. [Google Scholar]
- 5.Von Andrian UH, Mempel TR. Homing and cellular traffic in lymph nodes. Nat Rev Immunol. 2003;3:867–78. doi: 10.1038/nri1222. [DOI] [PubMed] [Google Scholar]
- 6.Rathmell JC, Farkash EA, Gao W, Thompson CB. IL-7 enhances the survival and maintains the size of naive T cells. J Immunol. 2001;167:6869–76. doi: 10.4049/jimmunol.167.12.6869. [DOI] [PubMed] [Google Scholar]
- 7.Bajenoff M, Egen JG, Koo LY, et al. Stromal cell networks regulate lymphocyte entry, migration, and territoriality in lymph nodes. Immunity. 2006;25:989–1001. doi: 10.1016/j.immuni.2006.10.011. [DOI] [PMC free article] [PubMed] [Google Scholar]
- 8.Tan JT, Dudl E, LeRoy E, et al. IL-7 is critical for homeostatic proliferation and survival of naive T cells. Proc Natl Acad Sci U S A. 2001;98:8732–7. doi: 10.1073/pnas.161126098. [DOI] [PMC free article] [PubMed] [Google Scholar]
- 9.Gretz JE, Norbury CC, Anderson AO, Proudfoot AE, Shaw S. Lymph-borne chemokines and other low molecular weight molecules reach high endothelial venules via specialized conduits while a functional barrier limits access to the lymphocyte microenvironments in lymph node cortex. J Exp Med. 2000;192:1425–40. doi: 10.1084/jem.192.10.1425. [DOI] [PMC free article] [PubMed] [Google Scholar]
- 10.Sixt M, Kanazawa N, Selg M, et al. The conduit system transports soluble antigens from the afferent lymph to resident dendritic cells in the T cell area of the lymph node. Immunity. 2005;22:19–29. doi: 10.1016/j.immuni.2004.11.013. [DOI] [PubMed] [Google Scholar]
- 11.Estes JD, Li Q, Reynolds MR, et al. Premature induction of an immunosuppressive regulatory T cell response during acute simian immunodeficiency virus infection. J Infect Dis. 2006;193:703–12. doi: 10.1086/500368. [DOI] [PubMed] [Google Scholar]
- 12.Estes JD, Wietgrefe S, Schacker T, et al. Simian immunodeficiency virus-induced lymphatic tissue fibrosis is mediated by transforming growth factor beta 1-positive regulatory T cells and begins in early infection. J Infect Dis. 2007;195:551–61. doi: 10.1086/510852. [DOI] [PubMed] [Google Scholar]
- 13.Zeng M, Smith AJ, Wietgrefe SW, et al. Cumulative mechanisms of lymphoid tissue fibrosis and T cell depletion in HIV-1 and SIV infections. J Clin Invest. 2011;121:998–1008. doi: 10.1172/JCI45157. [DOI] [PMC free article] [PubMed] [Google Scholar]
- 14.Estes JD, Haase AT, Schacker TW. The role of collagen deposition in depleting CD4+ T cells and limiting reconstitution in HIV-1 and SIV infections through damage to the secondary lymphoid organ niche. Semin Immunol. 2008;20:181–6. doi: 10.1016/j.smim.2008.04.002. [DOI] [PMC free article] [PubMed] [Google Scholar]
- 15.Schacker TW, Brenchley JM, Beilman GJ, et al. Lymphatic tissue fibrosis is associated with reduced numbers of naive CD4+ T cells in human immunodeficiency virus type 1 infection. Clin Vaccine Immunol. 2006;13:556–60. doi: 10.1128/CVI.13.5.556-560.2006. [DOI] [PMC free article] [PubMed] [Google Scholar]
- 16.Schacker TW, Nguyen PL, Beilman GJ, et al. Collagen deposition in HIV-1 infected lymphatic tissues and T cell homeostasis. J Clin Invest. 2002;110:1133–9. doi: 10.1172/JCI16413. [DOI] [PMC free article] [PubMed] [Google Scholar]
- 17.Schacker TW, Reilly C, Beilman GJ, et al. Amount of lymphatic tissue fibrosis in HIV infection predicts magnitude of HAART-associated change in peripheral CD4 cell count. AIDS. 2005;19:2169–71. doi: 10.1097/01.aids.0000194801.51422.03. [DOI] [PubMed] [Google Scholar]
- 18.Lee BS, Margolin SB, Nowak RA. Pirfenidone: a novel pharmacological agent that inhibits leiomyoma cell proliferation and collagen production. J Clin Endocrinol Metab. 1998;83:219–23. doi: 10.1210/jcem.83.1.4503. [DOI] [PubMed] [Google Scholar]
- 19.Dosanjh A, Ikonen T, Wan B, Morris RE. Pirfenidone: A novel anti-fibrotic agent and progressive chronic allograft rejection. Pulm Pharmacol Ther. 2002;15:433–7. doi: 10.1006/pupt.2002.0367. [DOI] [PubMed] [Google Scholar]
- 20.Giri SN, Wang Q, Xie Y, et al. Pharmacokinetics and metabolism of a novel antifibrotic drug pirfenidone, in mice following intravenous administration. Biopharm Drug Dispos. 2002;23:203–11. doi: 10.1002/bdd.311. [DOI] [PubMed] [Google Scholar]
- 21.Brook NR, Waller JR, Bicknell GR, Nicholson ML. The experimental agent pirfenidone reduces pro-fibrotic gene expression in a model of tacrolimus-induced nephrotoxicity. J Surg Res. 2005;125:137–43. doi: 10.1016/j.jss.2004.12.007. [DOI] [PubMed] [Google Scholar]
- 22.Garcia L, Hernandez I, Sandoval A, et al. Pirfenidone effectively reverses experimental liver fibrosis. J Hepatol. 2002;37:797–805. doi: 10.1016/s0168-8278(02)00272-6. [DOI] [PubMed] [Google Scholar]
- 23.Miric G, Dallemagne C, Endre Z, Margolin S, Taylor SM, Brown L. Reversal of cardiac and renal fibrosis by pirfenidone and spironolactone in streptozotocin-diabetic rats. Br J Pharmacol. 2001;133:687–94. doi: 10.1038/sj.bjp.0704131. [DOI] [PMC free article] [PubMed] [Google Scholar]
- 24.Negri AL. Prevention of progressive fibrosis in chronic renal diseases: antifibrotic agents. J Nephrol. 2004;17:496–503. [PubMed] [Google Scholar]
- 25.Tian XL, Yao W, Guo ZJ, Gu L, Zhu YJ. Low dose pirfenidone suppresses transforming growth factor beta-1 and tissue inhibitor of metalloproteinase-1, and protects rats from lung fibrosis induced by bleomycina. Chin Med Sci J. 2006;21:145–51. [PubMed] [Google Scholar]
- 26.Zhao XY, Zeng X, Li XM, Wang TL, Wang BE. Pirfenidone effectively inhibits carbon tetrachloride- and albumin complex-induced liver fibrosis in rodents by preventing activation of hepatic stellate cells. Clin Exp Pharmacol Physiol. 2009;36:963–8. doi: 10.1111/j.1440-1681.2009.05194.x. [DOI] [PubMed] [Google Scholar]
- 27.Loffredo JT, Maxwell J, Qi Y, et al. Mamu-B*08-positive macaques control simian immunodeficiency virus replication. J Virol. 2007;81:8827–32. doi: 10.1128/JVI.00895-07. [DOI] [PMC free article] [PubMed] [Google Scholar]
- 28.O'Connor DH, Mothe BR, Weinfurter JT, et al. Major histocompatibility complex class I alleles associated with slow simian immunodeficiency virus disease progression bind epitopes recognized by dominant acute-phase cytotoxic-T-lymphocyte responses. J Virol. 2003;77:9029–40. doi: 10.1128/JVI.77.16.9029-9040.2003. [DOI] [PMC free article] [PubMed] [Google Scholar]
- 29.Cline AN, Bess JW, Piatak M, Jr, Lifson JD. Highly sensitive SIV plasma viral load assay: practical considerations, realistic performance expectations, and application to reverse engineering of vaccines for AIDS. J Med Primatol. 2005;34:303–12. doi: 10.1111/j.1600-0684.2005.00128.x. [DOI] [PubMed] [Google Scholar]
- 30.Estes J, Baker JV, Brenchley JM, et al. Collagen deposition limits immune reconstitution in the gut. J Infect Dis. 2008;198:456–64. doi: 10.1086/590112. [DOI] [PMC free article] [PubMed] [Google Scholar]
- 31.Boulware DR, Hullsiek KH, Puronen CE, et al. Higher levels of CRP, D-dimer, IL-6, and hyaluronic acid before initiation of antiretroviral therapy (ART) are associated with increased risk of AIDS or death. J Infect Dis. 2011;203:1637–46. doi: 10.1093/infdis/jir134. [DOI] [PMC free article] [PubMed] [Google Scholar]
- 32.Parfitt AM, Simon LS, Villanueva AR, Krane SM. Procollagen type I carboxy-terminal extension peptide in serum as a marker of collagen biosynthesis in bone. Correlation with Iliac bone formation rates and comparison with total alkaline phosphatase. J Bone Miner Res. 1987;2:427–36. doi: 10.1002/jbmr.5650020510. [DOI] [PubMed] [Google Scholar]
- 33.Di Sario A, Bendia E, Macarri G, et al. The anti-fibrotic effect of pirfenidone in rat liver fibrosis is mediated by downregulation of procollagen alpha1(I), TIMP-1 and MMP-2. Dig Liver Dis. 2004;36:744–51. doi: 10.1016/j.dld.2004.05.012. [DOI] [PubMed] [Google Scholar]
- 34.Kaibori M, Yanagida H, Uchida Y, et al. Pirfenidone protects endotoxin-induced liver injury after hepatic ischemia in rats. Transplant Proc. 2004;36:1973–4. doi: 10.1016/j.transproceed.2004.08.061. [DOI] [PubMed] [Google Scholar]
- 35.Shimizu T, Kuroda T, Hata S, Fukagawa M, Margolin SB, Kurokawa K. Pirfenidone improves renal function and fibrosis in the post-obstructed kidney. Kidney Int. 1998;54:99–109. doi: 10.1046/j.1523-1755.1998.00962.x. [DOI] [PubMed] [Google Scholar]
- 36.Zhang S, Shiels IA, Ambler JS, Taylor SM. Pirfenidone reduces fibronectin synthesis by cultured human retinal pigment epithelial cells. Aust N Z J Ophthalmol. 1998;26(suppl 1):S74–6. doi: 10.1111/j.1442-9071.1998.tb01380.x. [DOI] [PubMed] [Google Scholar]
- 37.Rubino CM, Bhavnani SM, Ambrose PG, Forrest A, Loutit JS. Effect of food and antacids on the pharmacokinetics of pirfenidone in older healthy adults. Pulm Pharmacol Ther. 2009;22:279–85. doi: 10.1016/j.pupt.2009.03.003. [DOI] [PubMed] [Google Scholar]
Associated Data
This section collects any data citations, data availability statements, or supplementary materials included in this article.