

Abstract
Background:
A prior analysis of postmenopausal breast cancer patients linked a decline in mammographic density (MD) following the initiation of tamoxifen treatment with improved survival, but excluded premenopausal women, for whom tamoxifen is the primary anti-endocrine therapy. Therefore, we evaluated change in MD after tamoxifen and breast cancer death among patients age 32 to 87 years.
Methods:
This case-control study included 349 estrogen receptor (ER)–positive breast cancer patients who were treated with tamoxifen at Kaiser Permanente Northwest (1990–2008): 97 who died from breast cancer (case patients) and 252 who did not (control patients), matched on age and year at diagnosis and disease stage. Percent MD in the unaffected breast was measured at baseline (mean six months before tamoxifen initiation) and follow-up (mean 12 months after initiation). Associations between change in MD and breast cancer death were estimated using conditional logistic regression.
Results:
Patients in the highest tertile of MD decline had a lower risk of breast cancer death when compared with women in the lowest tertile (odds ratio [OR] = 0.44, 95% confidence interval [CI] = 0.22 to 0.88); results were similar after adjustment for baseline MD (OR = 0.49, 95% CI = 0.23 to 1.02). Reductions in death were observed only among patients in the middle and upper tertiles of baseline MD. Associations did not differ by age, tamoxifen use duration, estrogen and/or progestin use, body mass index, or receipt of chemotherapy or radiotherapy.
Conclusion:
These data suggest that younger and older ER-positive breast cancer patients who experience large reductions in MD following tamoxifen initiation have an improved prognosis.
Tamoxifen has demonstrated effectiveness in preventing and treating estrogen receptor (ER)–positive breast cancer. Thirty to sixty percent of women who take tamoxifen experience a measurable decline in mammographic breast density after initiating treatment (1–4), with average reductions of 4% to 14% after 12 to 18 months (1,5–11). Mammographic density reflects the fibro glandular composition of the breast, and women with the highest levels have approximately four-fold higher breast cancer risk compared with women with the lowest density (12,13). Though it has been suggested that elevated prediagnostic density is unrelated to breast cancer-specific survival after accounting for patient and tumor characteristics (14), emerging evidence indicates that density reductions specifically among tamoxifen users may predict treatment effectiveness in adjuvant (2,3,15) and chemopreventative (16) settings, which could have value for planning long-term treatment.
At least four studies have evaluated tamoxifen-related changes in mammographic density in relation to breast cancer outcomes. In the International Breast Cancer Intervention Study (IBIS)-1 chemoprevention trial, women in the tamoxifen arm who experienced a 10% or greater reduction in percent density had a 68% reduction in breast cancer risk compared with those whose density did not change (16). Subsequently, two Korean studies reported that density reductions among breast cancer patients treated with tamoxifen were associated with improved recurrence-free survival (2,3). Finally, a Swedish study of postmenopausal women age 50 to 74 years reported that density reductions among tamoxifen-treated patients were associated with lower risk of breast cancer–specific death (15).
With the introduction of aromatase inhibitors for postmenopausal patients, tamoxifen has become more central to the treatment of younger, premenopausal breast cancer patients, rather than older patients. However, the relationship between tamoxifen-related density reductions and breast cancer death among younger women is unknown. Further, it is unclear what effects the duration of tamoxifen use, nonadherence, or concurrent use of other medications have on the relationship between change in density and breast cancer-specific death. To address these questions, we conducted a case-control analysis of 349 ER-positive breast cancer patients, age 32 to 87 years, who were members of the Kaiser Permanente Northwest (KPNW; Portland, Oregon) health plan.
Methods
Population
Patients were selected from a cohort of 2315 KPNW members diagnosed with ER-positive primary invasive breast cancer between 1990 and 2008 and treated with adjuvant tamoxifen (Figure 1). For each patient, we used electronic records to identify: 1) a baseline mammogram obtained 720 or fewer days before diagnosis and before the first tamoxifen prescription, and 2) a follow-up mammogram performed 90 to 820 days after the first tamoxifen prescription and within 90 days of a current tamoxifen prescription (Figure 2). This study was approved by the Special Studies Institutional Review Board (IRB) of the National Cancer Institute and the Institutional Review Board of Kaiser Permanente Northwest, in accordance with assurances filed with and approved by the US Department of Health and Human Services. A waiver of written informed consent was granted based on the general consent KPNW members provided for use of medical information in IRB-approved linkage-based research.
Figure 1.
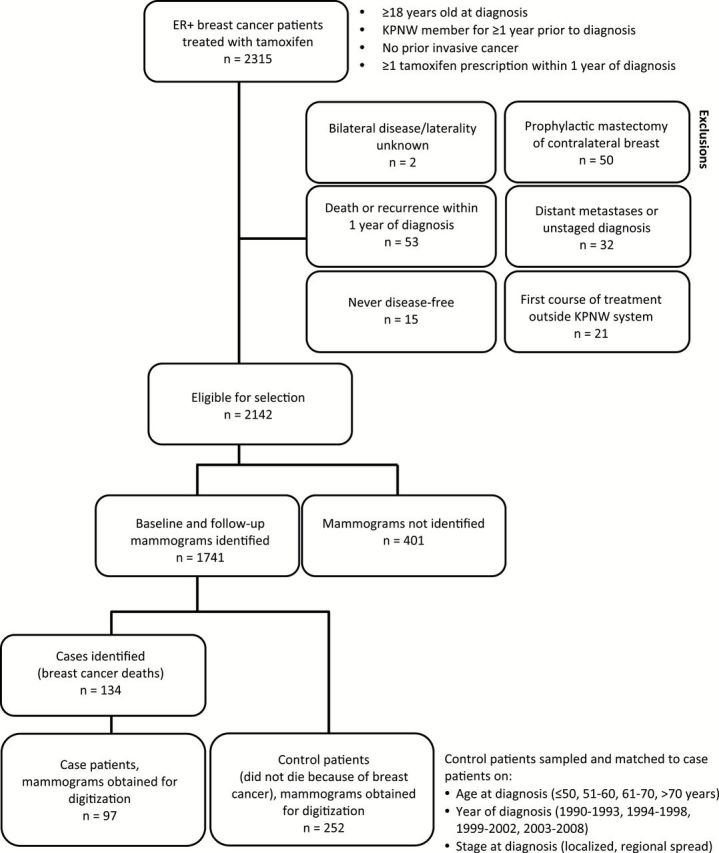
Inclusion and exclusion criteria for study participants. Case patients and a sample of matched control patients were selected from Kaiser Permanente Northwest members diagnosed with estrogen receptor–positive breast cancer and treated with tamoxifen. KPNW = Kaiser Permanente Northwest.
Figure 2.
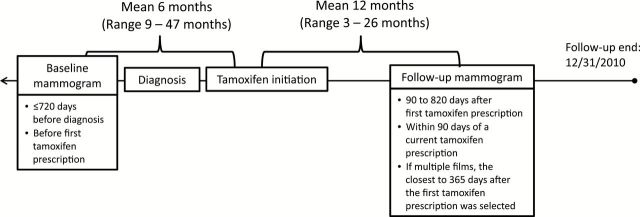
Selection of baseline and follow-up mammograms. We reviewed mammographic records from January 1, 1988 to December 31, 2010 to select mammographic films of the contralateral (unaffected) breast for analysis. Baseline mammograms were performed prior to the initiation of tamoxifen treatment and follow-up mammograms were obtained at least three months after the start of tamoxifen treatment.
Case-Control Selection
This study used a matched case-control design. Case patients were defined as patients who died of breast cancer between January 1, 1991 and December 31, 2010; vital status was determined by the KPNW tumor registry. Control patients were selected from breast cancer patients who were alive at the last tumor registry follow-up or who died from causes other than breast cancer.
Follow-up time was calculated as the time between the first tamoxifen prescription and the earliest of the following: breast cancer death, death from another cause, last tumor registry follow-up, or December 31, 2010. Two control patients were matched to each case patient (Figure 1) and sampled to have at least as much follow-up time as the matched case patient. We retrieved film mammograms for 97 case patients and 191 matched control patients. Mammograms were available for 61 additional control patients that were matched to case patients without available mammograms. To increase statistical power, we re-matched these controls to eligible cases. Thus, 349 patients (97 case patients, 252 control patients) were included in this analysis.
Mammographic Density
Craniocaudal film mammographic views of the contralateral breast were digitized using an Array Corporation 2095 Laser Film Digitizer (Roden, the Netherlands; optical density = 4.0). Absolute dense area (cm2) and total breast area (cm2) were measured using Cumulus, a computer-assisted thresholding program (17). Masked baseline and follow-up mammograms from each patient were evaluated by a single reader. Percent density was calculated as dense area ÷ total breast area x 100. Reevaluation of 50 randomly selected films yielded intraclass correlation coefficients and coefficients of variation of 0.95 and 8.5% for dense area, 0.99 and 0.5% for total breast area, and 0.96 and 8.5% for percent density.
Covariables
Prescription records from 1986 to 2010 for tamoxifen, aromatase inhibitors, raloxifene, antidepressants (selective serotonin reuptake inhibitors or serotonin-norepinephrine reuptake inhibitors), and hormone therapy (HT; estrogen or estrogen plus progestin) were obtained from KPNW databases. Duration of tamoxifen use was calculated by subtracting the first tamoxifen prescription date from the last day of coverage prior to discontinuation (no prescriptions for >1 year). Tamoxifen nonadherence was determined by counting the number of gaps in prescription coverage that lasted more than 30 days. Antidepressant use was defined based on the presence of at least one antidepressant prescription 30 days or fewer (current users) or more than 30 days (former users) before the mammogram of interest. HT use was defined based on at least one HT prescription 100 days or fewer (current users) or more than 100 days (former users) before the mammogram of interest.
Age and year at diagnosis, race/ethnicity, tumor size, tumor differentiation, disease stage, progesterone receptor (PR) expression, and history of bilateral oophorectomy before the follow-up mammogram, radiotherapy, or chemotherapy were obtained from electronic records. Self-reported smoking status, measured height, and weight measured within three months of baseline and follow-up mammograms were obtained from electronic and paper records. Body mass index (BMI) was calculated as kg/m2. Variable distributions are shown in Table 1.
Table 1.
Odds ratios (OR) for associations of patient characteristics with breast cancer-specific death among 349 ER-positive breast cancer patients treated with tamoxifen in the Kaiser Permanente Northwest Health Plan (Portland, Oregon)
| Variable | Case patients (n = 97) | Control patients (n = 252) | Univariate OR (95% CI)† | P‡ | Multivariable OR (95% CI) †,§ | P‡ |
|---|---|---|---|---|---|---|
| No. (%)* | No. (%)* | |||||
| Age at diagnosis, y | ||||||
| ≤50 | 29 (29.9) | 73 (29.0) | —|| | |||
| 51–60 | 22 (22.7) | 66 (26.2) | — | |||
| 61–70 | 28 (28.9) | 77 (30.6) | — | |||
| >70 | 18 (18.6) | 36 (14.3) | — | |||
| SEER summary stage at diagnosis | ||||||
| Localized | 41 (42.3) | 112 (44.4) | —|| | |||
| Regional spread | 56 (57.7) | 140 (55.6) | — | |||
| Year of diagnosis | ||||||
| 1990–1993 | 14 (14.4) | 42 (16.7) | —|| | |||
| 1994–1998 | 38 (39.2) | 93 (36.9) | — | |||
| 1999–2002 | 31 (32.0) | 84 (33.3) | — | |||
| 2003–2008 | 14 (14.4) | 33 (13.1) | — | |||
| Progesterone receptor | ||||||
| Negative | 27 (27.8) | 42 (16.8) | Ref. | .03 | ||
| Positive | 70 (72.2) | 208 (83.2) | 0.54 (0.31 to 0.93) | |||
| Missing | 0 | 2 | ||||
| Tumor size, mm | ||||||
| ≤11 | 16 (17.4) | 67 (26.9) | Ref. | .02 | ||
| >11 to 16.5 | 10 (10.9) | 58 (23.3) | 0.77 (0.33 to 1.84) | |||
| >16.5 to 25 | 31 (33.7) | 68 (27.3) | 2.03 (1.00 to 4.14) | |||
| >25 | 35 (38.0) | 56 (22.5) | 2.29 (1.10 to 4.77) | |||
| Missing | 5 | 3 | ||||
| Tumor differentiation | ||||||
| Poor | 34 (37.8) | 52 (21.7) | Ref. | .002 | Ref. | .001 |
| Moderate | 55 (61.1) | 121 (50.4) | 0.77 (0.43 to 1.37) | 0.65 (0.32 to 1.29) | ||
| Well | 1 (1.1) | 67 (27.9) | 0.03 (<0.01 to 0.19) | 0.01 (<0.01 to 0.14) | ||
| Missing | 7 | 12 | ||||
| Chemotherapy | ||||||
| No | 41 (42.3) | 121 (48.2) | Ref. | .27 | ||
| Yes | 56 (57.7) | 130 (51.8) | 1.44 (0.75 to 2.76) | |||
| Missing | 0 | 1 | ||||
| Radiotherapy | ||||||
| No | 37 (38.1) | 88 (34.9) | Ref. | .80 | ||
| Yes | 60 (61.9) | 164 (65.1) | 0.94 (0.56 to 1.56) | |||
| Duration of tamoxifen use, mo | ||||||
| ≤52¶ | 64 (66.0) | 81 (32.1) | Ref. | <.001 | Ref. | <.001 |
| 53 to 61 | 17 (17.5) | 88 (34.9) | 0.18 (0.09 to 0.37) | 0.11 (0.04 to 0.28) | ||
| >61 | 16 (16.5) | 83 (32.9) | 0.15 (0.07 to 0.32) | 0.09 (0.03 to 0.24) | ||
| Per 12 months | 0.59 (0.49 to 0.72) | <.001 | 0.56 (0.44 to 0.71) | <.001 | ||
| Bilateral oophorectomy before follow-up mammogram | ||||||
| No | 96 (99.0) | 248 (98.4) | Ref. | |||
| Yes | 1 (1.0) | 4 (1.6) | —# | |||
| Hormone therapy use at baseline | ||||||
| Nonuser | 47 (48.5) | 104 (41.3) | Ref. | .26 | ||
| Former user | 17 (17.5) | 37 (14.7) | 0.95 (0.45 to 2.00) | |||
| Current user | 33 (34.0) | 111 (44.1) | 0.63 (0.35 to 1.13) | |||
| Antidepressant use at baseline | ||||||
| Nonuser | 88 (90.7) | 207 (82.1) | Ref. | .11 | ||
| Former user | 5 (5.2) | 16 (6.4) | 0.76 (0.26 to 2.23) | |||
| Current user | 4 (4.1) | 29 (11.5) | 0.32 (0.11 to 0.95) | |||
| Smoking status at baseline | ||||||
| Never | 44 (45.4) | 155 (61.8) | Ref. | .004 | Ref. | .01 |
| Ever | 53 (54.6) | 96 (38.3) | 2.07 (1.26 to 3.40) | 2.37 (1.23 to 4.56) | ||
| Missing | 0 | 1 | ||||
| Race | ||||||
| White | 96 (99.0) | 244 (97.2) | Ref. | |||
| Nonwhite | 1 (1.0) | 7 (2.8) | —# | |||
| Missing | 0 | 1 | ||||
| BMI at baseline, kg/m2** | ||||||
| <25 | 22 (26.2) | 76 (33.6) | Ref. | .40 | ||
| 25–29 | 29 (34.5) | 76 (33.6) | 1.37 (0.71 to 2.62) | |||
| 30–34 | 17 (20.2) | 44 (19.5) | 1.63 (0.80 to 3.31) | |||
| ≥35 | 16 (19.1) | 30 (13.3) | 1.86 (0.84 to 4.12) | |||
| Missing | 13 | 26 | ||||
| Per 5kg/m2 increase | 1.12 (0.92 to 1.35) | .25 | ||||
| Change in BMI (follow-up minus baseline), kg/m2** | ||||||
| <-2.5 | 6 (8.3) | 13 (6.7) | 1.10 (0.36 to 3.31) | .90 | ||
| <-1 to -2.5 | 11 (15.3) | 25 (13.0) | 1.08 (0.51 to 2.30) | |||
| -1 to 1 | 39 (54.2) | 104 (53.9) | Ref. | |||
| >1 to 2.5 | 10 (13.9) | 40 (20.7) | 0.86 (0.37 to 1.96) | |||
| >2.5 | 6 (8.3) | 11 (5.7) | 1.55 (0.55 to 4.39) | |||
| Missing | 25 | 59 | ||||
| Per 1kg/m2 change | 1.00 (0.90 to 1.12) | .95 | ||||
| Baseline percent density | ||||||
| Q1¶: ≤15 | 29 (29.9) | 51 (20.2) | Ref. | .35 | ||
| Q2: >15 to 23 | 19 (19.6) | 50 (19.8) | 0.77 (0.38 to 1.56) | |||
| Q3: >23 to 31 | 16 (16.5) | 51 (20.2) | 0.53 (0.25 to 1.11) | |||
| Q4: >31 to 43 | 19 (19.6) | 47 (18.7) | 0.66 (0.33 to 1.33) | |||
| Q5: >43 | 14 (14.4) | 53 (21.0) | 0.49 (0.22 to 1.07) | |||
| Per 10% increase | 0.87 (0.75 to 1.01) | .07 | ||||
| Baseline dense area, cm2 | ||||||
| Q1¶: ≤21 | 29 (29.9) | 50 (19.8) | Ref. | .24 | ||
| Q2: >21 to 30 | 17 (17.5) | 51 (20.2) | 0.49 (0.24 to 1.04) | |||
| Q3: >30 to 42 | 18 (18.6) | 50 (19.8) | 0.60 (0.30 to 1.20) | |||
| Q4: >42 to 57 | 19 (19.6) | 51 (20.2) | 0.55 (0.27 to 1.16) | |||
| Q5: >57 | 14 (14.4) | 50 (19.8) | 0.45 (0.20 to 1.00) | |||
| Per 10cm2 increase | 0.93 (0.83 to 1.03) | .17 | ||||
| Months from baseline mammogram to follow-up mammogram | ||||||
| ≤12 | 40 (41.2) | 115 (45.6) | Ref. | .91 | ||
| >12 to 18 | 13 (13.4) | 34 (13.5) | 1.06 (0.51 to 2.17) | |||
| >18 to 24 | 21 (21.7) | 45 (17.9) | 1.27 (0.66 to 2.44) | |||
| >24 | 23 (23.7) | 58 (23.0) | 1.10 (0.58 to 2.08) | |||
| Months from tamoxifen initiation to follow-up mammogram | ||||||
| ≤6 | 11 (11.3) | 19 (7.5) | 1.75 (0.68 to 4.49) | .41 | ||
| 7 to 9 | 27 (27.8) | 62 (24.6) | 1.45 (0.74 to 2.81) | |||
| 10 to 12 | 26 (26.8) | 88 (34.9) | Ref. | |||
| 13 to 15 | 7 (7.2) | 25 (9.9) | 0.88 (0.33 to 2.30) | |||
| 16 to 18 | 18 (18.6) | 49 (19.4) | 1.20 (0.56 to 2.55) | |||
| ≥19 | 8 (8.3) | 9 (3.6) | 2.70 (0.93 to 7.85) | |||
* Column percentages. BMI = body mass index; CI = confidence interval; ER = estrogen receptor; OR = odds ratio.
† Odds ratio and 95% confidence interval, estimated using conditional logistic regression.
‡ Two-sided P heterogeneity, based on the Wald test.
§ Adjusted for variables retained in this column. All other variables were considered for inclusion using stepwise regression, but were not retained in the model because of lack of statistical significance.
|| Not estimated for matching factors.
¶ Percentiles based on the distribution among control patients.
# Not estimated because of small numbers.
** Odds ratio and confidence interval estimated with multiply imputed data.
Statistical Analysis
Absolute change in percent density was calculated as percent density at follow-up minus percent density at baseline. Relative change in percent density was calculated as absolute change in percent density divided by baseline percent density. Absolute and relative changes in dense area were calculated similarly. Correlation between absolute change in percent density and absolute change in dense area was evaluated using the Spearman rank correlation coefficient.
Percentiles of all variables were defined based on the distribution among control patients. Associations between patient characteristics and quintiles of absolute change in percent density were estimated using chi-square or Fisher’s exact tests, stratified by case status. Multivariable-adjusted associations between baseline patient characteristics and change in density were examined using linear regression; change in density was scaled and raised to the 1.75th power to approximate normality. Odds ratios (ORs) and 95% confidence intervals (CIs) for the association between tertiles of change in density and breast cancer death were estimated using conditional logistic regression, and Wald P heterogeneity values are presented. We also assessed absolute change in percent density using the 10% or greater cutpoint to assess a comparable level of change as reported in the IBIS-1 study (16). Missing weight or height values used to calculate BMI were multiply-imputed using IVEWare (18). For all other variables, women with missing values were excluded from the respective models.
Multivariable models were constructed to assess confounding. Smoking status, tumor size, antidepressant use, and baseline percent density were identified as potential confounders based on literature review and covariable associations with breast cancer death and change in percent density among control patients and included in a preliminary model. Only baseline density was retained in final models after removing variables sequentially and retaining those where removal altered the change in density regression parameter by more than 10%. Tumor size and baseline dense area were assessed similarly in multivariable models for absolute change in dense area, and both were retained.
We explored multiplicative interactions between absolute change in percent density and baseline percent density (tertiles), age at diagnosis (≤50, >50 years), radiation therapy (yes, no), chemotherapy (yes, no), baseline HT use (current, no current use), baseline BMI (<30, ≥30kg/m2), and duration of tamoxifen use (≤52, 53–61, >61 months) using the likelihood ratio test. To retain statistical power, stratified associations were estimated using unconditional logistic regression adjusted for matching factors and case follow-up time; estimates from conditional and unconditional models were similar.
In sensitivity analyses, we evaluated whether early tamoxifen nonadherence (gaps of 31–60, 61–90, or >90 days between tamoxifen initiation and follow-up mammogram) was associated with absolute change in percent density using the Kruskal Wallis test and evaluated the effect of adjusting for early nonadherence. We further investigated the effects of patterns of early tamoxifen use by excluding women with fewer than 6, fewer than 9, or fewer than 12 months between tamoxifen initiation and the follow-up mammogram or fewer than 6, fewer than 9, or fewer than 12 months of uninterrupted (no gaps between prescriptions >1 day) tamoxifen use before the follow-up mammogram. We also explored adjustment for the total duration of tamoxifen use and use of specific antidepressants shown to inhibit tamoxifen metabolism (paroxetine and fluoxetine) (19). In a final sensitivity analysis, we excluded patients with PR-negative (n = 69) or well-differentiated tumors (n = 68) and patients treated with aromatase inhibitors (n = 6) or bilateral oophorectomy (n = 5) between baseline and follow-up mammograms.
Analyses were performed using SAS V9.2 (SAS, Cary, NC); imputed data were analyzed using PROC MIANALYZE. Statistical tests were two-sided and P values less than .05 were considered statistically significant.
Results
Patient Characteristics Associated with Breast Cancer Death
Characteristics of the 97 case patients and 252 control patients are shown in Table 1. The mean age at diagnosis was 59 years. Patients had an average of 18 months between baseline and follow-up mammograms and 12 months between tamoxifen initiation and follow-up mammogram; distributions for both were similar between case patients and control patients (Table 1). In multivariable analyses, well-differentiated tumors, longer tamoxifen duration, and never smoking were statistically significantly associated with improved prognosis (all P ≤ .01).
Baseline Characteristics Associated With Change in Density
Absolute change in percent density ranged from a 41.7% reduction to a 17.2% increase, with smaller changes among case patients (mean 3.1% reduction) than control patients (mean 5.2% reduction) (Supplementary Table 1, available online). In unadjusted analyses, high baseline percent density was associated with a greater reduction in percent density among case patients (P = .03) and control patients (P < .001); younger age at diagnosis and lower BMI were associated with a greater density reduction among control patients only (age: P = .01; BMI: P = .03) (Table 2). Only baseline percent density (case patients P = .002, control patients P < .001) and age at diagnosis (control patients P = .03) remained associated with density change in multivariable models. Other baseline characteristics were not associated with change in density.
Table 2.
Characteristics associated with change in mammographic percent density among 349 ER-positive breast cancer patients treated with tamoxifen, stratified by case status
| Variable | Absolute change in percent density (quintiles)* | P† | P‡ | ||||
|---|---|---|---|---|---|---|---|
| Q1: ≤-12% | Q2: >-12% to -6% | Q3: >-6% to -2% | Q4: >-2% to 2% | Q5: >2% | |||
| No. (%§) | No. (%) | No. (%) | No. (%) | No. (%) | |||
| Case patients | |||||||
| Age at diagnosis, y | |||||||
| ≤50 | 5 (17.2) | 6 (20.7) | 7 (24.1) | 7 (24.1) | 4 (13.8) | .23 | .19 |
| 51–60 | 2 (9.1) | 6 (27.3) | 5 (22.7) | 6 (27.3) | 3 (13.6) | ||
| 61–70 | 1 (3.6) | 1 (3.6) | 9 (32.1) | 6 (21.4) | 11 (39.3) | ||
| >70 | 3 (16.7) | 2 (11.1) | 3 (16.7) | 6 (33.3) | 4 (22.2) | ||
| BMI at baseline, kg/m2|| | |||||||
| < 25 | (18.6) | (20.2) | (17.1) | (17.1) | (27.1) | .77 | .45 |
| 25 to <30 | (6.8) | (15.3) | (29.5) | (30.1) | (18.4) | ||
| 30 to <35 | (14.2) | (15.1) | (14.2) | (32.1) | (24.5) | ||
| ≥35 | (5.8) | (9.2) | (40.2) | (23.0) | (21.8) | ||
| Baseline percent density | |||||||
| Q1: ≤15 | 0 (0.0) | 1 (3.5) | 8 (27.6) | 11 (37.9) | 9 (31.0) | .03 | .002 |
| Q2: >15 to 23 | 0 (0.0) | 3 (15.8) | 6 (31.6) | 6 (31.6) | 4 (21.1) | ||
| Q3: >23 to 31 | 2 (12.5) | 5 (31.3) | 3 (18.8) | 4 (25.0) | 2 (12.5) | ||
| Q4: >31 to 43 | 6 (31.6) | 3 (15.8) | 4 (21.1) | 3 (15.8) | 3 (15.8) | ||
| Q5: >43 | 3 (21.4) | 3 (21.4) | 3 (21.4) | 1 (7.1) | 4 (28.6) | ||
| Control patients | |||||||
| Age at diagnosis, y | |||||||
| ≤50 | 20 (27.4) | 23 (31.5) | 8 (11.0) | 12 (16.4) | 10 (13.7) | .01 | 03 |
| 51–60 | 13 (19.7) | 13 (19.7) | 20 (30.3) | 8 (12.1) | 12 (18.2) | ||
| 61–70 | 11 (14.3) | 12 (15.6) | 17 (22.1) | 14 (18.2) | 23 (29.9) | ||
| >70 | 4 (11.1) | 7 (19.4) | 5 (13.9) | 10 (27.8) | 10 (27.8) | ||
| BMI at baseline, kg/m2|| | |||||||
| <25 | (28.1) | (22.0) | (12.8) | (9.7) | (27.4) | .03 | .49 |
| 25 to <30 | (18.9) | (20.8) | (23.7) | (17.0) | (19.6) | ||
| 30 to <35 | (9.8) | (19.7) | (17.5) | (29.5) | (23.5) | ||
| ≥35 | (9.6) | (26.6) | (31.1) | (21.5) | (11.3) | ||
| Baseline percent density | |||||||
| Q1: ≤15 | 0 (0.0) | 4 (7.8) | 10 (19.6) | 21 (41.2) | 16 (31.4) | <.001 | <.001 |
| Q2: >15 to 23 | 4 (8.0) | 15 (30.0) | 13 (26.0) | 6 (12.0) | 12 (24.0) | ||
| Q3: >23 to 31 | 5 (9.8) | 12 (23.5) | 13 (25.5) | 10 (19.6) | 11 (21.6) | ||
| Q4: >31 to 43 | 13 (27.7) | 11 (23.4) | 9 (19.2) | 5 (10.6) | 9 (19.2) | ||
| Q5: >43 | 26 (49.1) | 13 (24.5) | 5 (9.4) | 2 (3.8) | 7 (13.2) | ||
* Quintile cutpoints were determined based on the distribution of change in density among control patients. Negative percentages represent a reduction in density; positive percentages represent an increase in density. BMI = body mass index.
† Two-sided Chi-square or Fisher’s exact test.
‡ Linear regression model two-sided P heterogeneity, adjusting for other variables shown in this table.
§ Row percentages.
|| Percentages and statistical tests estimated using imputed data.
Change in Density and Breast Cancer Death
Patients in the highest tertile of absolute change in percent density had a lower risk of breast cancer death when compared with patients in the lowest tertile (greater than 8.7% reduction vs less than 0.5% reduction or increased density = OR 0.44, 95% CI = 0.22 to 0.88) (Table 3). The association was similar after adjustment for baseline density (OR = 0.49, 95% CI = 0.23 to 1.02). Adjustment for duration of tamoxifen use did not alter the findings substantially (Table 3). Patients in the middle tertile of density change did not have a lower risk of breast cancer death compared with patients in the lowest tertile (8.7% to 0.5% reduction vs <0.5% reduction or increased density: OR = 1.36, 95% CI = 0.79 to 2.34). In analyses stratified by baseline percent density, the association between density reduction and reduced risk of death was limited to women in the highest two tertiles of baseline percent density (Table 3), although a test of interaction between baseline density and change in percent density did not reach statistical significance (P interaction = .11). There was no evidence of statistical interaction with other covariables examined (all P interaction > .05), including age at diagnosis (Figure 3), duration of tamoxifen use (Supplementary Figure 1, available online), HT use, BMI, or receipt of chemotherapy or radiotherapy (data not shown). The a priori threshold of 10% or greater absolute density reduction was associated with a reduction in risk of breast cancer death when compared with less than 10% reduction (OR = 0.42, 95% CI = 0.22 to 0.80; Supplementary Table 2, available online).
Table 3.
Association between absolute change in mammographic percent density and breast cancer-specific death among ER-positive patients treated with tamoxifen, overall and stratified by baseline percent density
| Change in percent density | Case patients (N) / Control patients (N) | OR (95% CI)* | P† | OR (95% CI)*‡ | P†‡ | OR (95% CI)*§ | P†§ |
|---|---|---|---|---|---|---|---|
| Overall | |||||||
| T1||: >-0.5 | 36 / 86 | Ref. | .005 | Ref. | .01 | Ref. | .04 |
| T2: -8.7 to -0.5 | 45 / 82 | 1.36 (0.79 to 2.34) | 1.38 (0.80 to 2.40) | 1.27 (0.71 to 2.25) | |||
| T3: <-8.7 | 16 / 84 | 0.44 (0.22 to 0.88) | 0.49 (0.23 to 1.02) | 0.47 (0.21 to 1.03) | |||
| Stratified by baseline percent density | |||||||
| Baseline density <20% | |||||||
| T1: >-0.5 | 16 / 46 | Ref. | —¶ | Ref. | —¶ | Ref. | —¶ |
| T2: -8.7 to -0.5 | 22 / 29 | 2.23 (0.99 to 5.03) | 2.82 (1.17 to 6.76) | 2.22 (0.88 to 5.62) | |||
| T3: <-8.7 | 0 / 11 | —¶ | —¶ | —¶ | |||
| Baseline density 20% to <37% | |||||||
| T1: >-0.5 | 15 / 23 | Ref. | .16 | Ref. | .16 | Ref. | .23 |
| T2: -8.7 to -0.5 | 15 / 32 | 0.69 (0.28 to 1.71) | 0.70 (0.28 to 1.72) | 0.78 (0.31 to 1.96) | |||
| T3: <-8.7 | 7 / 29 | 0.35 (0.12 to 1.02) | 0.35 (0.12 to 1.02) | 0.38 (0.13 to 1.15) | |||
| Baseline density ≥37% | |||||||
| T1: >-0.5 | 5 / 17 | Ref. | .38 | Ref. | .38 | Ref. | .43 |
| T2: -8.7 to -0.5 | 8 / 21 | 1.32 (0.35 to 4.94) | 1.34 (0.36 to 5.02) | 1.31 (0.30 to 5.68) | |||
| T3: <-8.7 | 9 / 44 | 0.60 (0.17 to 2.12) | 0.59 (0.17 to 2.11) | 0.57 (0.14 to 2.38) | |||
* Odds ratio and 95% confidence interval. Overall associations estimated using conditional logistic regression; stratified associations were estimated using unconditional logistic regression adjusted for age at diagnosis, stage at diagnosis, year of diagnosis, and case follow-up time. CI = confidence interval; ER = estrogen receptor; OR = odds ratio.
† Two-sided P heterogeneity, based on the Wald test.
‡ Multivariable model, adjusted for baseline percent density.
§ Multivariable model, adjusted for baseline percent density and duration of tamoxifen use.
|| Tertiles, based on the distribution of change in percent density among control patients. Positive values indicate an increase in percent density and negative values indicate a reduction in percent density.
¶ Not estimated.
Figure 3.

The association between absolute change in mammographic percent density and breast cancer–specific death, stratified by age at diagnosis. Odds ratios (solid squares) and 95% confidence intervals (error bars) for the association between tertiles of change in percent density and breast cancer death, adjusted for baseline percent density, were similar for patients age 50 years and younger (29 case patients, 73 control patients) and older than age 50 years (68 case patients, 179 control patients) at diagnosis. There was no evidence of multiplicative interaction between age at diagnosis and change in percent density, which was tested by including a cross-product term between the two variables in a logistic regression model (two-sided P interaction = .96).
Absolute change in percent density was highly correlated with absolute change in dense area (Spearman rank correlation = 0.84, P < .001); however, associations between absolute change in dense area and risk of death were closer to the null (Supplementary Table 3, available online). Relative change in percent density and relative change in dense area also failed to show strong associations with breast cancer death (Supplementary Table 3, available online).
Sensitivity Analyses
Tamoxifen nonadherence prior to the follow-up mammogram was not associated with the magnitude of percent density change (Figure 4), and adjustment for nonadherence did not affect the association between change in percent density and risk of death (data not shown). Associations were also similar after excluding women with shorter durations of tamoxifen use or shorter durations of uninterrupted use prior to the follow-up mammogram (Supplementary Figure 2, available online), adjusting for paroxetine or fluoxetine use, excluding women who had well-differentiated or PR-negative tumors or excluding women treated with aromatase inhibitors or bilateral oophorectomy between baseline and follow-up mammograms (data not shown).
Figure 4.
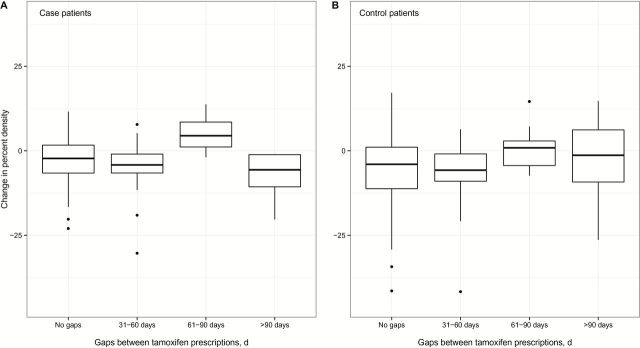
The magnitude of absolute change in percent density among case patients (A) and control patients (B) who had gaps between tamoxifen prescriptions of 31 to 60, 61 to 90, or more than 90 days in between baseline and follow-up mammograms is shown in comparison with patients who did not have any gaps of at least 30 days during the same time period. Thick horizontal bars represent the median value in each group. Upper whiskers extend from the 75th percentile to the highest value within 1.5 times the interquartile range, and lower whiskers extend from the 25th percentile to the lowest value within 1.5 times the interquartile range. A minority of patients were nonadherent prior to the follow-up mammogram: 15.5% of case patients and 13.1% of control patients had a gap of 31 to 60 days, 4.1% of case patients and 3.6% of control patients had a gap of 61 to 90 days, and 5.2% of case patients and 4.0% of control patients had a gap of more than 90 days. Levels of absolute change in percent density did not differ statistically significantly by nonadherence among case patients (A, Kruskal Wallis test, two-sided P = .06) or control patients (B, Kruskal Wallis test, two-sided P = .18).
Discussion
In this study, ER-positive breast cancer patients who experienced greater than an 8.7% absolute reduction in mammographic percent density after approximately one year of tamoxifen treatment had a 56% lower risk of breast cancer death. Alternative measures of mammographic density (i.e., absolute change in dense area and relative changes in percent density and dense area) yielded weaker, statistically nonsignificant associations. Accounting for other factors, including early tamoxifen nonadherence, tamoxifen use duration, other adjuvant treatments, and antidepressant use, did not alter the results. Furthermore, results were similar among younger (≤50 years) and older (>50 years) women. Women younger than age 50 years were not included in the only prior study examining tamoxifen-related change in density and breast cancer death (15). Our confirmation that the prognostic value of tamoxifen-related density reduction is similar among younger and older women reinforces the clinical relevance of these findings, as tamoxifen is the primary anti-endocrine treatment available to the former group, whereas use has diminished among the latter.
Our results regarding absolute change in percent density are similar to results from prior analyses of tamoxifen-associated density change, despite differences in approach (Table 4). Tamoxifen-related declines have been associated with breast cancer risk (16), recurrence (2,3), and death (15), and associations appear to be robust to the density measurement method. We and others (2) used computer-assisted thresholding; visual assessment of percent density (16), BI-RADS density categories (3), and fully-automated computerized thresholding have also been used (15). Even with these differences, all studies have reported that mammographic density reduction is associated with an improved outcome, suggesting that reductions in mammographic density may provide an early predictor of tamoxifen effectiveness. Identification of such early predictors could enable likely nonresponders to consider alternative therapies, while providing encouragement to likely responders to continue treatment.
Table 4.
Change in mammographic density among women treated with tamoxifen and breast cancer outcomes: current evidence
| Study (location) and publication year | Design | Age range, y | Outcome | No. events/cases among tamoxifen users | Mammogram type | Density measurement method | Main density measure reported | Main association with outcome among tamoxifen users |
|---|---|---|---|---|---|---|---|---|
| IBIS-1 (UK/Finland) 2011 (16) | Nested case-control * | 30–70 | Incident breast cancer | 51 | Film, mediolateral oblique view | Visual assessment | Absolute change in percent density | ≥10% reduction vs no change (Referent) OR = 0.32 (95% CI = 0.14 to 0.72) |
| Seoul National University (Korea) 2012 (2) | Hospital-based patient cohort | 24–77 | Loco-regional or distant recurrence | Not reported | Digital, craniocaudal view | Computer-assisted thresholding (Cumulus) | Absolute change in percent density | <5% reduction vs ≥5% reduction (Referent) HR = 1.52 (95% CI = 0.92 to 2.51) |
| Korea National Cancer Center (Korea) 2013 (3) | Hospital-based patient cohort | 25–78 | Loco-regional, contralateral or distant recurrence | 67 | Digital, view not specified | Visual assessment | Change in BI-RADS category | reduction in BI-RADS category (continuous) HR = 0.35 (95% CI = 0.17 to 0.68) |
| Karolinska Institute (Sweden) 2013 (15) |
Patient cohort † | 50–74 | Breast cancer– specific death | 75 | Film, mediolateral oblique view | Fully-automated thresholding | Relative change in dense area | >20% reduction vs ≥10% increase (Referent) HR = 0.50 (95% CI = 0.27 to 0.93) |
| Kaiser Permanente Northwest (USA; current study) | Case-control | 32–87 | Breast cancer–s pecific death | 97 | Film, craniocaudal view | Computer-assisted thresholding (Cumulus) | Absolute change in percent density | >8.7% reduction vs <-0.5% reduction (Referent) OR = 0.44 (95% CI = 0.22 to 0.88) |
* Sampled from a randomized clinical trial. BI-RADS = Breast Imaging Reporting and Data System; CI = confidence interval; HR = hazard ratio; OR = odds ratio.
† Sampled from a case-control study.
The relationship between density reduction and reduced risk of death was most evident among women with baseline density of at least 20%. A similar pattern was reported in the IBIS-1 trial—tamoxifen treatment reduced breast cancer risk only among women with baseline density of greater than 10%, but the relationship between density reduction and risk among women with different baseline densities was not reported (16). Li et al. (15) reported that density reduction was associated with improved survival in analyses that excluded patients in the lowest quintile of baseline dense breast area. In our analysis, higher baseline density was a strong predictor of greater density reduction and we used several approaches to account for its effect on the relationship between density change and death, including adjustment, stratification, and examination of change relative to baseline. Although stratified analyses had limited statistical power, our findings suggest that the relationship between density reduction and breast cancer death cannot be explained entirely by baseline density.
Tamoxifen is presumed to inhibit the development of metastases by blocking estrogen signaling through ER, but the explanation for why a density reduction among tamoxifen users is associated with improved prognosis is unknown. Previous research has shown that mammographic density is responsive to changes in hormones (13,20–22); thus, it is plausible that density may also respond to tamoxifen’s anti-estrogenic effects. In addition to inhibiting estrogen signaling, tamoxifen has been shown to alter proteins related to TGF-β (23) and IGF (24) signaling, which may contribute to density reduction. Further analyses of the relationship between mammographic density and hormonal and proliferative pathways are needed to understand the relationship between tamoxifen, density change, and survival.
A major strength of this analysis is that it was conducted within a prepaid health plan that provided all aspects of care, including cancer screening, treatment, and prescription drugs. We used prescription records to show that neither tamoxifen nonadherence nor antidepressant use affected the relationship between density change and breast cancer death. We also evaluated prospectively recorded weight and found that neither baseline BMI nor change in BMI altered the associations. All patients underwent film mammography, thus the data were unaffected by potential differences in digital vs film image acquisition methods. Results consistent with ours have been found in prior studies that used digital mammograms (2,3). Finally, careful matching of case patients and control patients allowed us to control for strong prognostic factors that may have confounded the relationship between density change and breast cancer death. Importantly, matching on diagnosis year controlled for unmeasured temporal effects related to screening and diagnosis.
Despite these advantages, our study had limitations. Although aromatase inhibitor use did not affect our results, we could not evaluate this issue fully because most patients were diagnosed before the introduction of aromatase inhibitors into clinical practice. We lacked information on menopausal status, although we used age 50 years as a proxy and found that associations stratified by age were similar to the overall association. We also lacked data on polymorphisms in CYP2D6, the gene encoding the enzyme proposed to metabolize tamoxifen. Li et al. (25) reported that patients with intermediate and poor CYP2D6 metabolism status were less likely to experience a greater than 10% reduction in mammographic density, but the question of whether CYP2D6 status predicts tamoxifen response is unanswered (26–28). It is unclear how CYP2D6 status may have affected our results. Finally, this analysis was restricted to patients with localized or regional stage breast cancer and our results may not apply to patients with in-situ disease or distant metastases at diagnosis.
In summary, our analysis demonstrates that mammographic density reductions among ER-positive breast cancer patients treated with tamoxifen are associated with a reduced risk of breast cancer death. Our results, in conjunction with the literature, suggest that density reduction may be an early indicator of tamoxifen effectiveness and could have value in deciding whether to continue tamoxifen therapy or change management. Confirmation of our findings in studies with large numbers of ER-positive premenopausal breast cancer patients and data related to pharmacogenetics and clinical characteristics could support monitoring of mammographic density as an approach for assessing tamoxifen effectiveness.
Funding
This work was supported by the Intramural Research Program of the National Cancer Institute at the National Institutes of Health.
Supplementary Material
We thank Brenda Rush and Kathy Pearson of Kaiser Permanente Northwest (Portland, OR) for their invaluable assistance in the data collection process. We also thank Dave S. Campbell of Information Management Services, Inc. (Rockville, MD) for his data management assistance. The content is solely the responsibility of the authors and does not necessarily represent the official views of the National Cancer Institute or the National Institutes of Health. The study funders had no role in the design of the study, the collection, analysis, or interpretation of the data, the writing of the manuscript, nor the decision to submit the manuscript for publication.
References
- 1. Cuzick J, Warwick J, Pinney E, Warren RML, Duffy SW. Tamoxifen and Breast density in women at increased risk of breast cancer. J Natl Cancer Inst. 2004;96(8):621–628. [DOI] [PubMed] [Google Scholar]
- 2. Kim J, Han W, Moon HG, et al. Breast density change as a predictive surrogate for response to adjuvant endocrine therapy in hormone receptor positive breast cancer. Breast Cancer Res. 2012;14(4):R102. [DOI] [PMC free article] [PubMed] [Google Scholar]
- 3. Ko KL, Shin IS, You JY, Jung SY, Ro J, Lee ES. Adjuvant tamoxifen-induced mammographic breast density reduction as a predictor for recurrence in estrogen receptor-positive premenopausal breast cancer patients. Breast Cancer Res Treat. 2013;142(3):559–567. [DOI] [PubMed] [Google Scholar]
- 4. Son HJ, Oh KK. Significance of follow-up mammography in estimating the effect of tamoxifen in breast cancer patients who have undergone surgery. AJR Am J Roentgenol. 1999;173(4):905–909. [DOI] [PubMed] [Google Scholar]
- 5. Ursin G, Pike MC, Spicer DV, Porrath SA, Reitherman RW. Can mammographic densities predict effects of tamoxifen on the breast? J Natl Cancer Inst. 1996;88(2):128–129. [DOI] [PubMed] [Google Scholar]
- 6. Meggiorini ML, Labi L, Vestri AR, Porfiri LM, Savelli S, De Felice C. Tamoxifen in women with breast cancer and mammographic density. Eur J Gynaecol Oncol. 2008;29(6):598–601. [PubMed] [Google Scholar]
- 7. Brisson J, Brisson B, Cote G, Maunsell E, Berube S, Robert J. Tamoxifen and mammographic breast densities. Cancer Epidemiol Biomarkers Prev. 2000;9(9):911–915. [PubMed] [Google Scholar]
- 8. Chow CK, Venzon D, Jones EC, Premkumar A, O’Shaughnessy J, Zujewski J. Effect of tamoxifen on mammographic density. Cancer Epidemiol Biomarkers Prev. 2000;9(9):917–921. [PubMed] [Google Scholar]
- 9. Atkinson C, Warren R, Bingham SA, Day NE. Mammographic patterns as a predictive biomarker of breast cancer risk: effect of tamoxifen. Cancer Epidemiol Biomarkers Prev. 1999;8(10):863–866. [PubMed] [Google Scholar]
- 10. Konez O, Goyal M, Reaven RE. Can tamoxifen cause a significant mammographic density change in breast parenchyma? Clin Imaging. 2001;25(5):303–308. [DOI] [PubMed] [Google Scholar]
- 11. Decensi A, Robertson C, Guerrieri-Gonzaga A, et al. Randomized Double-blind 2 x 2 trial of low-dose tamoxifen and fenretinide for breast cancer prevention in high-risk premenopausal women. J Clin Oncol. 2009;27(23):3749–3756. [DOI] [PMC free article] [PubMed] [Google Scholar]
- 12. McCormack VA, dos Santos Silva I. Breast density and parenchymal patterns as markers of breast cancer risk: a meta-analysis. Cancer Epidemiol Biomarkers Prev. 2006;15(6):1159–1169. [DOI] [PubMed] [Google Scholar]
- 13. Huo CW, Chew GL, Britt KL, et al. Mammographic density-a review on the current understanding of its association with breast cancer. Breast Cancer Res Treat. 2014;144(3):479–502. [DOI] [PubMed] [Google Scholar]
- 14. Gierach GL, Ichikawa L, Kerlikowske K, et al. Relationship between mammographic density and breast cancer death in the Breast Cancer Surveillance Consortium. J Natl Cancer Inst. 2012;104(16):1218–1227. [DOI] [PMC free article] [PubMed] [Google Scholar]
- 15. Li J, Humphreys K, Eriksson L, Edgren G, Czene K, Hall P. Mammographic density reduction is a prognostic marker of response to adjuvant tamoxifen therapy in postmenopausal patients with breast cancer. J Clin Oncol. 2013;31(18):2249–2256. [DOI] [PMC free article] [PubMed] [Google Scholar]
- 16. Cuzick J, Warwick J, Pinney E, et al. Tamoxifen-induced reduction in mammographic density and breast cancer risk reduction: a nested case-control study. J Natl Cancer Inst. 2011;103(9):744–752. [DOI] [PubMed] [Google Scholar]
- 17. Byng JW, Boyd NF, Fishell E, Jong RA, Yaffe MJ. The quantitative analysis of mammographic densities. Phys Med Biol. 1994;39(10):1629–1638. [DOI] [PubMed] [Google Scholar]
- 18. Raghunathan TE, Lepkowski JM, Hoewyk JV, Solenberger P. A Multivariate technique for multiply imputing missing values using a sequence of regression models. Survey Methodology. 2001;27(1):85–95. [Google Scholar]
- 19. Desmarais JE, Looper KJ. Interactions between tamoxifen and antidepressants via cytochrome P450 2D6. J Clin Psychiatry. 2009;70(12):1688–1697. [DOI] [PubMed] [Google Scholar]
- 20. Boyd N, Martin L, Stone J, Little L, Minkin S, Yaffe M. A longitudinal study of the effects of menopause on mammographic features. Cancer Epidemiol Biomarkers Prev. 2002;11(10 Pt 1):1048–1053. [PubMed] [Google Scholar]
- 21. Greendale GA, Reboussin BA, Slone S, Wasilauskas C, Pike MC, Ursin G. Postmenopausal hormone therapy and change in mammographic density. J Natl Cancer Inst. 2003;95(1):30–37. [DOI] [PubMed] [Google Scholar]
- 22. Rutter CM, Mandelson MT, Laya MB, Seger DJ, Taplin S. Changes in breast density associated with initiation, discontinuation, and continuing use of hormone replacement therapy. JAMA. 2001;285(2):171–176. [DOI] [PubMed] [Google Scholar]
- 23. Nilsson UW, Jonsson JA, Dabrosin C. Tamoxifen decreases extracellular TGF-beta1 secreted from breast cancer cells--a post-translational regulation involving matrix metalloproteinase activity. Exp Cell Res. 2009;315(1):1–9. [DOI] [PubMed] [Google Scholar]
- 24. Guvakova MA, Surmacz E. Tamoxifen interferes with the insulin-like growth factor I receptor (IGF-IR) signaling pathway in breast cancer cells. Cancer Res. 1997;57(13):2606–2610. [PubMed] [Google Scholar]
- 25. Li J, Czene K, Brauch H, et al. Association of CYP2D6 metabolizer status with mammographic density change in response to tamoxifen treatment. Breast Cancer Res. 2013;15(5):R93. [DOI] [PMC free article] [PubMed] [Google Scholar]
- 26. Rae JM, Regan MM, Thibert JN, et al. Concordance between CYP2D6 genotypes obtained from tumor-derived and germline DNA. J Natl Cancer Inst. 2013;105(17):1332–1334. [DOI] [PMC free article] [PubMed] [Google Scholar]
- 27. Regan MM, Leyland-Jones B, Bouzyk M, et al. CYP2D6 genotype and tamoxifen response in postmenopausal women with endocrine-responsive breast cancer: the breast international group 1–98 trial. J Natl Cancer Inst. 2012;104(6):441–451. [DOI] [PMC free article] [PubMed] [Google Scholar]
- 28. Terasawa T, Dahabreh I, Castaldi PJ, Trikalinos TA. Systematic reviews on selected pharmacogenetic tests for cancer treatment: CYP2D6 for tamoxifen in breast cancer, KRAS for anti-EGFR antibodies in colorectal cancer, and BCR-ABL1 for tyrosine kinase inhibitors in chronic myeloid leukemia. In. Technology Assessment Report: Tufts Medical Center Evidence-based Practice Center; 2010. [PubMed] [Google Scholar]
Associated Data
This section collects any data citations, data availability statements, or supplementary materials included in this article.