

Abstract
Background:
Distant metastasis is the major cause of mortality in colorectal cancer (CRC). We performed a systemic, comprehensive discovery for expression patterns of metastasis-specific microRNAs (miRNAs) by directly comparing primary CRCs (pCRCs) and matched liver metastases (LMs) and evaluated the feasibility of their clinical application as metastasis-specific biomarkers.
Methods:
CRC metastasis–specific miRNA profiles were generated by analyzing nine pairs of pCRC and LM tissues, followed by quantitative validation in an independent cohort of 58 pairs of matched pCRC and LM tissues. We evaluated associations between miRNA expression and patient survival and ability to predict metastasis in another 84 patients with CRC. Subsequently, associations were quantitatively validated in 175 CRC tissues and 169 serum samples. Kaplan-Meier, Cox regression, and logistic regression analyses were used. All statistical tests were two-sided.
Results:
Twenty-three miRNAs were identified that were differentially expressed between pCRC and LM (P < .001; FDR < .5). Four miRNAs downregulated in LM (let-7i, miR-10b, miR-221, and miR-320a) and one upregulated miR (miR-885-5p) were quantitatively validated in pCRC (P < .0001). Low let-7i expression in pCRC tissue predicted worsened prognosis (hazard ratio [HR] = 5.0, 95% confidence interval [CI] = 1.0 to 24.4, P = .0479) as well as distant metastasis (odds ratio [OR] = 5.5, 95% CI = 1.1 to 26.8, P = .0334). High miR-10b expression in pCRC tissue independently predicted distant metastasis (OR = 4.9, 95% CI = 1.2 to 19.7, P = .0248). High serum miR-885-5p expression independently predicted prognosis (HR = 2.9, 95% CI = 1.1 to 7.5, P = .0323), LN metastasis (OR = 3.0, 95% CI = 1.3 to 7.2, P = .0116), and distant metastasis (OR = 3.1, 95% CI = 1.0 to 10.0, P = .0456), whereas tissue miR-885-5p expression did not. Expression patterns of miRNAs were confirmed by in situ hybridization.
Conclusions:
We discovered a metastasis-specific miRNA signature in pCRCs and discovered novel tissue- and serum-based CRC metastasis–specific miRNA biomarkers through intensive validation. These unique miRNAs may be clinically applicable to predict prognosis and distant metastasis in CRC.
Colorectal cancer (CRC) is the second leading cause of cancer-related death worldwide (1). Distant metastasis is the major cause of serious morbidity and mortality in cancer patients. Liver metastasis is the most common manifestation, and occurs in more than 50% of CRC patients with metastases (2). Aggressive liver resection in metastatic CRC patients may improve the five-year survival, but most of these patients still experience tumor recurrence (3). Although current diagnostic imaging tools such as contrast enhanced computed tomography (CT), positron emission tomography-CT (PET-CT), and magnetic resonance imaging (MRI) can facilitate the detection of CRC metastasis (4), these modalities are of limited value because of the inability to identify truly early metastatic lesions and the costs associated with advanced imaging. In view of this clinical challenge, there is a clear need for the development of metastasis-specific molecular biomarkers that can help predict outcomes and direct more effective therapies.
MicroRNAs (miRNAs) are small noncoding RNAs that play a central role as master regulators of gene expression in multiple cancer-related signaling pathways, including metastasis (5,6). There is convincing data that upregulation of the miR-17–92 cluster and downregulation of miR-107 permits enhanced angiogenesis in cancer cells (7,8). Likewise, invasion and migration are positively regulated by miR-21 and miR-31 (9,10). More recently, we have demonstrated that miR-200c plays a pivotal role in regulating EMT and metastatic behavior in CRC (11).
Previous work from our group and others has shown that several miRNAs are differentially expressed in cancers, including CRC (5,12–15). MiRNA signatures are emerging as promising biomarkers for diagnosis, prognosis, and metastasis for cancer patients (12,16). Most studies to date have focused on the role for miRNAs in primary tumors but not the metastatic foci. A more systematic and comprehensive analysis is necessary to determine the specific involvement of miRNAs in CRC metastasis. Also, miRNAs are relatively stable and measurable, making them ideal targets for molecular diagnostics.
We developed a metastasis-specific miRNA biomarker discovery approach that involved comprehensive miRNA expression profiling of both primary CRC (pCRC) and matched liver metastasis (LM) tissues, followed by validation of these newly discovered miRNA biomarkers in multiple, large, independent cohorts of tissues. We assessed the association of the expression patterns of these miRNAs with important clinicopathological parameters related to CRC metastasis. We also evaluated the feasibility of these miRNAs as tissue-based and serum-based metastasis-specific biomarkers.
Methods
Patient Samples
This study utilized 477 tissue specimens including 326 pCRCs, 67 matched corresponding LMs, and 84 adjacent nontumor colonic tissues from four different CRC patient cohorts that are described in Supplementary Table 1 (available online). In addition, 169 serum samples from CRC patients were also analyzed (Supplementary Table 1, available online).
For the NanoString screening analysis, nine pairs of frozen pCRC tissue and LM tissue (NanoString discovery cohort) were used. For validation, 58 pairs of formalin-fixed paraffin-embedded (FFPE) pCRC tissues and matched corresponding LM tissues (NanoString validation cohort) from Okayama University and Toho University, Japan were used.
For miRNA microarray analysis, 84 pairs of frozen pCRC and adjacent nontumor tissues (Microarray cohort) were obtained from the University of Maryland Medical Center or Baltimore Veterans Affairs Medical Center, as described previously (12). The validation cohort for this analysis included 175 FFPE pCRC tissues (CRC tissue cohort) from Mie University Medical Hospital, Japan.
For miRNA analysis in blood, 169 serum samples from CRC patients (CRC serum cohort) enrolled at the Mie University Medical Hospital, Japan were also included. The CEA expression levels in 169 serum samples were measured by standard enzyme immunoassay.
Both tissue- and serum-based studies were approved by the institutional review boards (IRBs) of all involved institutions, and written informed consent was obtained from all patients. Details for the nanostring assay, miRNA microarray analysis, miRNA isolation, quantitative real-time polymerase chain reaction (qRT-PCR), and in situ hybridization (ISH) analysis are in Supplementary Methods (available online).
Statistical Analysis
Overall survival was measured from the date the patient underwent surgery until the date of death resulting from any cause or last known follow-up for patients still alive. Disease-free survival analysis was measured from the date the patient underwent surgery to the date of disease recurrence, death from any cause (ie, noncancer deaths were not censored), or until last contact with the patient. F tests were used to assess the equality of variances for comparable groups. Paired t test, One-way analysis of variance (ANOVA), Kruskal-Wallis test, and χ2 tests were used to analyze microRNA expression. The O’Brien test was used for multiple variable assessment of miRNA expression in a validation cohort of matching pCRC and LM tissues (17). For time-to-event analyses, survival estimates were calculated by the Kaplan-Meier analysis, and groups were compared with the log-rank test. Receiver operating characteristic curves were established to discriminate the patients with or without death, and Youden’s index (18) was used to determine the optimal cutoff threshold of miRNA expression values from the miRNA microarray cohort, miRNA microarray validation cohort, and serum cohort to predict the overall survival. The Cox’s proportional hazards models were used to estimate hazard ratios (HRs) of death. Assumptions of proportionality were confirmed for the Cox proportional hazards analyses by generating Kaplan-Meier survival curves (eg, high- vs low-expression groups) and by ensuring that the two curves did not intersect each other. Multivariable logistic regression models were used to calculate odds ratios (ORs) of lymph node (LN) metastasis and distant metastasis. Forced-entry regression was used to include all multiple variables in order to analyze whether each of the predictors affected the outcome after adjusting for known confounders. Clinical variables that were considered for single variable and multivariable analyses, in addition to target miRNA expression, were previously identified as confounding variables with impact on the prognosis of patients with colorectal cancer: sex, age at diagnosis (continuous), T-stage (T1/2 vs T3/4), tumor size (>40mm vs ≤40mm), pathological differentiation (well to moderate vs poor), venous invasion (present vs absent), lymph node metastasis (present vs absent), liver metastasis (presence vs absence), distant metastasis (presence vs absent), and CEA (>5ng/mL vs ≤5ng/mL). Tests for interaction were performed by the likelihood ratio test of cross-product terms. Data are presented as mean±standard deviation and all P values were two-sided, and those less than .05 were considered statistically significant. All statistical analyses were conducted using the Medcalc version 12.3 (Broekstraat, Belgium) and the GraphPad Prism version 5.0 (GraphPad Software, San Diego, CA).
Results
Profiling and Validation of CRC Metastasis-Specific miRNAs in Paired pCRC and LM Tissues
To discover CRC metastasis-specific miRNAs, we utilized a series of high-throughput techniques for miRNA discovery, followed by quantitative analytical approaches to validate candidate miRNAs using several large and independent collections of matching pCRCs and LM tissues as shown in Supplementary Figure 1 (available online). As the first step of metastasis-specific miRNA discovery, we performed NanoString-based miRNA expression profiling in nine pairs of matched pCRC and LM frozen tissues (Table 1). Twenty-three miRNAs were found to be differentially expressed between pCRC and matched LM tissues (P < .001; false discovery rate [FDR] < .5). All but three miRNAs (miR-122, miR-30b, and miR-885-5p) were downregulated in LM.
Table 1.
Differentially expressed CRC metastasis-specific microRNAs between matched primary CRC and liver metastasis in NanoString analysis (nine pairs of frozen pCRC tissue and synchronous LM tissue)*
| Probe from NanoString | Geometric mean | Fold change (LM/pCRC) | FDR | P | |
|---|---|---|---|---|---|
| pCRC (n = 9) | LM (n = 9) | ||||
| hsa-miR-199b-5p | 360.77 | 70.81 | 0.2 | 0.01 | 6.E-05 |
| hsa-let-7i | 2154.94 | 1133.07 | 0.53 | 0.14 | 2.E-03 |
| hsa-miR-484 | 69.79 | 39.14 | 0.56 | 0.14 | 2.E-03 |
| hsa-miR-490-3p | 47.13 | 21.67 | 0.46 | 0.21 | 4.E-03 |
| hsa-miR-122 | 27.01 | 507.91 | 18.8 | 0.26 | 8.E-03 |
| hsa-miR-320a | 33.94 | 22.05 | 0.65 | 0.26 | 8.E-03 |
| hsa-miR-520e | 53.73 | 13.01 | 0.24 | 0.26 | 8.E-03 |
| hsa-miR-10b | 64.28 | 19.67 | 0.31 | 0.27 | 1.E-02 |
| hsa-miR-337-5p | 20.81 | 11.8 | 0.57 | 0.39 | 2.E-02 |
| hsa-miR-485-3p | 89.95 | 50.39 | 0.56 | 0.39 | 2.E-02 |
| hsa-miR-145 | 2915.38 | 1267.64 | 0.43 | 0.39 | 2.E-02 |
| hsa-miR-144 | 294.09 | 116.61 | 0.4 | 0.39 | 2.E-02 |
| hsa-miR-25 | 688.42 | 405.21 | 0.59 | 0.39 | 3.E-02 |
| hsa-miR-221 | 294.27 | 209.8 | 0.71 | 0.39 | 3.E-02 |
| hsa-miR-216a | 59.45 | 34.54 | 0.58 | 0.39 | 3.E-02 |
| hsa-miR-92b | 44.38 | 32.31 | 0.73 | 0.39 | 3.E-02 |
| hsa-miR-365 | 56.55 | 29.25 | 0.52 | 0.39 | 3.E-02 |
| hsa-miR-708 | 269.88 | 155.4 | 0.58 | 0.39 | 3.E-02 |
| hsa-miR-143 | 2652.88 | 1338.82 | 0.5 | 0.39 | 3.E-02 |
| hsa-miR-196a | 112.84 | 45.6 | 0.4 | 0.42 | 4.E-02 |
| hsa-miR-451 | 2174.72 | 623.91 | 0.29 | 0.46 | 4.E-02 |
| hsa-miR-30b | 1092.95 | 1864.19 | 1.71 | 0.46 | 5.E-02 |
| hsa-miR-885-5p | 24.46 | 64.95 | 2.65 | 0.46 | 5.E-02 |
* P values are paired t tests on the log2-transformed values of the NanoString expression data. FDR, Benjamini, and Hochberg False discovery rate based on the 219 miRNAs that passed the filtering criteria. CRC = colorectal cancer; FDR = false discovery rate; LM = liver metastasis; pCRC = primary CRC.
After initial statistical analysis, for validation experiments we considered the functional relevance of the 23 miRNA panel in the context of CRC rather than just the statistical rankings based on P value and/or FDR. As a result, we discarded six miRNAs that are frequently related to the liver disease (miR-199b, miR-122, miR-145, miR-25, miR-92b, and miR-451) (19–21) and specifically selected four miRNAs that have been shown to play a functional role in CRC biology (let-7i [22], miR-320a [23], miR-10b [24], and miR-221 [25]). In addition, two miRNAs (miR-30b and miR-885-5p) that were upregulated in LM compared with pCRC were included in the validation step because of their potential as noninvasive biomarkers.
In subsequent validation by qRT-PCR in an independent cohort of 58 matched pCRC and LM tissues (Figure 1), all but one miRNA was validated, including all of the downregulated miRNAs (let-7i, 1.61 fold; miR-320a, 1.85 fold; miR-10b, 2.39 fold; miR-221, 1.68 fold) and one of the upregulated miRNAs miR-885-5p (7.34 fold) in LMs compared with pCRCs. In addition, multiple variables assessment of the six miRNAs by the O’Brien test revealed that expression status of these miRNAs was statistically significantly different between pCRC and LM tissues (P < .0001).
Figure 1.

Expression status of candidate microRNAs (miRNAs) as colorectal cancer (CRC) metastasis-specific biomarkers. Quantitative validation of selected four downregulated miRNAs (let-7i, miR-320a, miR-10b, and miR-221) and two upregulated miRNAs (miR-30b and miR-885-5p) in liver metastasis (LM) compared with primary CRC (pCRC) in an independent validation cohort of 58 pairs of matching pCRC and LM tissues. The gray horizontal bar represents mean expression levels; ***P < .0001, paired t test; ns = no significance; P < .0001, multiple variables assessment of six miRNAs by O’Brien test. LM = liver metastasis; miRNA = microRNA; pCRC = primary colorectal cancer.
Expression Patterns of Metastasis-Specific miRNAs in Primary CRC Tissues
To investigate the clinical relevance of metastasis-specific miRNAs in CRC development, we determined whether these miRNAs were altered in the primary tumors that had given rise to later metastasis compared with pCRCs that did not. We further validated four downregulated miRNAs (let-7i, miR-320a, miR-10b, and miR-221) in LM using our previous miRNA microarray data on 84 pairs of frozen tumor and adjacent nontumor tissues (12). Because of the absence of the miRNA probe on our microarray platform, miR-885-5p was not available for validation in the miRNA microarray cohort. MiRNA expression in pCRCs was normalized to paired nontumor tissue by subtracting the log2 nontumor from the log2 tumor expression for let-7i, miR-320a, miR-10b, and miR-221. Let-7i (P = .01) expression was statistically significantly reduced, and miR-10b increased (P = .02) in the pCRCs of patients who suffered synchronous distant metastases compared with pCRCs of patients who did not (Supplementary Table 2, available online). MiR-221 (P = .121) and miR-320a (P = .066) were nonstatistically increased in pCRCs of patients with distant metastases (Supplementary Table 2, available online). Based on these data and previous studies, we classified the miRNAs as tumor suppressor (let-7i [22] and miR-320a [23]) or oncogenic (miR-10b [24] and miR-221 [25]) miRNAs. In addition, increased miR-10b expression (P = .032) was statistically different among TNM stages in pCRC tissues (Supplementary Table 2, available online).
We used logistic regression to examine the potential of these miRNAs to predict metastases (Table 2). In the univariate model, low let-7i expression, low miR-320a expression, high miR-10b expression, and high miR-221 expression were statistically significantly associated with distant metastasis from CRC. The multivariable model revealed that low let-7i expression (OR = 21.7, 95% CI = 2.9 to 163.4, P = .0028) and high miR-10b expression (OR = 7.2, 95% CI = 1.2 to 44.1, P = .0328) were independent predictors of distant metastasis.
Table 2.
Association between miRNA expression and CRC prognosis and metastasis prediction in the miRNA microarray cohort (84 pairs of frozen pCRC and adjacent nontumor tissues)*
| Characteristics | Univariate | Multivariable | ||
|---|---|---|---|---|
| HR (95% CI) | P | HR (95% CI) | P | |
| Association between miRNA expression and CRC prognosis (Cox proportional hazards model on overall survival) | ||||
| Tumor suppressor–miRNAs | ||||
| Age (>50 y vs ≤50 y) | 0.75 (0.23 to 2.47) | .6528 | 0.69 (0.20 to 2.43) | .5662 |
| Sex (male vs female) | 1.34 (0.56 to 3.21) | .4974 | 1.61 (0.63 to 4.09) | .3187 |
| T stage (T3/4 vs T1/2) | 2.28 (0.70 to 7.40) | .1262 | 1.75 (0.52 to 5.85) | .3682 |
| N stage (N1/2/3 vs N0) | 3.00 (1.45 to 6.21) | .0018 | 2.50 (1.17 to 5.36) | .0187 |
| M stage (M1 vs M0) | 8.46 (3.62 to 19.77) | <.0001 | 4.59 (1.81 to 11.60) | .0014 |
| hsa-let-7i (low vs high) | 2.67 (1.26 to 5.67) | .0066 | 2.28 (1.01 to 5.12) | .0471 |
| hsa-miR-320a (low vs high) | 1.68 (0.87 to 3.25) | .1239 | 1.03 (0.51 to 2.10) | .9327 |
| Oncogenic-miRNAs | ||||
| Age (>50 y vs ≤50 y) | 0.75 (0.23 to 2.47) | .6528 | 0.67 (0.19 to 2.35) | .5377 |
| Sex (male vs female) | 1.34 (0.56 to 3.21) | .4974 | 1.75 (0.70 to 4.41) | .2341 |
| T stage (T3/4 vs T1/2) | 2.28 (0.70 to 7.40) | .1262 | 1.92 (0.57 to 6.50) | .2966 |
| N stage (N1/2/3 vs N0) | 3.00 (1.45 to 6.21) | .0018 | 2.43 (1.14 to 5.21) | .0227 |
| M stage (M1 vs M0) | 8.46 (3.62 to 19.77) | <.0001 | 4.77 (1.89 to 12.04) | .001 |
| hsa-miR-10b (high vs low) | 1.92 (0.96 to 3.83) | .0599 | 1.22 (0.57 to 2.59) | .6123 |
| hsa-miR-221 (high vs low) | 2.00 (0.97 to 4.15) | .0515 | 1.64 (0.73 to 3.71) | .236 |
| Association between miRNA expression and CRC distant metastasis (logistic regression model) | ||||
| Tumor suppressor–miRNAs | ||||
| Age (>50 y vs ≤50 y) | 0.79 (0.09 to 7.37) | .8428 | 0.96 (0.05 to 17.91) | .9785 |
| Sex (male vs female) | 1.10 (0.21 to 5.72) | .906 | 1.79 (0.20 to 16.25) | .6033 |
| T stage (T3/4 vs T1/2) | 2.05 (0.63 to 6.82) | .0673 | 6.76 (0.52 to 99.52) | .9933 |
| N stage (N1/2/3 vs N0) | 9.00 (1.09 to 74.66) | .0102 | 9.49 (0.80 to 113.08) | .0752 |
| hsa-let-7i (low vs high) | 19.25 (4.13 to 89.68) | .0001 | 21.68 (2.88 to 163.37) | .0028 |
| hsa-miR-320a (low vs high) | 5.52 (1.30 to 23.31) | .0144 | 1.28 (0.17 to 9.71) | .8126 |
| Oncogenic-miRNAs | ||||
| Age (>50 y vs ≤50 y) | 0.79 (0.09 to 7.37) | .8428 | 0.37 (0.03 to 5.44) | .4682 |
| Sex (male vs female) | 1.10 (0.21 to 5.72) | .906 | 0.74 (0.09 to 6.02) | .7745 |
| T stage (T3/4 vs T1/2) | 2.05 (0.63 to 6.82) | .0673 | 3.06 (0.24 to 45.02) | .9954 |
| N stage (N1/2/3 vs N0) | 9.00 (1.09 to 74.66) | .0102 | 10.19 (0.89 to 116.30) | .0616 |
| hsa-miR-10b (high vs low) | 7.63 (1.86 to 31.18) | .0044 | 7.20 (1.18 to 44.12) | .0328 |
| hsa-miR-221 (high vs low) | 9.00 (1.09 to 74.66) | .0102 | 8.54 (0.88 to 82.92) | .0645 |
* All statistical tests were two-sided. CI = confidence interval; CRC = colorectal cancer; HR = hazard ratio; M stage = distant metastasis in Union for International Cancer Control classification; miRNA = microRNA; N stage = lymph node metastasis; OR = odds ratio; pCRC = primary CRC; T stage = tumor depth.
We determined that the expression of these four miRNAs was associated with survival in CRC patients. Low expression of let-7i was statistically significantly associated with poor survival in CRC patients (log-rank P = .0082) (Figure 2). Statistically significant associations with survival were not observed for the other miRNAs. Univariate Cox regression analysis revealed that low let-7i expression was statistically significantly associated with poor prognosis (Table 2). In the multivariable model, low let-7i expression (HR = 2.3, 95% CI = 1.0 to 5.1, P = .0471) was an independent predictor for poor prognosis. We found no evidence of interaction between tumor suppressor–miRNAs (let-7i and miR-320a) as well as oncogenic-miRNAs (miR-10b and miR-221) in Cox regression and logistic regression outcome models, respectively (all P interaction > .10) (Supplementary Table 3, available online).
Figure 2.

Kaplan-Meier Survival Analysis based on microRNA (miRNA) microarray cohort (frozen tissue). Overall survival analysis based on four miRNAs (let-7i, miR-10b, miR-221, and miR-320a) in miRNA microarray cohort. The P values were determined by log-rank test. All statistical tests were two-sided.
Validation of Metastasis-Specific miRNAs (let-7i and miR-10b) in Primary CRC
While microarray analysis can detect differential miRNA expression for thousands of miRNAs simultaneously, it is limited in that it is less accurate than more targeted approaches to measure gene expression. Therefore, we measured the expression of let-7i and miR-10b using qRT-PCR analysis in an independent cohort of 175 pCRC tissues (Table 3; Supplementary Table 4, available online). Reduced let-7i expression was statistically different among categories of lymph node metastasis (P = .0407), distant metastasis (P < .0001), and advanced TNM stage (P = .0002) (Supplementary Table 4, available online). In contrast, increased miR-10b expression was statistically significantly different among categories of T stage (P = .0183), distant metastasis (P = .0486), and advanced TNM stage (P = .0208) (Supplementary Table 4, available online). The univariate logistic regression model provided similar results, that is, low let-7i expression and high miR-10b expression were statistically significantly associated with CRC-distant metastasis (Table 3). The multivariable model showed that low let-7i expression (OR = 5.5, 95% CI = 1.1 to 26.8, P = .0334) and high miR-10b expression (OR = 4.9, 95% CI = 1.2 to 19.7, P = .0248) were statistically significant predictors of CRC distant metastasis (Table 3).
Table 3.
Association between miRNA biomarker expression and CRC prognosis and metastasis prediction in the CRC tissue cohort (175 FFPE pCRC tissues)*
| Characteristics | Univariate | Multivariable | ||
|---|---|---|---|---|
| HR (95% CI) | P | HR (95% CI) | P | |
| Association between miRNA expression and CRC prognosis (Cox proportional hazards model on overall survival) | ||||
| Tumor suppressor–miRNAs | ||||
| Age (>68 y vs ≤68 y) | 0.80 (0.44 to 1.48) | .4816 | 1.53 (0.77 to 3.05) | .2302 |
| Sex (male vs female) | 1.15 (0.61 to 2.16) | .662 | 1.79 (0.88 to 3.64) | .1112 |
| T stage (T3/4 vs T1/2) | 7.94 (1.93 to 32.62) | .0001 | 1.71 (0.39 to 7.48) | .4763 |
| N stage (N1/2/3 vs N0) | 15.18 (5.42 to 42.50) | <.0001 | 6.44 (2.13 to 19.45) | .001 |
| Liver metastasis (present vs absent) | 12.06 (6.08 to 23.94) | <.0001 | 6.69 (2.95 to 15.17) | <.0001 |
| Pathology (poor diff. vs well/mod diff.) | 1.84 (0.77 to 4.37) | .2005 | 4.11 (1.40 to 12.06) | .105 |
| CEA (>5ng/mL vs ≤5ng/mL) | 5.46 (2.28 to 13.08) | <.0001 | 1.60 (0.62 to 4.09) | .3335 |
| hsa-let-7i (low vs high) | 5.35 (1.30 to 22.02) | .0026 | 5.00 (1.02 to 24.35) | .0479 |
| Oncogenic-miRNAs | ||||
| Age (>68 y vs ≤68 y) | 0.80 (0.44 to 1.48) | .4816 | 1.14 (0.58 to 2.24) | .7082 |
| Sex (male vs female) | 1.15 (0.61 to 2.16) | .662 | 1.45 (0.74 to 2.84) | .2807 |
| T stage (T3/4 vs T1/2) | 7.94 (1.93 to 32.62) | .0001 | 1.96 (0.44 to 8.69) | .3792 |
| N stage (N1/2/3 vs N0) | 15.18 (5.42 to 42.50) | <.0001 | 6.29 (2.04 to 19.38) | .0015 |
| Liver metastasis (present vs absent) | 12.06 (6.08 to 23.94) | <.0001 | 5.95 (2.58 to 13.69) | <.0001 |
| Pathology (poor diff. vs well/mod diff.) | 1.84 (0.77 to 4.37) | .2005 | 2.47 (0.90 to 6.77) | .0794 |
| CEA (>5ng/mL vs ≤5ng/mL) | 5.46 (2.28 to 13.08) | <.0001 | 1.67 (0.63 to 4.45) | .3039 |
| hsa-miR-10b (high vs low) | 1.57 (0.66 to 3.70) | .3097 | 0.82 (0.35 to 1.96) | .6623 |
| Association between miRNA expression and CRC distant metastasis (logistic regression model) | ||||
| Tumor suppressor–miRNAs | ||||
| Age (>68 y vs ≤68 y) | 0.56 (0.29 to 1.11) | .0958 | 0.54 (0.22 to 1.32) | .1778 |
| Sex (male vs female) | 1.08 (0.55 to 2.13) | .8166 | 1.21 (0.49 to 2.98) | .682 |
| T stage (T3/4 vs T1/2) | 5.38 (1.83 to 15.83) | .0022 | 2.04 (0.49 to 8.57) | .3294 |
| N stage (N1/2/3 vs N0) | 33.17 (9.78 to 112.48) | <.0001 | 23.37 (6.55 to 83.46) | <.0001 |
| hsa-let-7i (low vs high) | 5.99 (1.37 to 26.19) | .0175 | 5.54 (1.14 to 26.80) | .0334 |
| Oncogenic-miRNAs | ||||
| Age (>68 y vs ≤68 y) | 0.56 (0.29 to 1.11) | .0958 | 0.41 (0.17 to 1.01) | .0533 |
| Sex (male vs female) | 1.08 (0.55 to 2.13) | .8166 | 1.23 (0.49 to 3.06) | .6615 |
| T stage (T3/4 vs T1/2) | 5.38 (1.83 to 15.83) | .0022 | 2.41 (0.57 to 10.13) | .2301 |
| N stage (N1/2/3 vs N0) | 33.17 (9.78 to 112.48) | <.0001 | 25.34 (7.02 to 91.48) | <.0001 |
| hsa-miR-10b (high vs low) | 2.86 (0.82 to 10.02) | .05 | 4.91 (1.22 to 19.73) | .0248 |
* All statistical tests were two-sided. CI = confidence interval; CRC = colorectal cancer; HR = hazard ratio; miRNA = microRNA; N stage = lymph node metastasis in Union for International Cancer Control classification; OR = odds ratio; T stage = tumor depth.
Kaplan-Meier survival analysis revealed that low expression of let-7i was statistically significantly associated with poor overall survival (P = .0095) and poor disease-free survival (P = .0043) in CRC patients, validating our findings from the CRC tissue cohort (Figure 3A). Although single miR-10b expression was not associated with survival (Figure 3B), the combination of low let-7i and/or high miR-10b expression in CRC patients was statistically significantly associated with metastasis recurrence (P = .0246) (Supplementary Figure 2, available online). Using the univariate Cox proportional hazard model (Table 3), low let-7i expression was statistically significantly associated with poor prognosis. In the multivariable model, low let-7i expression (HR = 5.0, 95% CI = 1.0 to 24.4, P = .0479) was independently associated with poor patient survival.
Figure 3.
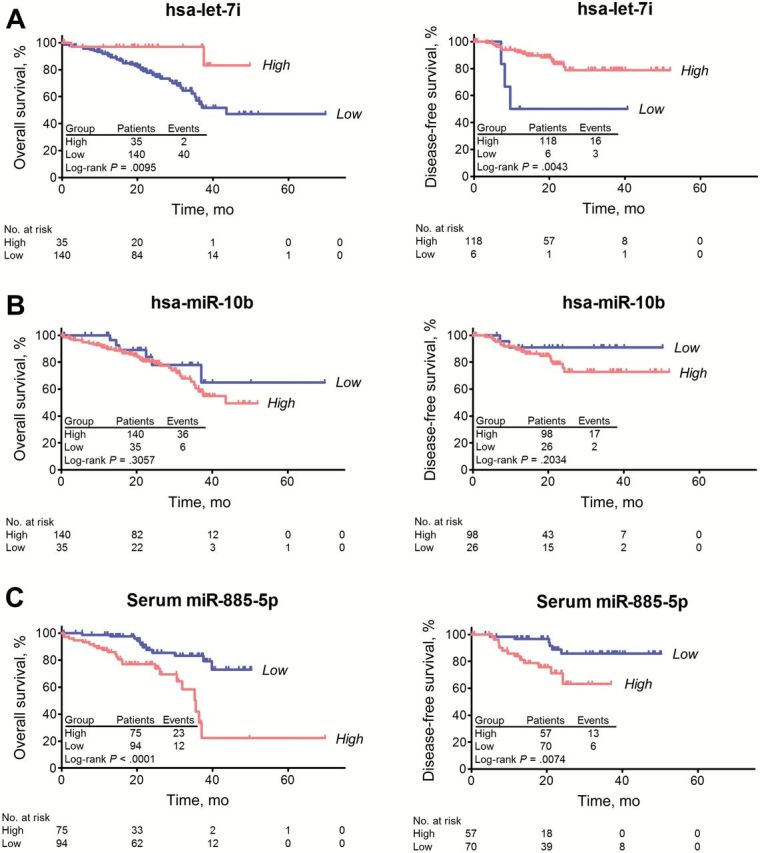
Kaplan-Meier Survival Analysis based on different types of specimen cohorts (FFPE tissue and serum). A) Overall survival (left panel) and disease-free survival (right panel) analyses based on let-7i in colorectal cancer (CRC) tissue cohort. B) Overall survival (left panel) and disease-free survival (right panel) analyses based on miR-10b in CRC tissue cohort. C) Overall survival (left panel) and disease-free survival (right panel) analyses based on miR-885-5p in CRC serum cohort. The P values were determined by log-rank test. Disease recurrence was observed in 19 patients, which included three patients with stage II disease and 16 with stage III cancers. All statistical tests were two-sided.
miR-885-5p Expression Pattern in Primary CRC Tissue and Serum Specimens
As described above, miR-885-5p was the only miRNA to be elevated in LM compared with pCRC in both the NanoString discovery and NanoString validation cohorts. Since this miRNA is elevated in LM, we hypothesized that circulating levels of this miRNA would be associated with the presence of metastasis. Therefore, we examined the association of miR-885-5p in matched pCRC tissue and serum samples in the context of various clinicopathological factors (Supplementary Table 5, available online). This is the first study to interrogate the role of miR-885-5p in CRC and cancer metastasis. Serum miR-885-5p expression was statistically significantly associated with lymph node metastasis (P = .0327), distant metastasis (P = .0069), TNM stage (P = .0235), liver metastasis (P = .0011), and lymphatic invasion (P = .0141). Tissue expression of miR-885-5p expression was not associated with clinico-pathological factors.
We used logistic regression to further analyze the association between miR-855-5p and lymph node metastasis and distant metastasis, respectively (Table 4). Univariate logistic regression showed that high serum miR-885-5p expression was statistically significantly associated with lymph node metastasis and distant metastasis. Multivariable models demonstrated that these associations were statistically significant independent of other clinical factors (LN metastasis: OR = 3.0, 95% CI = 1.3 to 7.2, P = .0116 and distant metastasis: OR = 3.1, 95% CI = 1.0 to 10.0, P = .0456).
Table 4.
Association between expression levels of miR-885-5p and CRC prognosis and metastasis prediction in the matched CRC tissue and serum cohorts (175 FFPE pCRC tissues and 169 sera)
| Characteristics | Univariate | Multivariable | ||
|---|---|---|---|---|
| HR (95% CI) | P | HR (95% CI) | P | |
| Association between miRNA expression and CRC prognosis (Cox proportional hazards model on overall survival) | ||||
| Age (>68 y vs ≤68 y) | 0.76 (0.43 to 1.35) | .3533 | 1.17 (0.50 to 2.76) | .7213 |
| Sex (male vs female) | 1.09 (0.60 to 1.96) | .7875 | 1.40 (0.59 to 3.28) | .4461 |
| Tumor size (>40mm vs ≤40mm) | 2.35 (1.27 to 4.35) | .0066 | 0.78 (0.29 to 2.10) | .6302 |
| Lymph node metastasis (present vs absent) | 17.05 (6.13 to 47.44) | <.0001 | 7.80 (1.55 to 39.34) | .0133 |
| Distant metastasis (present vs absent) | 35.93 (14.78 to 87.42) | <.0001 | 15.09 (4.74 to 48.10) | <.0001 |
| CEA (>5ng/mL vs ≤5ng/mL) | 5.14 (2.29 to 11.56) | .0001 | 0.87 (0.26 to 2.85) | .8125 |
| Tissue miR-885-5p (high vs low) | 0.95 (0.48 to 1.90) | .895 | 0.87 (0.33 to 2.30) | .7793 |
| Serum miR-885-5p (high vs low) | 3.94 (1.91 to 8.11) | .0002 | 2.87 (1.10 to 7.51) | .0323 |
| Association between miRNA expression and CRC lymph node metastasis (logistic regression model) | ||||
| Age (>68 y vs ≤68 y) | 0.86 (0.49 to 1.50) | .5922 | 1.48 (0.65 to 3.36) | .3518 |
| Sex (male vs female) | 0.81 (0.46 to 1.43) | .4736 | 0.54 (0.25 to 1.19) | .1272 |
| Tumor size (>40mm vs ≤40mm) | 2.26 (1.28 to 4.01) | .0052 | 1.89 (0.82 to 4.32) | .1336 |
| Pathology (poor diff. vs diff.) | 2.14 (0.79 to 5.78) | .1322 | 1.65 (0.41 to 6.65) | .4817 |
| Venous Invasion (present vs absent) | 3.99 (2.21 to 7.22) | <.0001 | 2.03 (0.91 to 4.52) | .0835 |
| CEA (>5ng/mL vs ≤5ng/mL) | 3.60 (1.90 to 6.84) | .0001 | 2.12 (0.92 to 4.86) | .0767 |
| Tissue miR-885-5p (high vs low) | 0.59 (0.31 to 1.16) | .1269 | 0.47 (0.20 to 1.09) | .0788 |
| Serum miR-885-5p (high vs low) | 2.08 (1.11 to 3.89) | .0226 | 3.03 (1.28 to 7.18) | .0116 |
| Association between miRNA expression and CRC distant metastasis (logistic regression model) | ||||
| Tumor size (>40mm vs ≤40mm) | 3.32 (1.59 to 6.93) | .0014 | 1.81 (0.52 to 6.37) | .3545 |
| Lymph node metastasis (present vs absent) | 33.17 (9.78 to 112.47) | <.0001 | 34.73 (4.32 to 279.04) | .0008 |
| Venous Invasion (present vs absent) | 5.78 (2.71 to 12.31) | <.0001 | 4.82 (1.36 to 17.03) | .0146 |
| Tissue miR-885-5p (high vs low) | 0.64 (0.28 to 1.47) | .2941 | 0.57 (0.16 to 2.00) | .3824 |
| Serum miR-885-5p (high vs low) | 3.42 (1.45 to 8.06) | .005 | 3.12 (0.97 to 10.03) | .0456 |
* All statistical tests were two-sided. CI = confidence interval; CRC = colorectal cancer; HR = hazard ratio; miRNA = microRNA; OR = odds ratio; pCRC = primary CRC.
Kaplan-Meier survival analysis showed that high expression of serum miR-885-5p was statistically significantly associated with poor overall survival (P < .0001) as well as poor disease-free survival (P = .0074) (Figure 3C), while tissue miR-885-5p expression was not (P = .8947) (Supplementary Figure 3, available online). Similarly, univariate Cox regression revealed that high serum miR-885-5p expression was statistically significantly associated with poor prognosis (Table 4). In the multivariable model, high serum miR-885-5p expression (HR = 2.9, 95% CI = 1.1 to 7.5, P = .0323) was a statistically significant predictor of poor survival. We found no evidence of interaction between tissue miR-885-5p and serum miR-885-5p in Cox regression and logistic regression outcome models, respectively (all P interaction > .10) (Supplementary Table 6, available online).
Expression of CRC Metastasis-Specific miRNAs (let-7i, miR-10b, and miR-885-5p)
To further confirm the pathologic expression patterns of let-7i, miR-10b, and miR-885-5p, in situ hybridization (ISH) staining was performed on 20 pCRCs without metastasis and 20 with metastasis from the 175 CRC tissue cohort (Figure 4A) and in matched 20 pCRC and 20 LM tissues (Figure 4B). Consistent with our quantitative PCR (qPCR) results, ISH analysis showed low let-7i and high miR-10b expression in pCRCs with metastasis compared with pCRCs without metastasis, while miR-885-5p expression was comparable between pCRCs without metastasis and pCRCs with metastasis. We also observed downregulated expression of let-7i and miR-10b and upregulated miR-885-5p expression in LM compared with pCRC. Interestingly, adjacent hepatocytes barely expressed any of the three CRC metastasis-specific miRNAs.
Figure 4.
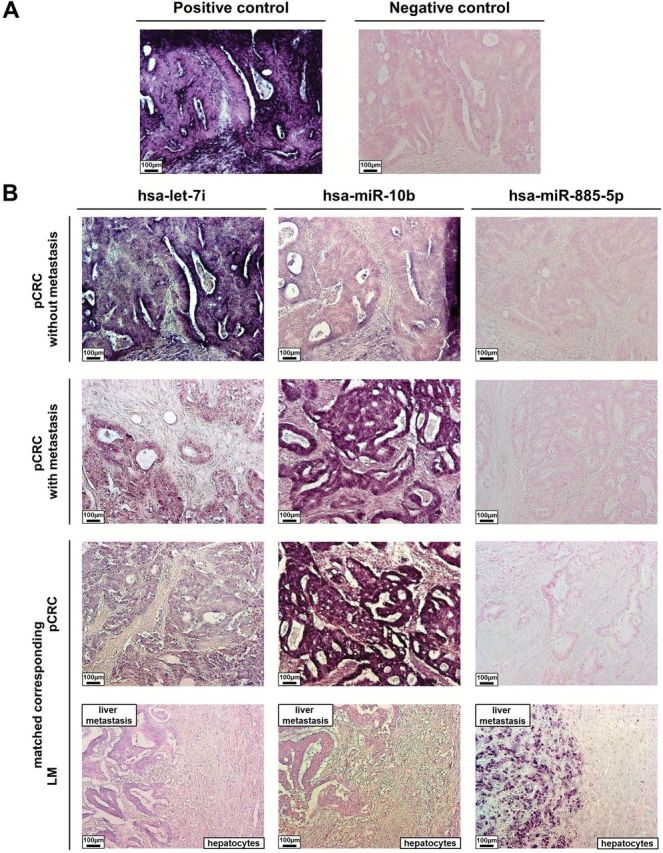
In situ expression of colorectal cancer (CRC) metastasis-specific microRNAs (miRNAs; let-7i, miR-10b, and miR-885-5p). Pathologic expression patterns of three validated CRC metastasis-specific miRNAs (let-7i, miR-10b, and miR-885-5p) were determined by hybridization with LNA-modified and 5`- and 3`-DIG-labeled oligonucleotide probes. In situ hybridization analysis of let-7i, miR-10b, and miR-885-5p in (A) positive and negative controls (primary colorectal cancer [pCRC]) and (B) matched primary pCRC with and without metastases and expression in the matched liver metastasis (positive control, U6 snRNA; negative control, scrambled miRNA control). LM = liver metastasis; pCRC = primary colorectal cancer.
Discussion
This study utilized a series of high-throughput screening techniques for discovery, and quantitative analytical approaches to validate CRC metastasis–specific miRNAs using several large and independent patient cohorts (Supplementary Figure 1, available online). One of the unique strengths of our study is that we directly compared pCRC and matching LM tissues from the same patients, which facilitated discovery of distinct miRNAs in metastasized lesions. Moreover, our approach for selecting overexpressed miRNAs in metastasized lesions allowed discovery of noninvasive circulating biomarkers for metastasis prediction. Previous studies for discovering CRC metastasis–specific miRNAs had the potential limitation of analyzing unmatched pairs of primary tumors and LM or lymph node metastases. In addition, these studies primarily explored the prognostic role of these biomarkers and did not evaluate their metastasis-predictive potential in CRC patients (26,27). Recently, we have demonstrated that miR-200c is overexpressed in LM compared with matched pCRC, and this miRNA is a key modulator of the EMT-MET process (11). Considering its tumor suppressor role, elevated expression of miR-200c in LM was unpredictable and intriguing. Our NanoString data also revealed that several miRNAs which had been reported as oncomiRs in CRC—such as miR-10b (24–26), miR-25 (28), miR-221 (25), miR-196a (29), and miR-451 (30)—were actually downregulated in LM tissues; which is discordant with their function in primary CRC. Furthermore, miR-320a and miR-221 did not contribute to distant metastasis in the CRC tissue cohort, but were statistically significantly downregulated in LM compared with pCRC. These findings highlight that studies focused on merely comparing primary cancer tissues associated with the presence or absence of metastasis may fail to find crucial information that can be gathered from the use of paired, metastatic lesions from the same patients. In view of this, our miRNA profiling and validation results provide novel and previously unrecognized information underlying a metastasis-specific miRNA signature in colorectal cancer.
To ensure the reliability and reproducibility of our discovery data, we intensively validated our findings for candidate miRNAs using multiple experimental techniques and by analyzing large, independent cohorts of both pCRC and matched LM tissues. In spite of this, miR-30b did not validate in qRT-PCR analysis, likely because of the differences in its expression levels between colon and rectal cancers (31,32). As a result, we were able to successfully validate the expression of a three CRC metastasis–specific miRNA signature (let-7i, miR-10b, and miR-885-5p) by using complementary analytical methods (NanoString, microarray, and qRT-PCR) and different types of specimen cohorts (frozen tissue, FFPE tissue, and serum). In addition, we confirmed the pathologic expression pattern of the three miRNAs by ISH analysis. While some of the discordant results between different patient cohorts analyzed in our study may be attributable to ethnic differences, we also feel that this is perhaps one of the unique strengths of our study, because we were able to validate data for the CRC metastasis–specific miRNA signature (let-7i, miR-10b, and miR-885-5p) discovered in our study among Japanese, Chinese, and US populations. We believe that identification of similarities between these different ethnic cohorts will allow better generalizability of these biomarkers across populations worldwide.
While examining the potential clinical impact of these metastasis-specific miRNAs, we observed that both let-7i and miR-10b were statistically significantly downregulated in LM compared with pCRC. Low let-7i expression and high miR-10b expression were independent predictors of distant metastasis in pCRC tissues. Notably, the combination of low let-7i and/or high miR-10b expression were statistically significantly associated with metastasis recurrence of CRC patients. Because each miRNA can regulate hundreds of different target genes (5,6), aberrantly expressed miRNAs in cancer tissues reflect the possible mechanistic basis of genetic dysregulation in multiple signaling pathways. Another novel and clinically relevant finding of our study is that we successfully elucidated the potential role of serum miR-885-5p as a noninvasive CRC biomarker. MiR-885-5p was statistically significantly upregulated in LM compared with pCRC tissues, and high serum miR-885-5p expression statistically significantly predicted CRC prognosis and metastasis. Although miR-885-5p expression in pCRC tissues was not associated with CRC clinicopathologic variables, high serum miR-885-5p was statistically significantly associated with both poor overall survival and poor disease-free survival. Notably, ISH analysis displayed specific and very high expression of miR-885-5p in LM tissues, suggesting that the elevated levels of serum miR-885-5p may be because of upregulation of this miRNA in distant metastasized cells, which may also permit identification of synchronous as well as metachronous metastasis in CRC patients. These results collectively provide a compelling rationale for further exploration of these newly discovered miRNAs as both tissue- and/or serum-based CRC metastasis biomarkers.
In conclusion, this study uncovers a unique and previously unrecognized metastasis-specific miRNA signature for CRC and highlights the importance of directly comparing primary and matched metastatic cancer tissues as an optimal approach to discover metastasis biomarkers. Our tissue-based and serum-based metastasis-specific miRNA biomarkers may be clinically applicable for the management of patients with CRC.
Funding
The present work was supported by grants R01 CA72851 and CA181572 from the National Cancer Institute, National Institutes of Health, and funds from the Baylor Research Institute.
Supplementary Material
The authors have no conflicts of interest to disclose. Author contributions: Study concept and design: Keun Hur, Aaron Schetter, Curtis Harris and Ajay Goel. Provision of clinical specimens: Yuji Toiyama. Acquisition of data: Keun Hur and Aaron Schetter. Data analysis and interpretation: Keun Hur, Aaron Schetter, Curtis Harris, Yuji Toiyama and Ajay Goel. Statistical analysis: Keun Hur, Aaron Schetter Yuji Toiyama and Yoshinaga Okugawa. Manuscript writing: Keun Hur, C Richard Boland and Ajay Goel.
References
- 1. Siegel R, Naishadham D, Jemal A. Cancer statistics, 2012. CA Cancer J Clin. 2012;62(1):10–29. [DOI] [PubMed] [Google Scholar]
- 2. Kopetz S, Chang GJ, Overman MJ, et al. Improved survival in metastatic colorectal cancer is associated with adoption of hepatic resection and improved chemotherapy. J Clin Oncol. 2009;27(22):3677–3683. [DOI] [PMC free article] [PubMed] [Google Scholar]
- 3. Rees M, Tekkis PP, Welsh FK, et al. Evaluation of long-term survival after hepatic resection for metastatic colorectal cancer: a multifactorial model of 929 patients. Ann Surg. 2008;247(1):125–135. [DOI] [PubMed] [Google Scholar]
- 4. Bipat S, van Leeuwen MS, Ijzermans JN, et al. Evidence-base guideline on management of colorectal liver metastases in the Netherlands. Neth J Med. 2007;65(1):5–14. [PubMed] [Google Scholar]
- 5. Calin GA, Croce CM. MicroRNA signatures in human cancers. Nat Rev Cancer. 2006;6(11):857–866. [DOI] [PubMed] [Google Scholar]
- 6. Lewis BP, Burge CB, Bartel DP. Conserved seed pairing, often flanked by adenosines, indicates that thousands of human genes are microRNA targets. Cell. 2005;120(1):15–20. [DOI] [PubMed] [Google Scholar]
- 7. Dews M, Homayouni A, Yu D, et al. Augmentation of tumor angiogenesis by a Myc-activated microRNA cluster. Nat Genet. 2006;38(9):1060–1065. [DOI] [PMC free article] [PubMed] [Google Scholar]
- 8. Yamakuchi M, Lotterman CD, Bao C, et al. P53-induced microRNA-107 inhibits HIF-1 and tumor angiogenesis. Proc Natl Acad Sci U S A. 2010;107(14):6334–6339. [DOI] [PMC free article] [PubMed] [Google Scholar]
- 9. Asangani IA, Rasheed SA, Nikolova DA, et al. MicroRNA-21 (miR-21) post-transcriptionally downregulates tumor suppressor Pdcd4 and stimulates invasion, intravasation and metastasis in colorectal cancer. Oncogene. 2008;27(15):2128–2136. [DOI] [PubMed] [Google Scholar]
- 10. Cottonham CL, Kaneko S, Xu L. miR-21 and miR-31 converge on TIAM1 to regulate migration and invasion of colon carcinoma cells. J Biol Chem. 2010;285(46):35293–35302. [DOI] [PMC free article] [PubMed] [Google Scholar]
- 11. Hur K, Toiyama Y, Takahashi M, et al. MicroRNA-200c modulates epithelial-to-mesenchymal transition (EMT) in human colorectal cancer metastasis. Gut. 2013;62(9):1315–1326. [DOI] [PMC free article] [PubMed] [Google Scholar]
- 12. Schetter AJ, Leung SY, Sohn JJ, et al. MicroRNA expression profiles associated with prognosis and therapeutic outcome in colon adenocarcinoma. JAMA. 2008;299(4):425–436. [DOI] [PMC free article] [PubMed] [Google Scholar]
- 13. Lu J, Getz G, Miska EA, et al. MicroRNA expression profiles classify human cancers. Nature. 2005;435(7043):834–838. [DOI] [PubMed] [Google Scholar]
- 14. Balaguer F, Moreira L, Lozano JJ, et al. Colorectal cancers with microsatellite instability display unique miRNA profiles. Clin Cancer Res. 2011;17(19):6239–6249. [DOI] [PMC free article] [PubMed] [Google Scholar]
- 15. Toiyama Y, Takahashi M, Hur K, et al. Serum miR-21 as a diagnostic and prognostic biomarker in colorectal cancer. J Natl Cancer Inst. 2013;105(12):849–859. [DOI] [PMC free article] [PubMed] [Google Scholar]
- 16. Calin GA, Ferracin M, Cimmino A, et al. A MicroRNA signature associated with prognosis and progression in chronic lymphocytic leukemia. N Engl J Med. 2005;353(17):1793–1801. [DOI] [PubMed] [Google Scholar]
- 17. O’Brien PC. Procedures for comparing samples with multiple endpoints. Biometrics 1984;40(4):1079–1087. [PubMed] [Google Scholar]
- 18. Ruopp MD, Perkins NJ, Whitcomb BW, et al. Youden Index and optimal cut-point estimated from observations affected by a lower limit of detection. Biom J 2008;50(3):419–430. [DOI] [PMC free article] [PubMed] [Google Scholar]
- 19. Chang J, Nicolas E, Marks D, et al. miR-122, a mammalian liver-specific microRNA, is processed from hcr mRNA and may downregulate the high affinity cationic amino acid transporter CAT-1. RNA Biol. 2004;1(2):106–113. [DOI] [PubMed] [Google Scholar]
- 20. Chen XM. MicroRNA signatures in liver diseases. World J Gastroenterol. 2009;15(14):1665–1672. [DOI] [PMC free article] [PubMed] [Google Scholar]
- 21. Murakami Y, Yasuda T, Saigo K, et al. Comprehensive analysis of microRNA expression patterns in hepatocellular carcinoma and non-tumorous tissues. Oncogene 2006;25(17):2537–45. [DOI] [PubMed] [Google Scholar]
- 22. Takahashi M, Sung B, Shen Y, et al. Boswellic acid exerts antitumor effects in colorectal cancer cells by modulating expression of the let-7 and miR-200 microRNA family. Carcinogenesis. 2012;33(12):2441–2449. [DOI] [PMC free article] [PubMed] [Google Scholar]
- 23. Sun JY, Huang Y, Li JP, et al. MicroRNA-320a suppresses human colon cancer cell proliferation by directly targeting beta-catenin. Biochem Biophys Res Commun. 2012;420(4):787–792. [DOI] [PubMed] [Google Scholar]
- 24. Nishida N, Yamashita S, Mimori K, et al. MicroRNA-10b is a prognostic indicator in colorectal cancer and confers resistance to the chemotherapeutic agent 5-fluorouracil in colorectal cancer cells. Ann Surg Oncol. 2012;19(9):3065–3071. [DOI] [PubMed] [Google Scholar]
- 25. Pu XX, Huang GL, Guo HQ, et al. Circulating miR-221 directly amplified from plasma is a potential diagnostic and prognostic marker of colorectal cancer and is correlated with p53 expression. J Gastroenterol Hepatol. 2010;25(10):1674–1680. [DOI] [PubMed] [Google Scholar]
- 26. Baffa R, Fassan M, Volinia S, et al. MicroRNA expression profiling of human metastatic cancers identifies cancer gene targets. J Pathol. 2009;219(2):214–221. [DOI] [PubMed] [Google Scholar]
- 27. Kulda V, Pesta M, Topolcan O, et al. Relevance of miR-21 and miR-143 expression in tissue samples of colorectal carcinoma and its liver metastases. Cancer Genet Cytogenet. 2010;200(2):154–160. [DOI] [PubMed] [Google Scholar]
- 28. Lanza G, Ferracin M, Gafa R, et al. mRNA/microRNA gene expression profile in microsatellite unstable colorectal cancer. Mol Cancer. 2007;6:54. [DOI] [PMC free article] [PubMed] [Google Scholar]
- 29. Schimanski CC, Frerichs K, Rahman F, et al. High miR-196a levels promote the oncogenic phenotype of colorectal cancer cells. World J Gastroenterol. 2009;15(17):2089–2096. [DOI] [PMC free article] [PubMed] [Google Scholar]
- 30. Bitarte N, Bandres E, Boni V, et al. MicroRNA-451 is involved in the self-renewal, tumorigenicity, and chemoresistance of colorectal cancer stem cells. Stem Cells. 2011;29(11):1661–1671. [DOI] [PubMed] [Google Scholar]
- 31. Gaedcke J, Grade M, Camps J, et al. The rectal cancer microRNAome--microRNA expression in rectal cancer and matched normal mucosa. Clin Cancer Res. 2012;18(18):4919–4930. [DOI] [PMC free article] [PubMed] [Google Scholar]
- 32. Slattery ML, Wolff E, Hoffman MD, et al. MicroRNAs and colon and rectal cancer: differential expression by tumor location and subtype. Genes Chromosomes Cancer. 2011;50(3):196–206. [DOI] [PMC free article] [PubMed] [Google Scholar]
Associated Data
This section collects any data citations, data availability statements, or supplementary materials included in this article.