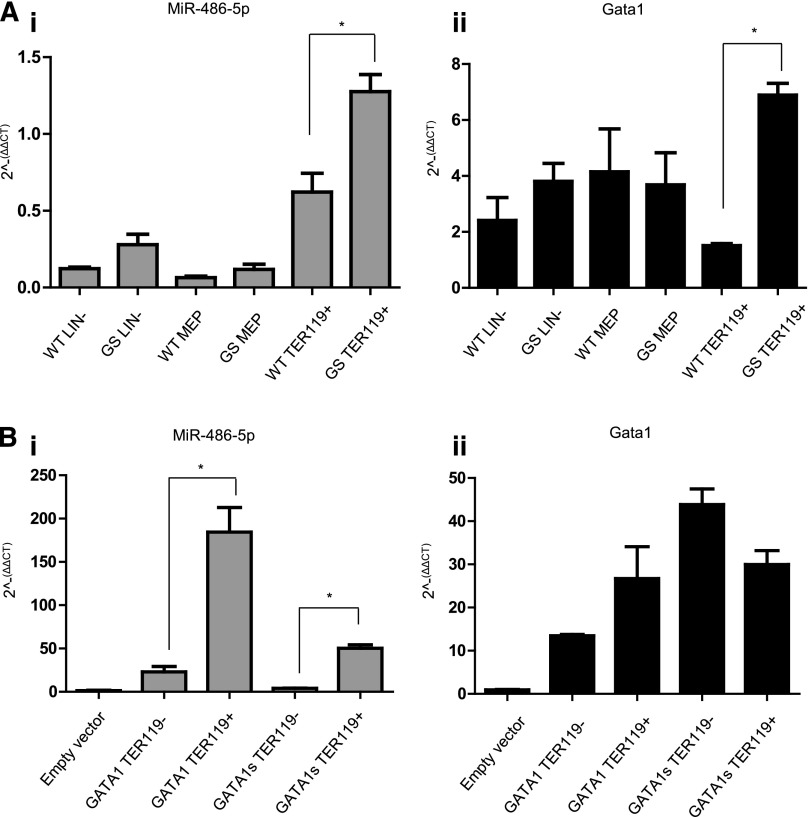
Figure 3.
miR-486-5p expression in the erythroid lin. (A) qRT-PCR analysis of miR-486-5p expression (i) and Gata1 (or Gata1s) expression in different BM cells populations separated by sorting. LIN− = lineage negative cells; MEP = megakaryocytic-erythroid progenitors (Sca1−, c-Kit+, FcRg−, and CD34−); Ter119+ = erythroid cells (Lin+, Ter 119+, and CD41−). Cells from Gata1s KI mice (GS) were compared with cells from Gata1 WT mice (n = 3). *P < .01 (2-tailed Student t test). miR-486-5p expression in megakaryocytic cells (CD41+ and Ter119−) was barely detectable and hence not shown. (B) qRT-PCR analysis of miR-486-5p (i) expression in G1ME cells overexpressing either Gata1s or Gata1. The level of Gata1 isoforms expression is depicted in panel Bii. Cells were grown for 3 days in megakaryocytic-erythroid differentiation medium (containing SCF, TPO, and EPO) and then sorted into TER119+ and TER119− cells. *P < .05 (2-tailed Student t test).

