Abstract
Acute lymphoblastic leukemia is the most common form of pediatric cancer which is categorized into three L1, L2, and L3 and could be detected through screening of blood and bone marrow smears by pathologists. Due to being time-consuming and tediousness of the procedure, a computer-based system is acquired for convenient detection of Acute lymphoblastic leukemia. Microscopic images are acquired from blood and bone marrow smears of patients with Acute lymphoblastic leukemia and normal cases. After applying image preprocessing, cells nuclei are segmented by k-means algorithm. Then geometric and statistical features are extracted from nuclei and finally these cells are classified to cancerous and noncancerous cells by means of support vector machine classifier with 10-fold cross validation. These cells are also classified into their sub-types by multi-Support vector machine classifier. Classifier is evaluated by these parameters: Sensitivity, specificity, and accuracy which values for cancerous and noncancerous cells 98%, 95%, and 97%, respectively. These parameters are also used for evaluation of cell sub-types which values in mean 84.3%, 97.3%, and 95.6%, respectively. The results show that proposed algorithm could achieve an acceptable performance for the diagnosis of Acute lymphoblastic leukemia and its sub-types and can be used as an assistant diagnostic tool for pathologists.
Keywords: Acute lymphoblastic leukemia recognition, hue, saturation, value color space, k-means clustering, multiclass support vector machines classifier, nuclei segmentation
INTRODUCTION
Leukemia is the eleventh most common cancer worldwide with more than 250,000–300,000 new cases each year,[1] and the fifth common cancer among people in Iran.[2] High ratio of deaths/cases (74%) reflects the poor prognosis of leukemia in many parts of the world, where some required complex treatment regimes are not available.[3] It is characterized by proliferation of abnormal white blood cells (leukocytes) in the bone marrow without responding to cell growth inhibitors.[4] Diagnosing leukemia is based on the fact that white blood cell count is increased with immature blast (lymphoblast or myeloblast) cells and decreased neutrophils and platelets. The presence of the excess number of blast cells in peripheral blood is a significant symptom of leukemia.[5]
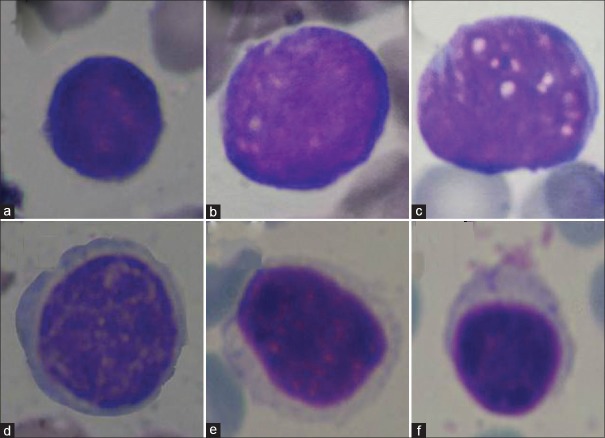
The four main types of leukemia are acute lymphoblastic leukemia (ALL), acute myeloblastic leukemia, chronic lymphocytic leukemia, and chronic myeloblastic leukemia.[6] Among these types, the most commonly detected from the patients are ALL which now generally agreed that both genetic and environmental factors play an interactive role in the development of it,[7] and involves 70% of the leukemia cases each year.[8] In ALL, there is an abnormal and uncontrollable proliferation of lymphoid precursors called lymphoblasts in the bone marrow with arrested maturation.[9] The French-American-British classification categorizes ALL into three morphological subtypes (L1, L2, and L3).[10] The characteristics of these sub-types are as follows: L1 cells are relatively small with coarse chromatin and their nuclei are characterized by a uniform population. L2 cells are characterized by nuclear heterogeneity, and these cells are larger than L1 cells. And finally, L3 cells are characterized by the prominence of vacuoles inside of the cell. Their nuclei are usually homogeneous in population, and larger than L1. Figure 1a–c shows samples of these cells.
Figure 1.
Sample cell images. (a) L1, (b) L2, (c) L3, (d) atypical, (e) reactive, and (f) normal
Early diagnosis of the disease is fundamental for the recovery of patients especially in the case of children.[11] Regardless of advanced techniques, that is, flow cytometer, immunophenotyping, molecular probing etc., microscopic examination of peripheral blood and bone marrow slides still remains as a standard ALL diagnosis technique.[12] Hence, this approach is the most economical way for initial screening of patients. Manual examination of the slides is subjected to bias, that is, operator experience, tiredness etc., resulting with inconsistent and subjective reports. For instance, manual examination has an error rate between 30% and 40% depending on the experience of the hematologist.[13] This procedure is also time-consuming and tedious. Hence, there is always a need for a cost-effective and robust system for ALL screening which can greatly improve the output without being influenced by operator fatigue.
Most of the previously proposed methods followed the traditional manual procedures performed by an expert, that is, segmentation of cell, extracting its features, classifying the cell. Due to the accuracy of the subsequent feature extraction and classification depends on the correct segmentation of blasts, the segmentation step plays an important role. In particular, a considerable amount of work has been performed to achieve cells segmentation. A cell detection method that utilizes both intensity and shape information of the cell to improve the segmentation was proposed by Wang et al.[14] Theera-Umpon,[15] proposes an automatic technique to segment nucleus and cytoplasm of bone marrow white blood cell (WBC) based on the fuzzy C-means algorithm and basic mathematical morphology operations. Madhloom[16] developed an automated system to localize and segment WBC nuclei based on image arithmetical operations and threshold operations. Sinha and Ramakrishnan[17] used k-means clustering on the hue, saturation, value (HSV) color space for WBCs segmentation and different classification models for cell differentiation. A study by Scotti,[18] used a low-pass filter to remove background, different threshold operations, and image clustering to segment WBCs.
Moreover, other authors proposed methods for automated disease classification. In particular, Foran et al.[19] have reported a method to discriminate among lymphoma and leukemia with a classification accuracy of around 83%. The method is reported to have successfully worked on 19 lymphoproliferative cases, which is a very small data set to evaluate the performance of the system. Further, the presented method is yet to be validated on ALL cases.
Comaniciu and Meer[20] proposed an image-guided decision support system for the automated classification of lymphoproliferative disorders. This system includes an effective cell segmentation module based on mean shift algorithm. While this method demonstrates satisfactory performance for the classification of various malignant lymphomas, the system is yet to be tested for acute leukemia.
Markiewicz et al.[21] worked on images of the bone marrow aspirate and proposed a system for automatic recognition of blast cells of the myeloid series. While this method is able to recognize myeloblast up to a certain extent, the system is yet to be tested with sample lymphoblasts.
Theera-Umpon,[22] had used the ANN to classify morphological granulometric features of nucleus in automatic bone marrow white blood cell. In this research, four features extracted from each nucleus were tested using Bayes classifier and artificial neural network. The results showed that the features using nucleus alone can be utilized to achieve a classification rate of 77% on the test sets.
Halim et al.[23] reported an automated blast counting method for acute leukemia detection in blood microscopic images. Histogram-based thresholding is performed on S–component of the HSV color space, followed by morphological erosion for image segmentation. Determination of accurate threshold to separate nucleus from the cytoplasm is important, and no specific methods have been presented for its estimation. Further, the features used as well as a classifier employed for disease recognition have not been mentioned.
Mohapatra[24] investigated the use of an ensemble classifier system for the early diagnosis of ALL in blood microscopic images. The identification and segmentation of WBCs realized through image clustering followed by the extraction of different types of features, such as shape, contour, fractal, texture, color, and Fourier descriptors, from the sub-image. Finally, an ensemble of classifiers is trained to recognize ALL. The results of this method were good, but they were obtained using a proprietary dataset, so the reproducibility of the experiment and comparisons with other methods are not possible.
In this paper, because of existence of a rigorous similarity in morphology of lymphocytes (contain normal, reactive, and atypical) and three sub-types of ALL (L1, L2, and L3), these lymphocytes are also entered into the study as noncancerous cells. These lymphocyte cells have various characteristics. Some of these characteristics are as follows: Normal lymphocytes seen on a blood smear are fairly homogeneous, and they are small, round-to-ovoid-shaped cells with round to oval nuclei. Their nucleus appears dense or coarse and clumped with ridges of chromatin and parachromatin. Reactive lymphocytes are notable due to their remarkable heterogeneity. They are indented by surrounding red cells, and they may have blue skirting. The size of these cells varies from small to moderate. Atypical lymphocytes are large with a nucleus that has clumped chromatin.[25] Figure 1d–f shows samples of these cells.
Detection of ALL cells is the major aim of this study. To achieve this aim, our work is divided into two parts: In the first part, we aim to classify all cells as ALL and noncancerous cells. In the second part, our interest is to categorize all cells into 6 groups; L1, L2, L3, atypical, reactive, and normal, using multi-support vector machine (SVM) classifier. The computer-based system that is proposed in this paper for detecting these cells has five main steps. The first step is image acquisition. The images are captured by a digital camera that is coupled with a light microscope. The second step is image preprocessing. Image enhancement is used as preprocessing on this work, and that is for improving the quality of images. Nucleus segmentation is the third and the most challenging step of this work. Segmentation of nuclei is performed using k-means algorithm on H and S bands of HSV color space. After applying segmentation algorithm on our images, features of nuclei are extracted from the result of segmentation part and because there are a high number of features, some of them are selected as the best features. Feature extraction and feature selection procedures considered as the forth step. Two sets of geometric and statistical features are extracted from nuclei including area, perimeter, solidity, eccentricity and extent as geometric features and entropy, mean, standard deviation, energy, skewness, and kurtosis as statistical features. The final step is the classification of cells. For classification part, SVM classifier is applied. As mentioned before, we first should classify ALL cells and lymphocytes as cancerous and noncancerous cells, respectively. For this approach, a binary SVM classifier is used on our data. After classification of ALL cells, three sub-types of it and three types of lymphocytes are classified using a multiclass SVM classifier.
Rest of the paper is organized as follows: Methods section describes the framework of the proposed method contains introducing all prementioned ALL detection steps. Experimental results and evaluation of proposed algorithm are presented in the results Section. Finally, discussion section provides the concluding remarks.
METHODS
This chapter of the paper presents a systematic survey of the computational steps in ALL detection based on histopathology. These steps are: (1) image acquisition to provide an appropriate data set, (2) image preprocessing to enhance the quality of images, (3) nucleus segmentation to determine nuclei of cells, (4) feature extraction to quantify the properties of these nuclei, and (5) classifying these nuclei as cancerous and noncancerous and then identifying sub-types of these cells.
The proposed method for diagnosis of ALL cells and its sub-types is presented in Figure 2. These steps are described in details in the following sections.
Figure 2.
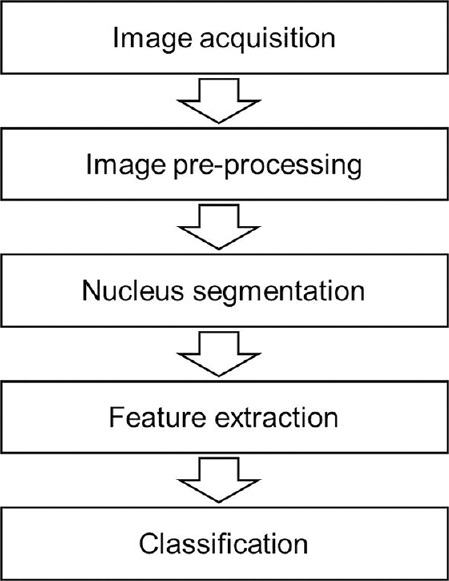
Block diagram of the proposed method
Image Acquisition
The first step is to acquire an image of blood smear and bone marrow slides. For preparing the database of this study, 21 peripheral blood smear and bone marrow slides of 14 patients with ALL and 7 normal persons are used. These slides are collected at Isfahan Al-Zahra and Omid hospital pathology laboratories and prepared and stained using giemsa staining for visualization of cell components. The acquired images were digitized with a Nikon1 V1, high-resolution digital camera coupled to Nikon Eclipse 50i light microscope under 100X power objective oil immersed setting and with an effective magnification of 1000. Furthermore, these images are captured in the JPEG format at the maximum resolution of the camera, 2592 × 3872pixels in RGB color space. The captured images were revised by the hematologist to determine the appropriateness and type of the blood cell. In this research, 312 digital images have been acquired from the sub-types of ALL (L1, L2, L3), normal, reactive and atypical blood samples which contain 958 cells. An expert professor of the Isfahan University of Medical Sciences has classified these cells manually. Our data are comprised of 146 ALL images and 166 lymphocytes images. The data set consists of six classes of white blood cells – L1, L2, L3, normal, reactive, and atypical – with the numbers of 277, 215, 151, 50, 94, and 171 cells, respectively. It should be noted the resolution of the images is reduced by a factor of five to 519 × 775 to speed up performance of the system.
Image Preprocessing
Image enhancement is used as preprocessing on this work. This step is applied for improving the image quality to determine the region of interest such as the nucleus in the images. Exposure of the microscope influences the quality of captured images. Overexposure setting will contribute to producing a bright image; while underexposure setting will produce a dark image.[26]
However, we did a lot of attempts for providing a database with images in the same situation, but it should be mentioned that the database is taken in different time from different slides which are provided by different illumination. This makes the algorithm more reliable to different illumination.
In order to increase the robustness of the approach against fluctuation in illumination, we conduct a histogram equalization procedure on V band in HSV color space. In this section, the enhancement procedure is as follows:
First, the image is converted from RGB color space to HSV color space. This procedure reduces correlation between the color channels (compared to RGB) and enables dealing with three H, S and V channels separately. Therefore, HSV color space is a suitable alternative for image representation, and the color channels are uncorrelated.[27] In HSV, Hue corresponds directly to the concept of hue in the color, Saturation corresponds directly to the concept of tint in the color, and Value corresponds directly to the concept of intensity in the color and matches human perception of lightness while the color information is represented in two components, that is, H and S. Then Histogram equalization is applied on V band for equalizing the gray level of image intensities.
It lessens the effects of different lighting in different image acquisition conditions.[28] And in this way, all images will have approximately the same brightness.
The results of applying this image enhancement on a sample image are shown in Figure 3.
Figure 3.

Result of preprocessing algorithm. (a) Original image. (b) Enhanced image
Nucleus Segmentation
This section discusses the segmentation technique used to extract the nuclei from the blood smear images. Segmentation plays a key role since it will directly affect subsequent processing that is feature extraction and classification. The proposed segmentation algorithm contains two parts; first, cluster of nuclei is obtained by k-means clustering. Then extra objects in this cluster are omitted, and connected nuclei are separated.
The k-means is a clustering method which is one of the most popular unsupervised learning algorithms due to its simplicity. Here, the k-means clustering has been used for image segmentation with parameters: Four clusters, Euclidean distance, and three repetitions. Furthermore, as mentioned in the previous section, the color information is represented in two components, that is, H and S in HSV color space. Each pixel of an object is classified into four clusters based on the corresponding H and S values, using the properties of the cluster center. These clusters correspond to nucleus, background, and other cells (e.g., erythrocytes, plackets and WBC cytoplasm).
Figure 4 shows four classes for a sample image after applying k-means clustering on it. It was observed that nuclei appeared just in one class [Figure 4d].
Figure 4.
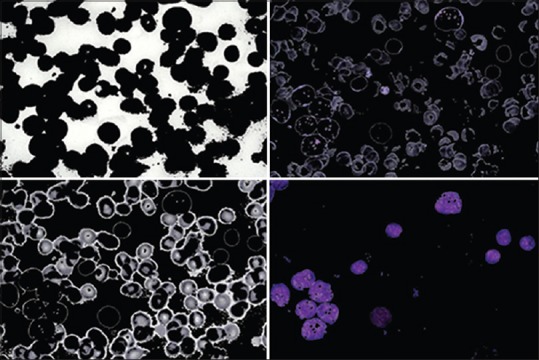
k-means clustering results
We have only considered the cluster which contains nuclei as it is required for feature extraction and hence cell detection. The experimental results show the cluster with the minimum red color is the cluster related to nuclei. Hence, the mean value of R channel is calculated for each cluster and the cluster with a minimum value, is considered as cluster of nuclei.
After specify this cluster, it was observed that in some cases, there are also insignificant particles, which are from nonnuclei stain artifacts and should be removed. The vacuoles region does not exist in some clusters and in fact, we obtained only the nuclei with few left out holes as opposed to the whole nuclei. On the other hand, in some clusters, there are connected nuclei which joined together, while single nuclei are needed for next steps (feature extraction section), so connected nuclei should be separated from each other. For solving these issues, postprocessing procedure is needed.
In postprocessing, first, binary morphological operations are applied on “Nuclei Mask” for deleting stain artifacts and filling holes to improve the segmentation results. Stain artifacts removal are done using the binary morphological opening, and closing operation is performed to fill small holes in the nuclei (which usually occur due to vacuoles within nucleus). Here, selecting the size of the structuring element for morphological operators is important. The size should be smaller than the minimum size of the nucleus that will be determined; all the objects smaller than the structuring element are eliminated. On the other hand, it must be large enough to eliminate the stain artifacts areas. To eliminate the stain artifacts, morphological opening is used to remove the area less than 100 pixels. The elimination number is chosen by trial and error due to this fact that any cancerous or noncancerous cells have a restricted size.
After applying morphological operators for deleting stain artifacts and filling holes in the nuclei, connected nuclei should be separated. In this section, we apply the watershed transform for nuclei splitting. This method is useful to detect the boundary lines between the connected cells,[29,30] and successfully separate all connected nuclei in the image into its individual nuclei.
Figure 5 shows the result of postprocessing on cluster of nuclei. Figure 5a relates to cluster of nuclei, Figure 5b shows “Nuclei Mask”, Figure 5c shows result of applying morphological operators on (b), as can be seen in this figure, stain artifacts are removed and small holes in the nuclei are filled, Figure 5d shows result of applying watershed transform on (c), as can be seen connected nuclei are separated. Figure 5e shows the extracted nuclei on the enhanced image.
Figure 5.
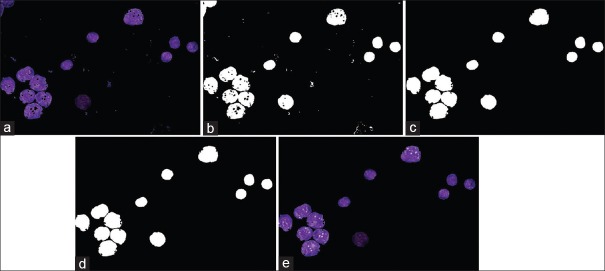
Result of postprocessing on cluster of nuclei. (a) Cluster of nuclei, (b) nuclei Mask, (c) result of morphology, (d) watershed transform, (e) extracted nuclei
Result of postprocessing on cluster of nuclei. (a) cluster of nuclei, (b) nuclei Mask, (c) result of morphology, (d) watershed transform, (e) extracted nuclei.
Feature Extraction
Segmented areas have been used for feature extraction step. The extracted features first, provide useful information for classification of cells into cancerous or noncancerous and second, sub-type of these cells. The final performance of the classifier directly depends on the success of this section. This section contains two steps as follows: First step is “features generation” in which develop a set of features from segmented nuclei. “Features selection” is the second in which find out the optimal set of the features leading to the highest efficiency of the recognition. In the following, we will completely describe these two steps.
Feature generation
The goal of the feature generation step is to develop a set of quantitative features from nuclei present in the image. In order to distinguish between cells, we need proper features from the cells. For this study, two main categories of features have been used for classification of the cells namely the geometric and statistical features. These two main features will provide useful information for further classifying the cancerous or noncancerous cells and types of these cells consist of L1, L2, L3, atypical, reactive, and normal. In brief, the features that are covered with the two main features are described as below:
Geometric Features: That provide information about the size and shape of the nucleus
Statistical Features: That give us information about grayscale image histogram of the pixels located in the nucleus.
These features are explained in the next subsections.
Geometric features
According to hematologists, the geometric of the nucleus is one of the essential features that is used for characterization of the cells. In order to reflect this information in feature vectors, several geometrical features are considered including: Area, perimeter, solidity, eccentricity, and the extent of the nucleus from the binary image of the nucleus.
Statistical features
Statistical features in image processing give us information about the spatial arrangement of intensities in an image. These features are generated from the grayscale image histograms of the red, green, and blue, as well as the hue, saturation, and value channels from original and enhanced image of nucleus and include measures such as: Mean, standard deviation, energy, entropy, skewness, and kurtosis. 72 statistical features have been created by this way.
We can easily measure these features which defined as standard procedures present in the Matlab Image Processing Toolbox.
Feature selection
The described methods of feature generation produce a very rich group of parameters which contain 77 features from each nucleus. However, they are of different discrimination abilities. Some of them are strongly correlated with the others; some treated as noise and reduces in this way the overall efficiency of the recognizing system. Therefore, there is an incentive to reduce the size of the feature set. The important problem is thus assessment of the quality of each feature and selection of the best set of features.
For features selecting in this step, we investigate the individual feature discriminative ability by applying each feature as input data for the classifier and select the features that have the highest performance. For this approach, we obtain 15 features that have the highest sensitivity, specificity, and accuracy separately and then from these features those that have high values together are selected. Table 1 shows the feature numbers and their statistical parameters values. As table results show, 8 of 15 features have high values for all of the statistical parameters together. These features are f55, f56, f58, f61, f62, f64, f73, and f74 that are energy, entropy and standard deviation of hue channel of enhanced image, energy, entropy, and standard deviation of saturation channel of enhanced image, area, and perimeter, respectively.
Table 1.
Ranking the features by means of statistical parameters

After that, these selected features were normalized. The normalization gave a significant contribution to the classification performance. It made the range of the values lie within a predetermined range of [0,1] and this step will positively affect the classifier performance, since some of the features have large values, and without normalization these large values may have an adverse impact on the classifier.[31] The data are normalized to have zero mean and standard deviation equal to 1 using the following equation:

Where X̄ and σ are the mean and standard deviation computed from the values of a feature Xi and X̂l is the normalized value.
Classification
After determining an appropriate set of features from nuclei as mentioned above, the next step is to distinguish these nuclei using these features as the inputs classifier.
The aim of the classification step is (i) to distinguish cancerous or noncancerous cells and (ii) to classify different sub-types of these cells.
Taking into account the fact that the patterns are very close in the feature space, SVM is employed for classification here.[12] SVM is a powerful tool for data classification based on hyperplane classifier. This classification is achieved by a separating surface in the input space of the dataset using different kernel functions as linear or nonlinear such as quadratic, polynomials and radial basis functions (RBF).[32,33]
It should be noted, since in the first step we have 2 classes, we use traditional SVM classifier that in substance is binary classification, and in the second step because of existence of 6 classes, we used multiclass SVM classifier.
For this study, various SVM kernels are used, and their accuracies are compared (polynomial with range: [1,10] and RBF with sigma range: [1,10]). As experiments were conducted to determine which kernel has optimum accurate for classification, we found out RBF kernel with sigma 3 has the best performance.
Furthermore, the k-fold cross validation method with k = 10 is applied for evaluation of the classifier.
RESULT
The results of applying proposed method show satisfactory classification of cells and high values of statistical evaluation parameters. Result of classification in three images is shown in Figure 6.
Figure 6.
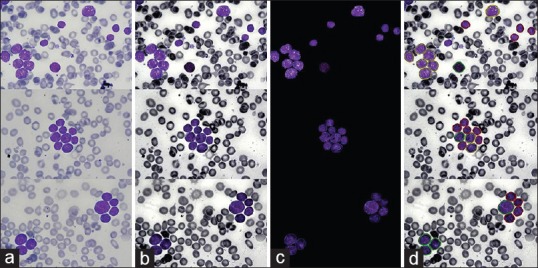
Results of proposed algorithm. (a) Original images, (b) enhanced images, (c) segmented nuclei and (d) classified nuclei. In classified images, nuclei with red, green, and yellow contours, respectively, relate to L1, L2, and L3
Results of the proposed algorithm (a) original images, (b) enhanced images, (c) segmented nuclei, and (d) classified nuclei. In classified images, nuclei with red, green, and yellow contours, respectively, relate to L1, L2, and L3.
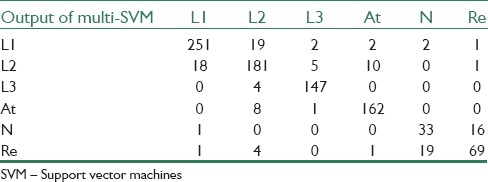
Confusion matrices that are obtained from binary SVM for cancerous and noncancerous cells and Multi-SVM for sub-types of these cells classification can be seen in Tables 2 and 3, respectively.
Table 2.
Cancerous and noncancerous cells versus result of binary SVM classifier

Table 3.
L1, L2, L3, atypical, normal, and reactive cells versus result of multi-SVM classifier
The performance of the classifiers is evaluated by these parameters: Sensitivity, specificity, and accuracy.
Sensitivity is the probability of a positive diagnosis test among persons that have the disease and it is defined as:

Specificity is the probability of a negative diagnosis test among persons that do not have the disease and it is defined as:

Accuracy is a criterion that shows the closeness of the output of the classifier and real value and it is defined as:

In our research, prementioned parameters in the definition of evaluation terms are as below: True positive (cancerous cell correctly identified), false positive (noncancerous cells identified as cancerous), true negatives (noncancerous correctly identified), false negatives (Cancerous cells identified as noncancerous).
The results of the proposed algorithm for binary SVM classifier show 98%, 95%, and 97%, sensitivity, specificity, and accuracy, respectively. And the results of multi-SVM classifier for decision between L1, L2 and L3, atypical, normal, and reactive cells are shown in Table 4.
Table 4.
Multi-SVM classifier results

DISCUSSION
In this paper, a computer-based method for classification of cancerous and noncancerous cells, using only features extracted from the image of their nucleus is proposed.
By referring to the classification results as maintained in “Result” section, it is obvious that although our proposed methods are relatively simple, but this algorithm has an acceptable performance for the diagnosis between ALL as cancerous cells and noncancerous cells as well as distinguishing into three categories of ALL that are L1, L2 and L3, and three types of lymphocytes contain atypical, reactive, and normal cells. Hence, the proposed algorithm can be used as an assistant diagnostic tool for pathologists. Furthermore, the clinical impact of this research is that it will provide the ability to pathologists to examine a blood smear for finding cancerous cells. It should be noted that, as results show, some values of validation parameters are low and this is not surprising because cells that have morphologic similarities and also make pathologists into trouble in diagnosis procedure, play significant role in our classification.
The main contribution of this study is using mentioned methods for detection of sub-types of ALL that is not done before. In addition, pervious manuscripts did not work on ALL sub-types and usually focused on detection of cancerous and noncancerous cells. And this fact can be considered as the work novelty.
It can be considered that one problem we encountered while testing of our method was the absence of publicly available datasets. In fact, many authors tested their system with only a few sample images, or with their own datasets, which are not publicly available. Thus, we could not directly compare our findings with the results obtained by various proposed systems, limiting the reproducibility of the innovations proposed by similar systems. Furthermore, as there is no work on sub-types ALL detection yet, this aim can be considered as the contribution of this study.
For further researches, authors believe that in addition of nucleus, segmentation of cytoplasm and extraction features from it, can improved performance of this computer-based system, and the proposed method can be applied on more amount of data for improving validation. One another work that may improve the procedure can be using of reliable methods like PCA for feature reduction.
BIOGRAPHIES

MortezaMoradi Amin, MS student of Biomedical Engineering in Isfahan University of Medical Sciences, Isfahan, Iran. He received B.Sc. degree inBiomedical Engineering from Departmentof Biomedical Engineering, Islamic Azad University, Science And Research Branch of Tehran, Tehran, Iran. His research interest is Medical ImageAnalysis, especially Microscopic Image Analysis
E-mail: m.moradiamin@gmail.com

Saeed Kermani obtained his BS from the Department of Electrical Engineering of Isfahan University of Technology in Isfahan, Iran, 1987, and he received the MS in Bioelectric Engineering from Sharif University of Technology, in 1992 and his PhD in Bioelectric Engineering at Amirkabir University of Technology, Tehran, Iran, in 2008. He is Assistant Professor of Medical Engineering at the Department of Medical Physics and Medical Engineering in the School of Medicine of Isfahan University of Medical Sciences, Iran. His research interests are in development of biomedical instrument and signal processing techniques.
E-mail: kermani@med.mui.ac.ir

Ardeshir Talebi has a MD degree in pathology. He is associate professor and head of pathology group in Isfahan University of Medical Sciences. His has a consistent corporation with Advanced Medical Technology faculty of Isfahan University of Medical Sciences in microscopic image analysis and has various researches and publishes in this domain.
E-mail: talebi@med.mui.ac.ir

Mostafa Ghelich Oghli, PhD student of Biomedical Engineering in Isfahan University of Medical Sciences, Isfahan, Iran. He received a B.Sc. degree in Biomedical Engineering from Department of Biomedical Engineering, Shahed University, Tehran, Iran, and he received his M.Sc. degree in Biomedical Engineering from Department of Biomedical Engineering, Kermanshah University of Medical Sciences,
Kermanshah, Iran. His research interest is Medical Image Analysis, especially Cardiac MRI Image Analysis and Microscopic Image Analysis.
E-mail: m.g31_mesu@yahoo.com
Footnotes
Source of Support: Nil
Conflict of Interest: None declared
REFERENCES
- 1.Fallah M. Cancer Incidence in Five Provinces of Iran: Ardebil, Gilan, Mazandaran, Golestan and Kerman, 1996-2000. 2007 [Google Scholar]
- 2.Sadjadi A, Nouraie M, Mohagheghi MA, Mousavi-Jarrahi A, Malekezadeh R, Parkin DM. Cancer occurrence in Iran in 2002, an international perspective. Asian Pac J Cancer Prev. 2005;6:359–63. [PubMed] [Google Scholar]
- 3.Parkin DM, Pisani P, Ferlay J. Global cancer statistics. CA Cancer J Clin. 1999;49:33–64. doi: 10.3322/canjclin.49.1.33. [DOI] [PubMed] [Google Scholar]
- 4.Barbara JB. India: Blackwell Publishing Ltd; 2004. A Beginner's Guide to Blood Cells; pp. 64–5. [Google Scholar]
- 5.Haworth C, Heppleston AD, Morris Jones PH, Campbell RH, Evans DI, Palmer MK. Routine bone marrow examination in the management of acute lymphoblastic leukaemia of childhood. J Clin Pathol. 1981;34:483–5. doi: 10.1136/jcp.34.5.483. [DOI] [PMC free article] [PubMed] [Google Scholar]
- 6.Mao JS, Zhao JB, Zhang HJ, Ma YD. St Julians: In Communications, Control and Signal Processing, 2008 ISCCSP 2008 3rd International Symposium on; 2008. A new method for blood cell image segmentation and counting based on PCNN and autowave; pp. 6–9. [Google Scholar]
- 7.Yari F, Sobhani M, Sabaghi F, Zaman-Vaziri M, Bagheri N, Talebian A. Frequencies of HLA-DRB1 in Iranian normal population and in patients with acute lymphoblastic leukemia. Arch Med Res. 2008;39:205–8. doi: 10.1016/j.arcmed.2007.09.009. [DOI] [PubMed] [Google Scholar]
- 8.Ries LAG, Melbert D, Krapcho M, Stinchcomb DG, Howlader N, Horner MJ, et al. U.S. National Institutes of Health, National Cancer Institute. Bethesda, MD; 2008. SEER cancer statistics review, 1975-2005; p. 907. [Google Scholar]
- 9.Sawyers CL, Denny CT, Witte ON. Leukemia and the disruption of normal hematopoiesis. Cell. 1991;64:337–50. doi: 10.1016/0092-8674(91)90643-d. [DOI] [PubMed] [Google Scholar]
- 10.Bain BJ. London: John Wiley and Sons; 2010. Leukaemia Diagnosis. [Google Scholar]
- 11.Scotti F. 2005 IEEE International Conference on Computational Intelligence for Measurement Systems and Applications; 2005. Automatic Morphological Analysis for Acute Leukemia Identification in Peripheral Blood Microscope Images. [Google Scholar]
- 12.Mohapatra S, Patra D. Systems in Medicine and Biology (ICSMB), 2010 International Conference on, IEEE; 2010. Automated Cell Nucleus Segmentation and Acute Leukemia Detection in Blood Microscopic Images. [Google Scholar]
- 13.Reta C, Altamirano L, Gonzalez JA, Diaz R, Guichard J. In FLAIRS Conference; 2010. Segmentation of Bone Marrow Cell Images for Morphological Classification of Acute Leukemia. [Google Scholar]
- 14.Wang M, Zhou X, Li F, Huckins J, King RW, Wong STC. Biomedical Imaging: From Nano to Macro, 2007. ISBI 2007. 4th IEEE International Symposium on; 2007. Novel Cell Segmentation and Online Learning Algorithms for Cell Phase Identification in Automated Time-lapse Microscopy; pp. 65–8. [Google Scholar]
- 15.Theera-Umpon N. Springer: Springer-Verlag Berlin Heidelberg; 2005. White Blood Cell Segmentation and Classification in Microscopic Bone Marrow Images, in Fuzzy Systems and Knowledge Discovery; pp. 787–96. [Google Scholar]
- 16.Madhloom H, Kareem SA, Ariffin H, Zaidan AA, Alanazi HO, Zaidan BB. An automated white blood cell nucleus localization and segmentation using image arithmetic and automatic threshold. J Appl Sci. 2010;10:959–66. [Google Scholar]
- 17.Sinha N, Ramakrishnan AG. Automation of Differential Blood Count. In TENCON 2003. Conference on Convergent Technologies for the Asia-Pacific Region. 2003:547–51. [Google Scholar]
- 18.Scotti F. Instrumentation and Measurement Technology Conference, 2006. IMTC 2006. Proceedings of the IEEE; 2006. Robust Segmentation and Measurements Techniques of White Cells in Blood Microscope Images; pp. 43–8. [Google Scholar]
- 19.Foran DJ, Comaniciu D, Meer P, Goodell LA. Computer-assisted discrimination among malignant lymphomas and leukemia using immunophenotyping, intelligent image repositories, and telemicroscopy. IEEE Trans Inf Technol Biomed. 2000;4:265–73. doi: 10.1109/4233.897058. [DOI] [PubMed] [Google Scholar]
- 20.Comaniciu D, Meer P. Springer: Springer-Verlag London; 2002. Cell Image Segmentation for Diagnostic Pathology, in Advanced Algorithmic Approaches to Medical Image Segmentation; pp. 541–58. [Google Scholar]
- 21.Markiewicz T, Osowski S, Marianska B, Moszczynski L. 2005 IEEE International Joint Conference on; 2005. Automatic Recognition of the Blood Cells of Myelogenous Leukemia using SVM. in Neural Networks, 2005. IJCNN’05 Proceedings; pp. 2496–501. [Google Scholar]
- 22.Theera-Umpon N, Dhompongsa S. Morphological granulometric features of nucleus in automatic bone marrow white blood cell classification. IEEE Trans Inf Technol Biomed. 2007;11:353–9. doi: 10.1109/titb.2007.892694. [DOI] [PubMed] [Google Scholar]
- 23.Halim NH, Mashor MY, Hassan R. Automatic blasts counting for acute leukemia based on blood samples. Int J Res Rev Comput Sci. 2011;2:971. [Google Scholar]
- 24.Mohapatra S, Patra D, Satpathy S. An ensemble classifier system for early diagnosis of acute lymphoblastic leukemia in blood microscopic images. Neural Comput Appl. 2014;24:1887–904. [Google Scholar]
- 25.Blackfan KD, Diamond LK, Leister CM. New York: The Commonwealth Fund; 1994. Atlas of the Blood in Children; p. 320. [Google Scholar]
- 26.Mokhtar N, Harun NH, Mashor MY, Rosline H, Adollah R, Adilah N, et al. london, U.K: Proceedings of the World Congress on Engineering 2009 Vol I WCE 2009, July 1-3; 2009. Image Enhancement Techniques Using Local, Global, Bright, Dark and Partial Contrast Stretching For Acute Leukemia Images. [Google Scholar]
- 27.Abdul Nasir A, Mashor M, Rosline H. Imaging Systems and Techniques (IST), 2011 IEEE International Conference on; 2011. Unsupervised Colour Segmentation of White Blood Cell for Acute Leukaemia Images; pp. 142–5. [Google Scholar]
- 28.Rodenacker K, Bengtsson E. A feature set for cytometry on digitized microscopic images. Anal Cell Pathol. 2003;25:1–36. doi: 10.1155/2003/548678. [DOI] [PMC free article] [PubMed] [Google Scholar]
- 29.Bamford P, Lovell BC. APRS Image Segmentation Workshop; 1996. A Water Immersion Algorithm for Cytological Image Segmentation; pp. 75–9. [Google Scholar]
- 30.Malpica N, de Solórzano CO, Vaquero JJ, Santos A, Vallcorba I, García-Sagredo JM, et al. Applying watershed algorithms to the segmentation of clustered nuclei. Cytometry. 1997;28:289–97. doi: 10.1002/(sici)1097-0320(19970801)28:4<289::aid-cyto3>3.0.co;2-7. [DOI] [PubMed] [Google Scholar]
- 31.Madhloom HT, Kareem PD, Ariffin H. Advanced Computer Science Applications and Technologies (ACSAT), 2012 International Conference on; 2012. A Robust Feature Extraction and Selection Method for the Recognition of Lymphocytes versus Acute Lymphoblastic Leukemia; pp. 330–5. [Google Scholar]
- 32.Smola AJ, Schölkopf B. A tutorial on support vector regression. Stat Comput. 2004;14:199–222. [Google Scholar]
- 33.Gunn SR. Support Vector Machines for Classification and Regression. ISIS Technical Report. 1998 [Google Scholar]


