

Background: Cav1.3 Ca2+ channel is highly expressed in atria and pacemaking cells in the heart.
Results: The C terminus of the Cav1.3 Ca2+ channel can translocate into the nucleus.
Conclusion: The C terminus of Cav1.3 can function as a transcriptional regulator to regulate Ca2+-activated K+ channels.
Significance: New insights into the cross-talk between ion channels may have broad therapeutic ramifications beyond cardiac myocytes.
Keywords: Calcium Channel, Ion Channel, Potassium Channel, Transcription, Transcription Factor
Abstract
Cav1.3 L-type Ca2+ channel is known to be highly expressed in neurons and neuroendocrine cells. However, we have previously demonstrated that the Cav1.3 channel is also expressed in atria and pacemaking cells in the heart. The significance of the tissue-specific expression of the channel is underpinned by our previous demonstration of atrial fibrillation in a Cav1.3 null mutant mouse model. Indeed, a recent study has confirmed the critical roles of Cav1.3 in the human heart (Baig, S. M., Koschak, A., Lieb, A., Gebhart, M., Dafinger, C., Nürnberg, G., Ali, A., Ahmad, I., Sinnegger-Brauns, M. J., Brandt, N., Engel, J., Mangoni, M. E., Farooq, M., Khan, H. U., Nürnberg, P., Striessnig, J., and Bolz, H. J. (2011) Nat. Neurosci. 14, 77–84). These studies suggest that detailed knowledge of Cav1.3 may have broad therapeutic ramifications in the treatment of cardiac arrhythmias. Here, we tested the hypothesis that there is a functional cross-talk between the Cav1.3 channel and a small conductance Ca2+-activated K+ channel (SK2), which we have documented to be highly expressed in human and mouse atrial myocytes. Specifically, we tested the hypothesis that the C terminus of Cav1.3 may translocate to the nucleus where it functions as a transcriptional factor. Here, we reported for the first time that the C terminus of Cav1.3 translocates to the nucleus where it functions as a transcriptional regulator to modulate the function of Ca2+-activated K+ channels in atrial myocytes. Nuclear translocation of the C-terminal domain of Cav1.3 is directly regulated by intracellular Ca2+. Utilizing a Cav1.3 null mutant mouse model, we demonstrate that ablation of Cav1.3 results in a decrease in the protein expression of myosin light chain 2, which interacts and increases the membrane localization of SK2 channels.
Introduction
Cav1.2 (α1C) L-type Ca2+ channel (Cav1.2) represents the main Ca2+ channel isoform in the heart, whereas Cav1.3 (α1D) L-type Ca2+ channel (Cav1.3) is known to be expressed mainly in neurons and neuroendocrine cells. We have previously reported that Cav1.3 is also expressed in atrial myocytes (1). Moreover, Cav1.3 is preferentially expressed in atrial compared with ventricular myocytes. Indeed, the importance of the Cav1.3 isoform is underscored by the findings that Cav1.3 null mutant mice (Cav1.3−/−) show significant alteration in atrial excitability and atrial fibrillation, as well as sinoatrial and atrioventricular node dysfunction (1–5). These observations were surprising, yet insightful as they suggest that detailed knowledge of the different Ca2+ channel isoforms may have broad therapeutic ramifications in the treatment of atrial arrhythmias. Indeed, recent studies have confirmed the expression and critical roles of the Cav1.3 isoform in the human heart (6), and Cav1.3 as a possible link between ankyrin-B mutations and early onset atrial fibrillation in patients (7).
We have previously probed the functional interactions between Ca2+ and Ca2+-activated K+ channels in atrial myocytes. Specifically, several isoforms of small conductance Ca2+-activated K+ channels (SK or KCa2 channels) have been identified that underlie the Ca2+-activated K+ current (IK,Ca) in human and mouse atrial myocytes (8, 9). The SK channels are highly unique in that they are gated solely by changes in intracellular Ca2+ ([Ca2+]i). Similar to Cav1.3, the roles of these SK channels have been extensively investigated in neurons, but their roles in the heart have not been described until recently (8–15). SK channels are also observed to be highly expressed in atrial compared with ventricular tissues, and null mutation of the SK2 channel results in atrial arrhythmias and atrioventricular node dysfunction (11, 12). Moreover, different SK channel isoforms exist in human and mouse cardiac myocytes that can heteromultimerize via the coiled-coil domains in the C termini of the channels (10). Of clinical importance, IK,Ca contributes significantly to the repolarization process in human atria (8). Moreover, a recent study using genome-wide association analysis has provided evidence for a possible genetic link between SK channel polymorphisms and lone atrial fibrillation in humans (16).
To investigate the underlying mechanisms for the increase in atrial arrhythmias in Cav1.3 null mutant mice, the possible functional coupling between Cav1.3 and SK channels was tested (17). As it turns out, Cav1.3 colocalizes with SK2 channels in atrial myocytes. Moreover, the null mutation of Cav1.3 results in a significant decrease in IK,Ca and prolongation in atrial repolarization, which may underlie the increase in atrial arrhythmias (17).
In the present study, we tested the hypothesis that the decrease in IK,Ca in Cav1.3−/− mice may result directly from impaired expression of SK2 channel interacting proteins leading to abnormal membrane localization of the SK2 channel protein in Cav1.3−/− mice. Using a combination of techniques including yeast two-hybrid (Y2H)4 assays, biochemical analyses, immunofluorescence confocal microscopic imaging, microarray analyses, and in vivo siRNA-mediated gene silencing, we report for the first time that the C terminus of Cav1.3 translocates to the nucleus where it functions as a transcription factor to regulate the expression of SK2 channel interacting proteins.
EXPERIMENTAL PROCEDURES
All animal care and procedures were approved by the University of California, Davis, Institutional Animal Care and Use Committee. Animal use was in accordance with the National Institutes of Health and institutional guidelines.
Plasmid Construction
pGBKT7 vector containing the GAL4 binding domain (BD) and pGADKT7 vector containing the GAL4 activation domain (AD) were used for Y2H assays (Clontech, Palo Alto, CA). A bait construct was generated in pGBKT7 vector containing a human cardiac SK2 C-terminal fragment encoding 380–487 amino acid residues (GenBankTM accession number AY258141) (8) and used to screen a human heart cDNA library (MATCHMAKER, Clontech) as previously described (17). The construct was generated using PCR in-frame with the GAL4 BD and subcloned into the pGBKT7 vector. Constructs for the C-terminal domains of Cav1.3 and Cav1.2 Ca2+ channels in pGBKT7 were Cav1.3-Ct, 1505–2203; and Cav1.2-Ct, 1505–2171. The numbers refer to amino acid sequences according to the rat Cav1.3 Ca2+ channel (GenBank accession number D38101) and rabbit cardiac Cav1.2 Ca2+ channel (GenBank accession number X15539), respectively. The cDNA fragments were placed in-frame with the DNA binding domain of GAL4 using polymerase chain reaction (PCR) and subcloned into the pGBKT7 vector. All clones were sequence verified. Rat Cav1.3 (α1D) Ca2+ channel in pCMV6b vector was a kind gift from Dr. S. Seino (Chiba University, Chiba, Japan) and rabbit cardiac Cav1.2 Ca2+ channel was a kind gift from Dr. Timothy Kamp (University of Wisconsin). pEYFP-N1-Cav1.3-ct was generated using the Cav1.3 cDNA fragment encoding 1505–2203 amino acid residues cloned in pEYFP-N1 (Clontech). The numbers refer to amino acid sequences according to the rat Cav1.3 Ca2+ channel (GenBank accession number D38101). Human myosin light chain 2 (MYL2) clone with c-myc tag in pReceiver mammalian expression vector was purchased from GeneCopoeia (catalog number EX-T0572-M09, Rockville, MD).
Antibodies
The following primary antibodies were used: 1) polyclonal anti-SK2 antibodies raised in rabbits against a purified peptide corresponding to amino acid residues 542–559 of the rat SK2 (KCNN2) channel located in the COOH terminus (P0483, Sigma, 1:200 dilution); 2) polyclonal anti-Cav1.3 antibody raised in rabbits against a purified peptide corresponding to amino acid residues 809–825 of the rat brain Cav1.3 Ca2+ channel (C1728, Sigma, 1:200 dilution); 3) polyclonal anti-Cav1.3 antibody raised in goats against a peptide mapping near the carboxyl terminus of human Cav1.3 Ca2+ channel (Santa Cruz, SC-25687, 1:200 dilution); 4) mouse monoclonal anti-glyceraldehyde-3-phosphate dehydrogenase (GAPDH) antibody (MATRK5G4–6C5, RDI, Concord, MA, 1:5000 dilution); 5) rabbit polyclonal anti-myosin light chain antibody (Ab48003, Abcam Inc., Cambridge, MA, 1:200 dilution); 6) mouse monoclonal anti-myosin antibody (light chains 20 kDa, clone MY-21, Sigma, M4401, 1:500 dilution); 7) mouse monoclonal anti-Na+/K+-ATPase antibody was used as a plasma membrane marker (Ab7671, Abcam Inc., 10 μg/ml as recommended by manufacturer); and 8) mouse anti-GFP antibody (11814460001, Roche Applied Science). Of note, this anti-GFP antibody can recognize both wild-type and mutant forms of GFP (GFP variants such as YFP and RFP because the antigen sequence was localized in the conserved region of the GFP variants). We found that this antibody could indeed recognize YFP by observing only one band in YFP-transfected cells (Fig. 4b). 9) Monoclonal anti-Cav1.3 Ca2+ channel (NeuroMab clone L48A/9) directed against amino acids 859–875 in the N terminus of rat Cav1.3, and 10) monoclonal anti-Cav1.3 Ca2+ channel (NeuroMab clone N38/8) directed against amino acids 2025–2161 in the C terminus of rat Cav1.3. The two monoclonal antibodies were obtained from the University of California Davis/National Institutes of Health NeuroMab Facility.
FIGURE 4.

The nuclear localization of the C terminus of Cav1.3 is dependent on [Ca2+]i. a, a schematic diagram of full-length Cav1.3 channel proteins with the conserved domains labeled. Ion_trans: the conserved domain for ion transport (top panel). Lower panel shows a schematic diagram of recombinant fusion proteins for the C terminus of Cav1.3 and YFP (Cav1.3-ct-YFP). b, Western blot analyses of atrial myocytes probed using anti-Cav1.3 antibody against the intracellular loop (Loop Ab) in lanes 1–4 and the nuclear fraction using anti-Cav1.3 antibody against the C-terminal domain (CT Ab) in lane 5. c and d, Cav1.3-ct-YFP fusion protein expressed in tsA 201 cells (c) and neonatal cardiomyocytes. d, shows the pronounced nuclear fluorescence in DMEM (upper panels) or DMEM with 2 mm EGTA (middle panels). Treatment with 100 mm KCl results in a significant decrease in nuclear localization of Cav1.3-ct-YFP (lower panels). e, tsA 201 cells transfected with the pEYFP-N1 control vector show random nuclear and cytoplasmic fluorescence. Nuclei are stained with DAPI. Scale bars are 10 μm. f, representative examples of confocal line scan images of [Ca2+]i transient recordings from spontaneously beating neonatal cardiomyocytes in control, and after 1 h of treatment with 2 mm EGTA or 100 mm KCl. Lower panels show the corresponding [Ca2+]i (measured as F/Fo). g, summary data of the peak amplitude of the ([Ca2+]i transients (peak F/Fo) recorded from the three conditions above (n = 4). Error bars represent S.E., *, p < 0.05. h, confocal laser scanning microscopic Z-stack images of the nuclear localization of the recombinant fusion proteins of the C terminus of Cav1.3 and YFP (Cav1.3-ct-YFP). Images were obtained from the top to the bottom of HEK293 cells expressing the fusion proteins. i, three-dimensional reconstruction of the Z-stack images. Also see the reconstruction of the Z-stack images in supplemental Movies S1 and S2.
The following secondary antibodies were used: 1) anti-mouse or anti-rabbit IgG horseradish peroxidase linked whole antibodies (#NA931V, GE Healthcare); and 2) Alexa Fluor 488 and 633 goat anti-rabbit IgG, and Alexa Fluor 546 goat anti-mouse IgG conjugate (Molecular Probes, Invitrogen, Carlsbad, CA). All secondary antibodies were used at a dilution of 1:400.
Y2H Assays
Y2H assays were performed using the GAL4 system (MATCHMAKER GAL4 Two-hybrid System 3, Clontech) as previously described (17, 18). Both bait and prey constructs in pGBKT7 and pGADKT7 were transfected to the AH109 yeast host strain. None of bait and prey plasmids had detectable autoactivation. For experiments in Fig. 5, pGADKT7 (containing the Gal4 activating domain) was used as a vector transformation marker because both pGBKT7 and pGADKT7 included the nutrition marker for Leu/Trp separately. The reporter genes in our experiments were histidine, adenine prototrophy, and β-galactosidase activity.
FIGURE 5.

The C terminus of Cav1.3 channel activates transcription as assessed by Y2H assays. a, upper panel shows a schematic diagram for the Y2H assays. Lower panels show Y2H assays using high (SD/-Ade/-His/-Leu/-Trp/X-α-gal, left panel) and low (SD/-Leu/-Trp, right panel) stringency media. b, quantification using β-galactosidase activity of yeast cells transfected with pGBKT7-Cav1.3-ct (BD-Cav1.3-ct) or pGBKT7-Cav1.2-ct (containing the C terminus of Cav1.2, BD-Cav1.2-ct). Negative controls were performed using pGADKT7 (AD-vector) and pGBKT7 (BD-vector) only, or pGADKT7-Cav1.3-ct (AD-Cav1.3-ct). pGADKT7-T and pGBKT7 with p53 (AD-T and BD-p53) was used as a positive control. The Y2H assays were repeated independently three times.
For liquid β-galactosidase assays, each fresh culture in the medium appropriate for the system and plasmids was spun, and the pellet was re-suspended in Z buffer (60 mm Na2HPO4, 40 mm NaH2PO4, 10 mm KCl, 1 mm MgSO4, pH 7.0), and then placed in liquid nitrogen for 1 min to freeze the cells and then the cells thawed in a 37 °C water bath for 1 min. The freeze/thaw cycles were repeated twice to ensure that the cells have been cracked open. Cells were spun to pellet the cell debris and the supernatant was transferred to a new microcentrifuge tube with Z buffer containing β-mercaptoethanol. Ortho-Nitrophenyl-β-galactoside (2.5 mg/ml, Sigma) was added to the sample, and the mixture was incubated at 37 °C for 6 h. The absorbance was read at 420 nm and represented the amount of protein present in each sample. For strong enzymatic reactions, diluted yeast lysate was used.
Y2H Screens
Y2H screening was performed with the GAL4 system using a protocol of MATCHMAKER GAL4 Two-hybrid System 3 (Clontech) as previously described (17). AH109 was used as the yeast host strain. A bait construct containing the SK2 C terminus in pGBKT7 vector was used to screen the human heart cDNA library of 3.5 × 10⁶ clones in the pACT2 prey vector (human heart MATCHMAKER cDNA library catalog number HL4042AH). Positive clones were selected by histidine and adenine prototrophy and assayed for α-galactosidase activity. Positive clones were isolated and characterized by sequencing.
Subcellular Fractionation and Western Blotting
Mouse heart tissue was rapidly removed and homogenized with a Dounce homogenizer for 20 up and down strokes with a loose pestle followed by 20 up and down strokes with a tight pestle and then again 10 up and down strokes with the loose pestle in buffer containing 250 mm sucrose, 20 mm HEPES (pH 7.4), 2 mm EGTA, 3 mm sodium azide, and Complete protease inhibitors (Roche Applied Science). The homogenate was centrifuged for 5 min at 700 × g to remove the cell debris. The supernatant was then centrifuged for 60 min at 31,000 × g at 4 °C in a Beckman SW41 rotor. The pellet was resuspended in the homogenization buffer and subjected to ultracentrifugation in a discontinuous sucrose density gradient (32, 40, and 50% (w/v) in 20 mm HEPES-NaOH, pH 7.4) for 2 h at 210,000 × g in Beckman SW41 rotor. The interfaces of the homogenize buffer 32, 32/40, and 40/50% are the plasma membrane fractions, whereas the vesicles and mitochondrial fraction are pelleted at the bottom of tube. Protein concentration was measured by the BCA method (Thermo Fisher Scientific, Rockford, IL) and analyzed by Western blot as described previously (17, 18).
Cav1.3 Null Mutant Mice (Cav1.3−/−)
Generation of Cav1.3 null mutant (Cav1.3−/−) mice has previously been described (19). The null mutant mice were backcrossed onto the C57Bl/6J background for greater than 7 generations. All mice were housed and kept on a 12-h light/dark cycle with food and water available ad libitum. Mice were weaned at 3 weeks and genotyped as previously described (1–3, 19). Experiments were performed using homozygous Cav1.3 null mutant (Cav1.3−/−) mice and wild-type littermates (Cav1.3+/+) (17, 18).
RNA Isolation, RT-PCR, and Oligonucleotide Microarray
Total RNA was isolated using RNeasy Mini Kit (Qiagen, 74104). Reverse transcription-polymerase chain reaction (RT-PCR) was carried out using the SuperScriptTM III first strand synthesis system (Invitrogen, 18080-051). cDNA was used for semi-quantitative RT-PCR analysis with gene-specific primers. The following primers were used for mouse myosin light chain 2 (Myl2 encoding for MLC2): 5′-ATCCAGAGCCAAAAGCTCAGGCTC-3′ (forward), 5′-CTGGAGAGTTCGAGGAGCCTGCTG-3′ (reverse) and for glyceraldehyde-3-phosphate dehydrogenase (GAPDH): 5′-GCAACAGGGTGGTGGACCT-3′ (forward), 5′-GGATAGGGCCTCTCTTGCTCA-3′ (reverse). The mouse GAPDH transcript level was analyzed as the internal control.
RNA target preparation for microarray expression analysis was performed as per the instructions of the GeneChip® 3′ IVT Express Kit and GeneChip Hybridization, Wash, and Stain Kit (Affymetrix Inc., Broderick, CA). RNA was hybridized onto GeneChip mouse genome 430A 2.0 array (Affymetrix Inc.). Expression data were analyzed using dChip (DNA-Chip analyzer) software. Atrial tissues were isolated from three animals each for Cav1.3−/− and WT littermates. A total of 6 samples were hybridized onto 6 different chips. Percentages for P call were 71.5, 71.1, and 69.7 for Cav1.3−/− and 77, 110, and 125 for WT samples. Percentages for the Array Outlier were 0.018, 0.013, and 0.057 for Cav1.3−/− and 0.048, 0.035, and 0.057 for WT samples. Percentages for the Single Outlier were 0.016, 0.014, and 0.058 for Cav1.3−/− and 0.069, 0.008, and 0.012 for WT samples.
Immunofluorescence Confocal Microscopy
Immunofluorescence labeling was performed as described previously (17, 18). Cells were fixed by 4% paraformadehyde in phosphate-buffered saline (PBS) for 30 min at room temperature, washed three times with PBS, treated with 0.4% Triton X-100 in PBS for 15 min, then washed and treated with −20 °C methanol for 10 min. Finally, cells were washed and treated with antibodies. Immunofluorescence-labeled samples were examined using a Pascal Zeiss confocal laser scanning microscopy. For double staining, Alexa Fluor 488-conjugated secondary antibody was excited at 488 nm with an Argon laser and detected with a 505–530-nm band pass filter, whereas Alexa Fluor 546-conjugated secondary antibody was excited at 543 nm with a HeNe1 laser and detected using a 560-nm long pass filter.
For atrial myocytes, which have been transduced with recombinant lentiviral vectors containing shRNA directed against Myl2, cells were immunofluorescence labeled using anti-SK2 (1:100) and anti-MLC2 (1:200) antibodies. Both antibodies were rabbit polyclonal antibodies and were pre-treated with the Zenon Alexa Fluor 555 and 647 rabbit IgG labeling kit (Invitrogen) according to the manufacturer's protocol.
To ascertain that there were no overlaps between the detection, singly labeled cells were imaged under identical conditions as those used for dual-labeled probes to confirm proper signal isolation of each channel. Imaris Bitplane software (Bitplane Scientific Software, Zurich, Switzerland) was used to generate three-dimensional reconstructions of confocal Z-stack images.
Cell Culture and Transfection
To generate primary cardiomyocyte cultures, hearts were dissected from 1–2-day-old mouse pups as previously described (20). Protein and RNA were isolated from the cardiomyocytes at different time points and subjected to analysis by Western blotting, RT-PCR, and immunofluorescence confocal microscopy. Neonatal cardiomyocytes and tsA 201 cells were maintained in Dulbecco's modified Eagle's medium (DMEM) supplemented with 10% fetal bovine serum, 100 units/ml of penicillin, and 100 μg/ml of streptomycin. Cells were maintained at 37 °C in a humidified atmosphere containing 5% CO2. All cell culture reagents were purchased from Invitrogen.
Assessment of [Ca2+]i
Neonatal mouse cardiomyocytes were isolated and cultured for 24 h. Cells were then incubated with the Ca2+ indicator, Fluo 4-AM (10 μm, Invitrogen) for 20 min at room temperature, and washed with DMEM. Three groups of cells were used including 1) cells incubated with DMEM alone for 1 h, 2) cells incubated with DMEM plus 2 mm EGTA for 1 h, and 3) cells incubated with DMEM plus 100 mm KCl for 1 h. Confocal line scan imaging was performed using a LSM 700 Zeiss confocal laser scanning microscope. Images were acquired at sampling rates of 0.7 ms/line and 0.07 μm/pixel, with radial and axial resolutions of 0.4 and 1.0 μm, respectively, as previously described (8, 22). Ca2+ transients were expressed as the normalized local fluorescence (F/Fo), where Fo refers to the fluorescence level before depolarization using OriginPro 7 software (OriginLab Corp., Northampton, MA).
Lentiviral Vectors
Four shRNA directed against Myl2 were subcloned into the Ligase-free shRNA Cloning and Expression vector (pPS-H1-LCS-GFP, System Bioscience, Mountain View, CA) according to the manufacturer's protocol. The shRNA sequences were verified by sequencing.
The sequences for siRNAs directed against Myl2 (Qiagen) used in our study are as follow: Mm_Myl2_1 SI01321467 CACCGGCAATCTTGATTATAA; Mm_Myl2_2 SI01321474 CAGAGACGGCTTCATCGACAA; Mm_Myl2_3 SI01321481 CTCAGACACCATGGCACCAAA; Mm_Myl2_4 SI01321488 CCCAGGGCTGTGCGCAAATAA. The lentivirus was produced using HEK293 cells. The pPS-H1-LCS (2 μg), pMD.G (1 μg), and pCMVD8.9 (4 μg) plasmids were diluted in 750 ml of Opti-MEM (Sigma) separately for 5 min at room temperature. 20 μl of Lipofectamine 2000 (Invitrogen) was diluted in 750 ml of Opti-MEM and incubated for 5 min at room temperature. The plasmids and Lipofectamine were mixed gently and incubated for 20 min at room temperature. HEK293 cells were washed with Opti-MEM without serum and antibiotics before adding the plasmids and incubated for 6 h at 37 °C with 5% CO2. Fresh DMEM with 10% fetal bovine serum and 1% penicillin/streptomycin was added at 6 and 24 h after transfection. The media was collected on day 3, centrifuged at 1500 × g, and the lentivirus was precipitated using PEG-it (System Bioscience) according to the manufacturer's protocol. Transducing HEK293 cells with serial dilutions of the lentivirus was performed to determine the titer of the lentivirus. The concentration was determined using the Ultra-rapid lentiviral global titering Kit (System Bioscience) according to the manufacturer's protocol.
Targeted siRNA-mediated Gene Silencing Using Homogenous Transmural Lentiviral-mediated Atrial Gene Transfer
Homogenous transmural viral-mediated gene transfer in 10-week-old male C57Bl/6J mice was performed using techniques previously described in large animal models (23) and the technique was adapted for gene delivery for mouse atrial tissues as follow. Right thoracotomy was performed to expose the pericardial sac. Solutions used for gene delivery were made by adding 1% trypsin (w/v) to the PBS, chilled to 4 °C, and 20% (w/v) of poloxamer (BASF Corp.) was then added slowly to obtain a total volume of 45 μl (per animal). After the poloxamer had dissolved into the solution, the mixture was warmed to 37 °C to achieve a gel-like consistency. Immediately before use, 30 μl of lentivirus containing siRNA directed against Myl2 were added to the poloxamer/trypsin/PBS solution for a final virus concentration of 2 × 10⁹ pfu/ml to obtain a total volume of 75 μl (per animal). Lentiviral mixture (75 μl) was applied over the epicardial surface of the right atrium using a pipettor and incubated for 15 min before chest closure. Mice were maintained for 14 days when single atrial myocytes were isolated for immunofluorescence confocal microscopy as described above. To directly test the efficiency of lentiviral transduction using the above technique, atrial myocytes were isolated from animals that were transduced using a control lentivirus containing only green fluorescence protein (GFP) as a reporter gene. Atrial myocytes were sorted using fluorescence-activated cell sorting on a Cytomation MoFlo Cell sorter (University of California Davis Optical Biology CORE) to quantify for GFP positive cells compared with sham operated animals that did not receive the lentivirus. Data were acquired using Summit software (Cytomation) and analyzed using FlowJo software (version 9.0.1 Treestar Inc., San Carlos, CA).
Human Embryonic Kidney (HEK) 293 Cells and Plasmids Transfection
HEK293 cells were maintained in Dulbecco's modified Eagle's medium supplemented with 10% fetal bovine serum, 100 units/ml of penicillin, 100 μg/ml of streptomycin. Cell lines were maintained at 37 °C in a humidified atmosphere containing 5% CO2. All cell culture reagents were purchased from Invitrogen. HEK293 cells were transfected using the following plasmid compositions: 1) pSK2-IRES-EGFP alone or in combination with 2) pReceiver-hMLC2-c-Myc (1 μg for each plasmid from GeneCopoeia) using LipofectamineTM 2000 (Invitrogen) according to the manufacturer's protocol.
Patch-Clamp Recordings
Whole cell apamin-sensitive current was recorded from transfected HEK293 cells at room temperature using conventional patch-clamp techniques as previously described (8, 24). Pipette solution contained (in mm): 144 K-gluconate, 1.15 MgCl2, 5 EGTA, 3.95 CaCl2, 10 HEPES (pH 7.25) (free Ca2+ concentration of 500 nm). Bath solution contained (in mm): 140 NMG-Cl, 4 KCl, 1 MgCl2, 5 d-glucose, 10 HEPES (pH 7.4). The pipettes had resistances of 2–3 megohms when filled with the pipette solution. The whole cell apamin-sensitive component was obtained using 100 nmol/liter of apamin. The cell capacitance was calculated by integrating the area under an uncompensated capacitive transient elicited by a 20-mV hyperpolarizing pulse from a holding potential of −40 mV. Whole cell current records were filtered at 2 kHz and sampled at 10 kHz.
RESULTS
Ablation of Cav1.3 Ca2+ Channels in Mouse Atrial Myocytes Results in Abnormal Surface Membrane Localization of SK2 Channels
Our previous work has demonstrated that null deletion of the Cav1.3 channel results in abnormal function of SK2 channels and prolongation of atrial repolarization and atrial arrhythmias (1, 17). To directly determine the molecular mechanisms for abnormal function of SK2 in Cav1.3−/− mice, subcellular distribution of the SK2 channel in isolated mouse atrial myocytes was examined by immunofluorescence confocal microscopy. Surprisingly, the subcellular distribution of SK2 channels in Cav1.3−/− mice (Fig. 1a) was highly abnormal compared with that of WT animals (Fig. 1b) in both single staining using anti-SK2 antibodies and double staining probed by anti-SK2 and anti-α-actinin antibodies. α-Actinin is an F-actin cytoskeletal protein located along the Z-lines in cardiac myocytes. As shown in Fig. 1b, in atrial myocytes isolated from WT mice, the SK2 channel showed the highest staining along the Z-line and co-localized with α-actinin protein, which is consistent with our previously published data (17, 18). In contrast, in Cav1.3−/− mice, SK2 showed a diffuse distribution pattern (Fig. 1a).
FIGURE 1.
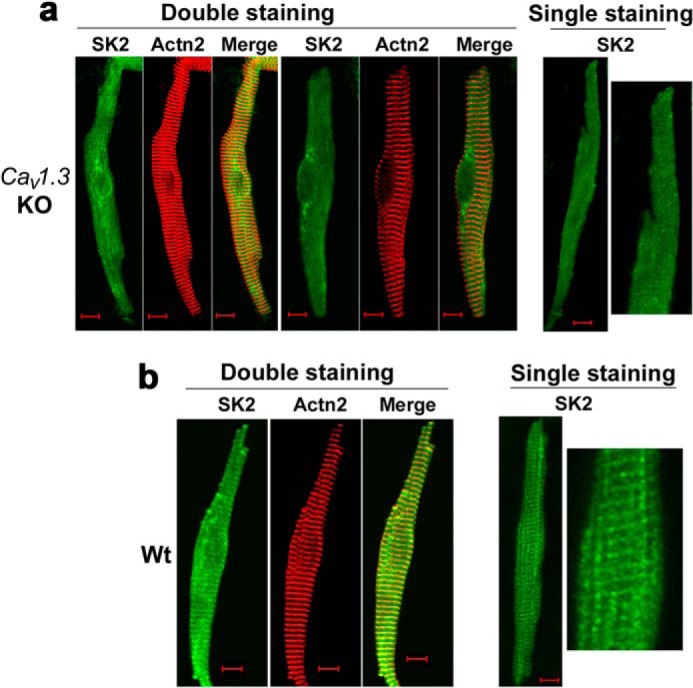
Subcellular localization of SK2 channels was altered in atrial myocytes isolated from homozygous Cav1.3 null mutant mice. The subcellular distribution of SK2 channels in atrial myocytes isolated from Cav1.3−/− mice (KO) (a) as compared with those of the WT animals (b). Anti-SK2 antibodies were used for single staining. The double staining showed SK2 channels and α-actinin2 (Actn2) localization patterns. The right panels in a and b show single staining at higher magnification. Scale bars are 10 μm. Atrial myocytes were obtained from three pairs of Cav1.3−/− mice compared with WT littermates. All experiments were repeated independently three times and consistent data were obtained as shown.
The above findings raised the question whether the expression level of SK2 channels may be altered in Cav1.3−/− mice. To address this, we used western blot analyses to compare the expression level of SK2 channel protein in whole heart lysates from mutant (KO) and WT animals. There were no significant differences in SK2 channel protein expression, suggesting that ablation of the Cav1.3 channel did not affect protein expression of the SK2 channel (Fig. 2, a and b). The abnormal subcellular localization of SK2 channels in atrial myocytes in Cav1.3−/− mice was further assessed using discontinuous sucrose density gradient ultracentrifugation to obtain subcellular fractionation from atrial tissues (Fig. 2c). The purity of the sarcolemmal membrane fractionation was tested and normalized using plasma membrane Na+/K+-ATPase. Notably, the subcellular fractionation revealed limited existence of SK2 channel protein at the plasma membrane in Cav1.3−/− (KO) null mutant mice. Instead, the microsomal fraction (Fig. 2c, lane 5) was found to contain a high density of SK2 channel protein in Cav1.3−/− atrial tissues. In contrast, SK2 channel protein was quite apparent in the plasma membrane fraction, which was confirmed by the presence of plasma membrane Na+/K+-ATPase in WT tissues. This data support the notion that trafficking of the SK2 channel proteins to the plasma membrane may be impaired in Cav1.3−/− mice.
FIGURE 2.

Subcellular distribution of SK2 channel proteins in atrial tissues from Cav1.3−/− (KO) and WT mice. a, Western blot analyses showing similar expression levels of SK2 channel protein in whole atrial tissue lysates isolated from Cav1.3−/− and WT animals. GAPDH was used as a loading control. b, summary data for SK2 protein expression levels normalized to GAPDH. c, abnormal distribution of SK2 channels was observed in Cav1.3−/− mice using a discontinuous sucrose density gradient ultracentrifugation. The purity of membrane fractionation in mouse atrial tissues was tested and normalized by Na,K-ATPase as the plasma membrane marker. Each sample of atrial myocytes was isolated from 5 animals and the experiments were repeated independently three times.
The C Terminus of Cav1.3 (Cav1.3-ct) Is Found in the Nucleus of Cardiac Myocytes
Changes in subcellular distribution of channel proteins can be influenced by a number of factors, such as the production of constituent subunits, the proper assembly of these subunits, the trafficking of assembled proteins to the plasma membrane, and recycling or degradation pathways. To further investigate how the Cav1.3 Ca2+ channel may affect subcellular distribution of the SK2 channel protein, we hypothesize that the Cav1.3 channel may regulate transcription of endogenous genes critical for SK2 channel trafficking. Previous experiments in neurons have suggested that the C terminus of the Cav1.2 channel encodes a transcription factor (25). More recent study further demonstrates that the C terminus of the Cav1.2 channel is produced by activation of a cryptic promoter in exon 46 of CACNA1C, the gene that encodes Cav1.2 (26).
To determine whether the C terminus of the Cav1.3 channel may regulate transcription in cardiac myocytes, we directly tested for possible nuclear localization of Cav1.3 channels using an antibody that recognizes the C terminus of Cav1.3 (amino acids 1661–1990). Interestingly, instead of demonstrating only plasma membrane localization as shown in Fig. 3a, Cav1.3 was also observed to be highly localized in the nucleus in neonatal cardiomyocyte when the C-terminal antibody was used (Fig. 3a, lower panels). In contrast, no nuclear fluorescence was observed when using an antibody recognizing an epitope in the II-III cytoplasmic loop of the CaV1.3 channel (amino acids 859–875, Fig. 3a, upper panels). To provide further evidence that the C terminus of CaV1.3 was highly localized in the nucleus, we isolated nuclei from adult atrial myocytes from WT mice to identify the localization pattern of Cav1.3 by using antibodies recognizing different epitopes (Fig. 3b). Consistently, the C-terminal antibody of the Cav1.3 channel detected a high nuclear fluorescence (lower panels) in contrast to the antibody directed against the II-III cytoplasmic loop (upper panels), suggesting that the C terminus of Cav1.3 was also enriched in nuclei in adult atrial myocytes. Fig. 3c further demonstrated the localization of Cav1.3 along the Z-lines in adult atrial myocytes co-stained with anti-Cav1.3 (loop antibody) and α-actinin2 antibodies. A different set of antibodies directed against the C- (C-term) and N-terminal (N-term) domains were used and similar results were obtained (Fig. 3d). These monoclonal antibodies were obtained from the University of California Davis/National Institutes of Health NeuroMab Facility.
FIGURE 3.
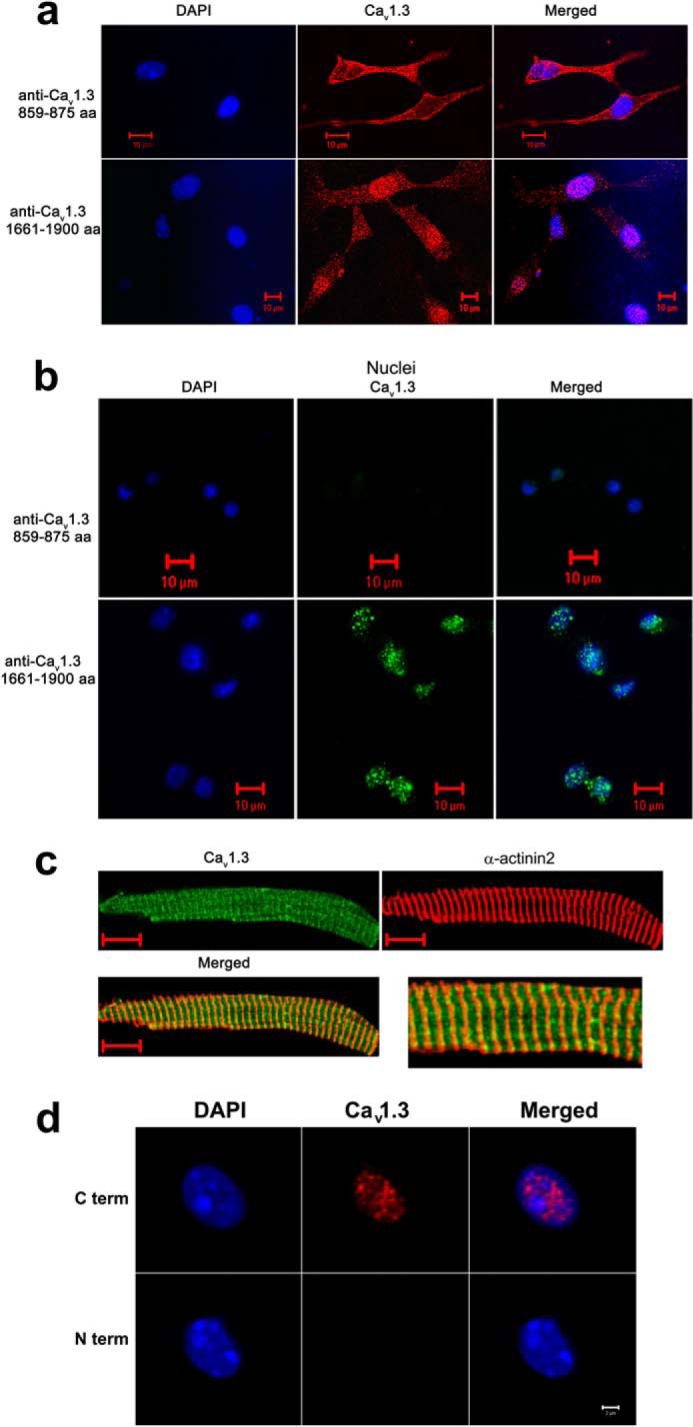
The C terminus of the Cav1.3 channel is localized in the nucleus of cardiac myocytes from wild-type mice. a, immunofluorescence confocal microscopic images of neonatal mouse cardiomyocytes stained using an antibody recognizing an epitope in the II-III cytoplasmic loop of the Cav1.3 channel (amino acids 859–875, loop antibody, upper panels). No detectable nuclear fluorescence is observed. In contrast, a high nuclear fluorescence signal is detected when an antibody that recognizes the C terminus of Cav1.3 (amino acids 1661–1990) is used (lower panels). b, isolated nuclei from adult atrial myocytes. The C-terminal antibody of the Cav1.3 channel detects a high nuclear fluorescence in contrast to the antibody directed against the II-III cytoplasmic loop. Nuclei were stained using DAPI (blue). c, adult atrial myocytes co-stained with anti-Cav1.3 (loop antibody, red) and α-actinin2 (green) antibodies. Scale bars are 10 μm. Right panel shows the merged image at higher magnification. d, isolated nuclei from adult atrial myocytes. Two different monoclonal antibodies for the Cav1.3 Ca2+ channel were used including: 1) anti-Cav1.3 Ca2+ channel (NeuroMab clone L48A/9) directed against amino acids 859–875 in the N terminus of rat Cav1.3, and 2) anti-Cav1.3 Ca2+ channel (NeuroMab clone N38/8) directed against amino acids 2025–2161 in the C terminus of rat Cav1.3. The monoclonal C-terminal antibody of Cav1.3 channel (C term) detects a high nuclear fluorescence in contrast to the monoclonal N-terminal antibody (N term). Nuclei were stained using DAPI (blue). Scale bar is 2 μm. The experiments were repeated independently three times.
To directly rule out the possibility that the observed nuclear staining by C-terminal antibodies was nonspecific, we fused yellow fluorescent protein (YFP) to the C terminus of the Cav1.3 channel (Cav1.3-ct-YFP, Fig. 4, a and b). We observed distinct nuclear fluorescence with prominent punctate patterns when Cav1.3-ct-YFP was transfected in tsA 201 cells (Fig. 4c, top row) and native neonatal cardiomyocytes (Fig. 4d, top row). In comparison, there was a very low YFP signal in the cytosol of the cells. Z-stack images and three-dimensional reconstruction were further obtained to demonstrate the localization of the C-terminal domain within the nuclei of cells (Fig. 4, h and i).
Nuclear Localization of the C Terminus of Cav1.3 Is Dependent on [Ca2+]i
To determine whether nuclear localization of the C terminus of the Cav1.3 channel is regulated by changes in [Ca2+]i, we assessed distribution of Cav1.3-ct-YFP using immunofluorescence confocal microscopy in both tsA 201 cells and neonatal cardiomyocytes following treatment with agents that affect [Ca2+]i levels. Decreasing the free extracellular Ca2+ using 2 mm EGTA for 1 h did not affect nuclear localization of CaV1.3-ct-YFP (Fig. 4, c and d, middle panels). Conversely, treatment with 100 mm KCl for 1 h to increase the activity of Ca2+ channels resulted in a significant decrease in nuclear fluorescence (Fig. 4, c and d, lower panels). The corresponding changes in [Ca2+]i and spontaneous electrical activities after the addition of 2 mm EGTA or 100 mm KCl are depicted using Fluo-4 AM and confocal line scan imaging (Fig. 4f). A control experiment is shown in Fig. 4e in tsA 201 cells transfected with the pEYFP-N1 control vector illustrating diffuse nuclear and cytoplasmic fluorescence.
The C Terminus of Cav1.3 (Cav1.3-ct) Activates Transcription as Assessed by Y2H
To investigate whether Cav1.3-ct can activate transcription when recruited to a promoter by a heterologous DNA binding domain, we constructed an N-terminal fusion of CaV1.3-ct with the Gal4-DNA binding domain from yeast (pGBKT7-Cav1.3-ct, Fig. 5a). The GAL4-DNA binding domain recognizes the UAS-DNA sequence but requires a transcriptional activation domain to activate transcription (pGADKT7). We introduced pGBKT7-Cav1.3-ct into yeast cells along with three reporter genes (histidine, adenine prototrophy, and α-galactosidase activity). All reporter genes could be activated. Thus, the yeasts transfected by pGBKT7-CaV1.3-ct showed a robust growth in high stringency medium (Fig. 5a, left panel, second sector). pGBKT7-Cav1.3-ct could significantly activate transcription compared with GAL4 alone or channel lacking the GAL4-DNA binding domain. Taken together, these results suggest that the C terminus of Cav1.3 may be produced as a soluble protein in cells and translocates to the nucleus where it activates transcription when recruited to promoters of the genes. In comparison, we generated another construct including the N-terminal fusion of CaV1.3-ct with the GAL4-activation domain (pGADKT7-CaV1.3-ct). The GAL4-DNA-activation domain could activate transcription but requires a DNA binding domain to recognize the UAS-DNA sequence to activate transcription. Consequently, none of the reporter genes could be activated (Fig. 5a, left panel, third sector). Quantification data obtained using β-galactosidase activity further support the results of Y2H assays (Fig. 5b), suggesting that the C terminus of Cav1.3 can act as a transcription factor. Similar data were obtained using the C terminus of Cav1.2 (Fig. 5b). Nonetheless, the findings using the Y2H assay are only suggestive and additional experiments were performed as detailed below to further test the roles of Cav1.3 C-terminal domain as transcriptional regulators.
Differential Transcript Expression in Atria from Cav1.3−/− Compared with WT Littermates
To further test whether Cav1.3 may regulate transcription of endogenous genes in vivo, we used microarray expression analysis to identify differences in transcript expression levels between Cav1.3−/− and WT littermates (Fig. 6). Using three independent atrial tissues from each group, we observed 24 transcripts that were up-regulated more than 2-fold (p < 0.005) and 11 transcripts that were up-regulated 3 or more than 3-fold (p < 0.005) in Cav1.3−/− compared with WT littermates. Among the up-regulated mRNAs, several were related to immunoglobulin. Furthermore, there were 12 transcripts that were down-regulated more than 3-fold (p < 0.005) in Cav1.3−/− compared with WT animals. Among the down-regulated mRNAs, three were related to myosin light chain (MLC, 10 different transcripts are shown in Fig. 6). To verify the results of the microarray analyses, semi-quantitative RT-PCR was performed (Fig. 7a). The mRNA expression of Myl2 encoding for MLC2 was significantly decreased in Cav1.3−/− mice, in accordance with the results from microarray analyses (n = 3). Furthermore, we measured MLC2 protein levels by western blot analysis. Consistently, the MLC2 protein level was reduced significantly in Cav1.3−/− atrial myocytes compared with that of WT littermates (Fig. 7b). Taken together, the findings are consistent with possible transcriptional regulation of the Myl2 gene by Cav1.3 channels.
FIGURE 6.

Differential transcript expression in atria of Cav1.3−/− compared with WT littermates. A list of mRNAs identified in microarray experiments that were up- or down-regulated more than 3-fold comparing atrial tissues isolated Cav1.3−/− to WT animals. Three pair of Cav1.3−/− and WT animals were used for microarray analyses.
FIGURE 7.

The normal expression of MLC2 is required for proper membrane localization of SK2 channels. a, expression of mRNAs of Myl2 was significantly decreased in Cav1.3−/− (KO) compared with WT mice (A, atria). b, Western blot analysis showing a significant decrease in MLC2 protein in Cav1.3−/− mice compared with WT animals (n = 3 animals for each group were used for Western blot analyses). c, MLC2 interacted directly with the SK2 channel as assessed using Y2H assays. d, left panels show the SK2 staining pattern in atrial myocytes treated with control siRNA. Right panels: treatment of atrial myocytes with siRNA specific to MLC2 resulted in a significant decrease in MLC2 expression. Moreover, there was a significant decrease in SK2 membrane expression. Lower panels compare the SK2 staining of the regions outlined in white boxes at higher magnification. A total of three animals were used for each group. e, apamin-sensitive currents recorded from HEK293 cells transfected with human SK2 channel alone compared with SK2 channel co-expressed with hMLC2. Data from non-transfected cells are shown in the lower left panel. Right lower panel compared the current density in pA/pF of apamin-sensitive currents. A total of 6 cells were performed for each group with similar results. f, a schematic model illustrating the C terminus of Cav1.3 as a transcriptional regulator for MLC2 expression. MLC2 physically interacts with SK2 channels and facilitates the targeting of SK2 channels to the plasma membrane. SK2 channels are shown to interact with filamin A (FLNA) and α-actinin2 (Actn2) cytoskeletal proteins via the N and C termini, respectively. CaMBD refers to calmodulin binding domain within the C terminus of SK2 channels.
C Terminus of SK2 Channel Directly Interact with MLC2 Using Y2H Assays
The data so far suggest that Cav1.3 may affect trafficking of the SK2 channel even though ablation of Cav1.3 did not significantly alter the expression level of the SK2 protein. We hypothesize that abnormal subcellular localization of the SK2 channel protein in Cav1.3−/− mice may be a direct result of the impaired expression of MLC2. To directly test this hypothesis, we assessed whether MLC2 interacted with the SK2 channel. A bait construct was generated in pGBKT7 plasmid containing GAL4-DNA BD using human cardiac SK2 C-terminal domain (Fig. 7c, upper panel). The bait construct was used to screen the human heart cDNA library (MATCHMAKER, Clontech). Consequently, three different independent positive clones (C2, C4, and C24) were found to belong to Myl2. None of the bait and prey plasmids had detectable autoactivation. To further confirm this interaction, we switched the C4 clone, which contains full-length Myl2 cDNA, to pGBKT7-BD vector and moved SK2-C1 to the pGADKT7-AD vector, and obtained a strong interaction between SK2-C1 and MLC2 showing a similar white color phenotype to the positive colonies of pGADT7-T with p53, suggesting that SK2 physically interacts with MLC2 in Y2H assays (Fig. 7c, lower panels).
Targeted siRNA-mediated Gene Silencing by Homogenous Transmural Atrial Gene Transfer
To directly test the roles of MLC2 in atrial myocytes, we used the previously published technique of homogenous transmural atrial gene transfer in large animal models (23) for gene delivery to mouse atrial tissues as described (22). Single atrial myocytes were isolated 48 h after in vivo viral transduction.
Normal Expression of MLC2 Is Required for Membrane Localization of SK2 Channels
Treatment of atrial myocytes with MLC2-specific siRNAs resulted in a significant decrease in MLC2 expression. Moreover, knockdown of MLC2 resulted in an abnormal localization of SK2 channels with a complete lack of staining along the Z line (Fig. 7d, right panels) compared with the normal SK2 staining pattern in Fig. 7d, left panels. The staining pattern of MLC2 in control atrial myocytes was shown in the left panel illustrating subcellular localization of MLC2 (Fig. 7d). Of note, because both anti-SK2 and anti-MLC2 antibodies were rabbit polyclonal antibodies. Both antibodies were pre-treated with the Zenon Alexa Fluor 555 and 647 rabbit IgG labeling kit (Invitrogen) in Fig. 7d. The differences in the techniques used may result in a slight discrepancy in the intensity of SK2 staining between Figs. 7d and 1a when Cav1.3 was ablated.
Co-expression of MLC2 Increases the Functional Expression of SK2 Channel
Finally, we performed patch-clamp recordings of apamin-sensitive currents in HEK293 cells expressing the SK2 channel alone compared with SK2 co-expressed with MLC2 (Fig. 7e). There was a significant increase in apamin-sensitive currents in cells co-expressing SK2 and MLC2 consistent with the notion that MLC2 facilitates and increases membrane localization of SK2 channels.
Fig. 8A shows a schematic representation of the recombinant lentiviral constructs containing GFP as the reporter gene and four shRNA directed against MLC2 (LV-MLC2) and scrambled sequence (LV-Scramble). We further demonstrated the successful isolation of GFP-positive atrial myocytes in Fig. 8B using fluorescence-activated cell sorting (FACS). Isotype-matched antibodies were used to control for background fluorescence (FL) and is shown in the left panel labeled as Background FL compared with the Cell-Specific FL shown in the right panel.
FIGURE 8.
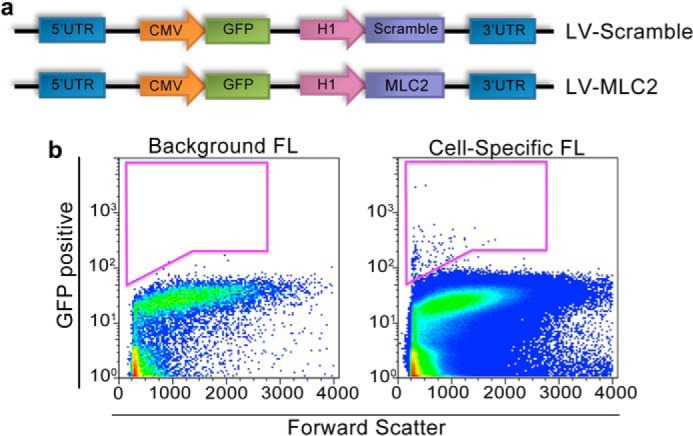
Targeted siRNA-mediated gene silencing by homogenous transmural atrial gene transfer. a, schematic representation of the recombinant lentiviral constructs containing green fluorescence protein (GFP) as the reporter gene and four shRNA directed against MLC2 (LV-MLC2) and scrambled sequence (LV-Scramble). b, isolation of GFP-positive atrial myocytes using fluorescence-activated cell sorting. Isotype-matched antibodies were used to control for background fluorescence (FL) and is shown in the left panel labeled Background FL compared with the Cell-Specific FL shown in the right panel.
Taken together, our data suggests that the C-terminal domain of the Cav1.3 channel acts as a transcriptional regulator for Myl2 expression. MLC2 protein physically interacts with SK2 channels and facilitates the membrane localization of SK2 channels. A schematic is shown in Fig. 7f.
DISCUSSION
Ablation of CaV1.3 Results in a Decreased Expression of MLC2 and Abnormal Surface Membrane Localization of SK2 Channels
We have previously demonstrated the molecular coupling between Cav1.3 and SK2 channels in cardiac myocytes (17). Moreover, null deletion of Cav1.3 results in a significant decrease in IK,Ca in atrial myocytes leading to prolongation of repolarization and atrial arrhythmias (17). Indeed, we have previously shown that direct protein-protein interaction between SK2 channels and two different cytoskeletal proteins, α-actinin2 and filamin A, is required for the surface membrane localization of the SK2 channels (18, 27). Specifically, we demonstrate that filamin A (FLNA) and α-actinin2 (Actn2) directly interact with the N and C termini of SK2 channels, respectively (18, 27) (Fig. 7f). Here, using a combination of techniques including biochemical analyses, Y2H assays, and confocal imaging, we directly tested the mechanisms underlying the observed functional cross-talk between Cav1.3 and SK2 channels. We demonstrate that the C terminus of the Cav1.3 Ca2+ channel can be found to be localized in the nucleus and acts as a transcription factor in atrial myocytes. Our data further suggest that nuclear translocation of the C-terminal domain of Cav1.3 Ca2+ channels is directly regulated by [Ca2+]i. Finally, using microarray analyses and siRNA-mediated gene silencing, we provide new insights into the underlying mechanisms for the observed functional coupling between Cav1.3 and SK2 channels. Cav1.3 directly regulates the expression of MLC2, which interacts with and aids in surface membrane localization of SK2 channels.
Diversity and Complexity of Voltage-gated Ca2+ Channels
Voltage-gated Ca2+ channels are complexes of a pore-forming transmembrane spanning the α1 subunit of about 190–250 kDa, a disulfide-linked complex of α2 and δ subunits, and an intracellular β subunit and γ subunit (28). Mammalian α1 subunits are encoded by at least 10 distinct genes (29). Classically, voltage-gated Ca2+ channels have been classified, according to their electrophysiological and pharmacological properties, into five essential groups, termed T (Cav3.1 (α1G), Cav3.2 (α1H) or Cav3.3 (α1I) subunits); L (Cav1.2 or Cav1.3 subunits); N (Cav2.2 (α1B) subunit); P/Q (Cav2.1 (α1A) subunit); and R (Cav2.3 (α1E) subunit) (30–33). Association with different auxiliary subunits further influences Ca2+ channel gating, yielding a remarkable diversity of functionally distinct molecular species of Ca2+ channels.
L-type Ca2+ channels are highly expressed in skeletal and cardiac muscle, where they play important roles in excitation-contraction coupling. Several laboratories as well as ours have documented expression of the Cav1.3 Ca2+ channel, in addition to the Cav1.2 isoform in pacemaking tissues and atria (2, 4, 5, 34). Physiologically, the Cav1.3 channel is less sensitive to dihydropyridines compared with the Cav1.2 channel. Moreover, the Cav1.3 channel exhibits a low threshold of activation compared with the Cav1.2 isoform (35–37). This distinct biophysical feature of Cav1.3 may contribute to its role in pacemaking activities in sinoatrial and atrioventricular nodes.
The C Terminus of Cav1.2 Ca2+ Channel Encodes a Transcription Factor
[Ca2+]i is tightly regulated and plays critical roles in multiple cellular processes including synaptic transmission, cell division, differentiation, and contraction. Moreover, previous studies have demonstrated the involvement of voltage-gated Ca2+ channels in the regulation of gene expression (38–40). Ca2+ influx through L-type Ca2+ channels can activate transcription factors such as cAMP-response element-binding protein, MEF, and NFAT (41–43). Two possible mechanisms that have been proposed include activation of nuclear Ca2+-dependent enzymes (44) and activation of Ca2+-dependent factors around the inner pore of the Ca2+ channel with propagation of the signal to the nucleus (39).
More recent studies have provided evidence for a new mechanism whereby the C terminus of Cav1.2 can directly enter the nucleus and act as a transcriptional regulator (25). The C-terminal domain of Cav1.2 has been shown to autoregulate Cav1.2 expression in cardiac myocytes (45). Previous studies have documented that L-type Ca2+ channels may be cleaved at their C terminus and the C-terminal domain can bind to the truncated channel to exert its inhibitory effect on the channel function (46, 47). In addition to Cav1.1 and Cav1.2, previous studies have reported that C-terminal domains of Cav1.3 (48), Cav2.1 (49), and Cav2.2 (50) may be cleaved in neurons. The cleaved product of Cav2.1 has been shown to be localized in the nucleus of neurons (51) suggesting that other members of Cav may also act as transcriptional regulators in different tissues. On the other hand, one recent study demonstrates that the C terminus of the Cav1.2 channel is produced by activation of a cryptic promoter in exon 46 of CACNA1C, the gene that encodes Cav1.2 and does not represent the cleaved product (26). Additional studies will need to be conducted to determine the mechanisms for generation of the Cav1.3 C-terminal domain as well as domains within the C terminus that are required for the observed nuclear translocation.
We have provided intriguing data that translocation of the Cav1.3 C terminus is inversely dependent on [Ca2+]i. Additional evidence is provided that the interventions used in our experiments altered the spontaneous firing frequency and [Ca2+]i. These findings are somewhat unexpected. An increase in [Ca2+]i would be predicted to lead to a mechanism, which would abbreviate the APD to avoid Ca2+ overload. However, our data suggest that the C terminus translocates from the nucleus when [Ca]i is high, which would be predicted to lead to a decrease in membrane expression of SK2 channels. On the other hand, the findings likely represent one of the many factors that are altered by an increase in [Ca2+]i. Additional studies are needed to further decipher additional genes regulated by the C terminus of Cav1.3.
SK Channels
SK channels are encoded by at least three distinct genes, KCNN1, KCNN2, and KCNN3 (52–54). The channels have been described in a wide range of tissues (55, 56). Pharmacologically, SK channels can be distinguished by their sensitivity toward the bee venom apamin (57, 58). SK channels are highly unique in that they are gated solely by [Ca2+]i. The Ca2+-binding protein calmodulin (CaM) binds to the SK channel through the CaM-binding domain (CaMBD), which is located in an intracellular region of the α subunit immediately carboxyl-terminal to the pore (21).
Physiological Significance
Recent data from our laboratory as well as others have provided evidence for critical roles of both the Cav1.3 Ca2+ channel (1–5) and SK channels in hearts (8, 9, 13–15, 17, 18). Both channels are highly expressed in atrial myocytes and pacemaking tissues. Because SK channels are gated solely by changes in [Ca2+]i, the channels are predicted to play critical roles in pathological conditions in which there is a significant increase in [Ca2+]i, for example, during heart failure (15) or atrial fibrillation, leading to a decrease in the refractory period. The data presented here support a novel mechanism for the additional cross-talk between Cav1.3 and SK channels. Indeed, Ca2+ channels are not only required for activation of the SK channels. Cav1.3 may influence membrane localization of the SK channels via transcriptional regulation of SK channel interacting proteins, which are required for the proper trafficking of the SK channels.
Future Studies
Data in Fig. 6 provide evidence for differential transcript expression in Cav1.3 null mutant mice compared with WT littermates, however, the findings do not directly demonstrate transcriptional regulation. Future studies are required to test direct regulation of the Myl2 gene by the C terminus of Cav1.3.
This work was supported, in whole or in part, by National Institutes of Health Grants R01 HL85727 and R01 HL85844, and Veterans Affairs Merit Review Grant I01 BX000576 (to N. C.), National Institutes of Health Grants R01 HL077281 and HL079071 (to A. K.), National Institutes of Health Grants R01 DC003826, R01 DC007592, and R01 DC010386 (to E. Y.), National Institutes of Health Grant R01 HL85844S1 (to R. L. W.), a Howard Hughes Medical Institute Med-into-Grad Training Program to the University of California Davis and an American Heart Association Western States Affiliate Predoctoral Fellowship Award (to P. S.), American Heart Association Western States Affiliate Beginning Grant-in-Aid 14BGIA18870087 (to X. D. Z.), and Calcium Signaling Chinese Grant NSFC81330035 (to L. L.).

This article contains supplemental Movies S1 and S2.
- Y2H
- yeast two-hybrid
- BD
- binding domain
- AD
- activation domain
- IK,Ca
- Ca2+-activated K+ current
- MLC2
- myosin light chain 2
- SK channels
- small conductance Ca2+-activated K+ channels.
REFERENCES
- 1. Zhang Z., He Y., Tuteja D., Xu D., Timofeyev V., Zhang Q., Glatter K. A., Xu Y., Shin H. S., Low R., Chiamvimonvat N. (2005) Functional roles of Cav1.3 (α1D) calcium channels in atria: insights gained from gene-targeted null mutant mice. Circulation 112, 1936–1944 [DOI] [PubMed] [Google Scholar]
- 2. Zhang Z., Xu Y., Song H., Rodriguez J., Tuteja D., Namkung Y., Shin H. S., Chiamvimonvat N. (2002) Functional roles of Cav1.3 (α1D) calcium channel in sinoatrial nodes: insight gained using gene-targeted null mutant mice. Circ. Res. 90, 981–987 [DOI] [PubMed] [Google Scholar]
- 3. Zhang Q., Timofeyev V., Qiu H., Lu L., Li N., Singapuri A., Torado C. L., Shin H. S., Chiamvimonvat N. (2011) Expression and roles of Cav1.3 (α1D) L-type Ca2+ Channel in atrioventricular node automaticity. J. Mol. Cell. Cardiol. 50, 194–202 [DOI] [PMC free article] [PubMed] [Google Scholar]
- 4. Platzer J., Engel J., Schrott-Fischer A., Stephan K., Bova S., Chen H., Zheng H., Striessnig J. (2000) Congenital deafness and sinoatrial node dysfunction in mice lacking class D L-type Ca2+ channels. Cell 102, 89–97 [DOI] [PubMed] [Google Scholar]
- 5. Mangoni M. E., Couette B., Bourinet E., Platzer J., Reimer D., Striessnig J., Nargeot J. (2003) Functional role of L-type Cav1.3 Ca2+ channels in cardiac pacemaker activity. Proc. Natl. Acad. Sci. U.S.A. 100, 5543–5548 [DOI] [PMC free article] [PubMed] [Google Scholar]
- 6. Baig S. M., Koschak A., Lieb A., Gebhart M., Dafinger C., Nürnberg G., Ali A., Ahmad I., Sinnegger-Brauns M. J., Brandt N., Engel J., Mangoni M. E., Farooq M., Khan H. U., Nürnberg P., Striessnig J., Bolz H. J. (2011) Loss of Cav1.3 (CACNA1D) function in a human channelopathy with bradycardia and congenital deafness. Nat. Neurosci. 14, 77–84 [DOI] [PubMed] [Google Scholar]
- 7. Cunha S. R., Hund T. J., Hashemi S., Voigt N., Li N., Wright P., Koval O., Li J., Gudmundsson H., Gumina R. J., Karck M., Schott J. J., Probst V., Le Marec H., Anderson M. E., Dobrev D., Wehrens X. H., Mohler P. J. (2011) Defects in ankyrin-based membrane protein targeting pathways underlie atrial fibrillation. Circulation 124, 1212–1222 [DOI] [PMC free article] [PubMed] [Google Scholar]
- 8. Xu Y., Tuteja D., Zhang Z., Xu D., Zhang Y., Rodriguez J., Nie L., Tuxson H. R., Young J. N., Glatter K. A., Vázquez A. E., Yamoah E. N., Chiamvimonvat N. (2003) Molecular identification and functional roles of a Ca2+-activated K+ channel in human and mouse hearts. J. Biol. Chem. 278, 49085–49094 [DOI] [PubMed] [Google Scholar]
- 9. Tuteja D., Xu D., Timofeyev V., Lu L., Sharma D., Zhang Z., Xu Y., Nie L., Vázquez A. E., Young J. N., Glatter K. A., Chiamvimonvat N. (2005) Differential expression of small-conductance Ca2+-activated K+ channels SK1, SK2, and SK3 in mouse atrial and ventricular myocytes. Am. J. Physiol. Heart Circ. Physiol. 289, H2714–H2723 [DOI] [PubMed] [Google Scholar]
- 10. Tuteja D., Rafizadeh S., Timofeyev V., Wang S., Zhang Z., Li N., Mateo R. K., Singapuri A., Young J. N., Knowlton A. A., Chiamvimonvat N. (2010) Cardiac small conductance Ca2+-activated K+ channel subunits form heteromultimers via the coiled-coil domains in the C termini of the channels. Circ. Res. 107, 851–859 [DOI] [PMC free article] [PubMed] [Google Scholar]
- 11. Li N., Timofeyev V., Tuteja D., Xu D., Lu L., Zhang Q., Zhang Z., Singapuri A., Albert T. R., Rajagopal A. V., Bond C. T., Periasamy M., Adelman J., Chiamvimonvat N. (2009) Ablation of a Ca2+-activated K+ channel (SK2 channel) results in action potential prolongation in atrial myocytes and atrial fibrillation. J. Physiol. 587, 1087–1100 [DOI] [PMC free article] [PubMed] [Google Scholar]
- 12. Zhang Q., Timofeyev V., Lu L., Li N., Singapuri A., Long M. K., Bond C. T., Adelman J. P., Chiamvimonvat N. (2008) Functional roles of a Ca2+-activated K+ channel in atrioventricular nodes. Circ. Res. 102, 465–471 [DOI] [PMC free article] [PubMed] [Google Scholar]
- 13. Ozgen N., Dun W., Sosunov E. A., Anyukhovsky E. P., Hirose M., Duffy H. S., Boyden P. A., Rosen M. R. (2007) Early electrical remodeling in rabbit pulmonary vein results from trafficking of intracellular SK2 channels to membrane sites. Cardiovasc. Res. 75, 758–769 [DOI] [PMC free article] [PubMed] [Google Scholar]
- 14. Diness J. G., Sørensen U. S., Nissen J. D., Al-Shahib B., Jespersen T., Grunnet M., Hansen R. S. (2010) Inhibition of small-conductance Ca2+-activated K+ channels terminates and protects against atrial fibrillation. Circ. Arrhythm Electrophysiol. 3, 380–390 [DOI] [PubMed] [Google Scholar]
- 15. Chua S. K., Chang P. C., Maruyama M., Turker I., Shinohara T., Shen M. J., Chen Z., Shen C., Rubart-von der Lohe M., Lopshire J. C., Ogawa M., Weiss J. N., Lin S. F., Ai T., Chen P. S. (2011) Small-conductance calcium-activated potassium channel and recurrent ventricular fibrillation in failing rabbit ventricles. Circ. Res. 108, 971–979 [DOI] [PMC free article] [PubMed] [Google Scholar]
- 16. Ellinor P. T., Lunetta K. L., Glazer N. L., Pfeufer A., Alonso A., Chung M. K., Sinner M. F., de Bakker P. I., Mueller M., Lubitz S. A., Fox E., Darbar D., Smith N. L., Smith J. D., Schnabel R. B., Soliman E. Z., Rice K. M., Van Wagoner D. R., Beckmann B. M., van Noord C., Wang K., Ehret G. B., Rotter J. I., Hazen S. L., Steinbeck G., Smith A. V., Launer L. J., Harris T. B., Makino S., Nelis M., Milan D. J., Perz S., Esko T., Köttgen A., Moebus S., Newton-Cheh C., Li M., Möhlenkamp S., Wang T. J., Kao W. H., Vasan R. S., Nöthen M. M., MacRae C. A., Stricker B. H., Hofman A., Uitterlinden A. G., Levy D., Boerwinkle E., Metspalu A., Topol E. J., Chakravarti A., Gudnason V., Psaty B. M., Roden D. M., Meitinger T., Wichmann H. E., Witteman J. C., Barnard J., Arking D. E., Benjamin E. J., Heckbert S. R., Kaab S. (2010) Common variants in KCNN3 are associated with lone atrial fibrillation. Nat. Genet. 42, 240–244 [DOI] [PMC free article] [PubMed] [Google Scholar]
- 17. Lu L., Zhang Q., Timofeyev V., Zhang Z., Young J. N., Shin H. S., Knowlton A. A., Chiamvimonvat N. (2007) Molecular coupling of a Ca2+-activated K+ channel to L-type Ca2+ channels via α-actinin2. Circ. Res. 100, 112–120 [DOI] [PubMed] [Google Scholar]
- 18. Lu L., Timofeyev V., Li N., Rafizadeh S., Singapuri A., Harris T. R., Chiamvimonvat N. (2009) α-Actinin2 cytoskeletal protein is required for the functional membrane localization of a Ca2+-activated K+ channel (SK2 channel). Proc. Natl. Acad. Sci. U.S.A. 106, 18402–18407 [DOI] [PMC free article] [PubMed] [Google Scholar]
- 19. Namkung Y., Skrypnyk N., Jeong M. J., Lee T., Lee M. S., Kim H. L., Chin H., Suh P. G., Kim S. S., Shin H. S. (2001) Requirement for the L-type Ca2+ channel α(1D) subunit in postnatal pancreatic beta cell generation. J. Clin. Invest. 108, 1015–1022 [DOI] [PMC free article] [PubMed] [Google Scholar]
- 20. Xu Y., Zhang Z., Timofeyev V., Sharma D., Xu D., Tuteja D., Dong P. H., Ahmmed G. U., Ji Y., Shull G. E., Periasamy M., Chiamvimonvat N. (2005) The effects of intracellular Ca2+ on cardiac K+ channel expression and activity: novel insights from genetically altered mice. J. Physiol. 562, 745–758 [DOI] [PMC free article] [PubMed] [Google Scholar]
- 21. Keen J. E., Khawaled R., Farrens D. L., Neelands T., Rivard A., Bond C. T., Janowsky A., Fakler B., Adelman J. P., Maylie J. (1999) Domains responsible for constitutive and Ca2+-dependent interactions between calmodulin and small conductance Ca2+-activated potassium channels. J. Neurosci. 19, 8830–8838 [DOI] [PMC free article] [PubMed] [Google Scholar]
- 22. Sirish P., López J. E., Li N., Wong A., Timofeyev V., Young J. N., Majdi M., Li R. A., Chen H. S., Chiamvimonvat N. (2012) MicroRNA profiling predicts a variance in the proliferative potential of cardiac progenitor cells derived from neonatal and adult murine hearts. J. Mol. Cell Cardiol. 52, 264–272 [DOI] [PMC free article] [PubMed] [Google Scholar]
- 23. Kikuchi K., McDonald A. D., Sasano T., Donahue J. K. (2005) Targeted modification of atrial electrophysiology by homogeneous transmural atrial gene transfer. Circulation 111, 264–270 [DOI] [PubMed] [Google Scholar]
- 24. Hamill O. P., Marty A., Neher E., Sakmann B., Sigworth F. J. (1981) Improved patch-clamp techniques for high-resolution current recording from cells and cell-free membrane patches. Pflugers Arch. 391, 85–100 [DOI] [PubMed] [Google Scholar]
- 25. Gomez-Ospina N., Tsuruta F., Barreto-Chang O., Hu L., Dolmetsch R. (2006) The C terminus of the L-type voltage-gated calcium channel CaV1.2 encodes a transcription factor. Cell 127, 591–606 [DOI] [PMC free article] [PubMed] [Google Scholar]
- 26. Gomez-Ospina N., Panagiotakos G., Portmann T., Pasca S. P., Rabah D., Budzillo A., Kinet J. P., Dolmetsch R. E. (2013) A promoter in the coding region of the calcium channel gene CACNA1C generates the transcription factor CCAT. PLoS One 8, e60526. [DOI] [PMC free article] [PubMed] [Google Scholar]
- 27. Rafizadeh S., Zhang Z., Woltz R. L., Kim H. J., Myers R. E., Lu L., Tuteja D., Singapuri A., Bigdeli A. A., Harchache S. B., Knowlton A. A., Yarov-Yarovoy V., Yamoah E. N., Chiamvimonvat N. (2014) Functional interaction with filamin A and intracellular Ca2+ enhance the surface membrane expression of a small-conductance Ca2+-activated K+ (SK2) channel. Proc. Natl. Acad. Sci. U.S.A. 111, 9989–9994 [DOI] [PMC free article] [PubMed] [Google Scholar]
- 28. Walker D., De Waard M. (1998) Subunit interaction sites in voltage-dependent Ca2+ channels: role in channel function. Trends Neurosci. 21, 148–154 [DOI] [PubMed] [Google Scholar]
- 29. Ertel E. A., Campbell K. P., Harpold M. M., Hofmann F., Mori Y., Perez-Reyes E., Schwartz A., Snutch T. P., Tanabe T., Birnbaumer L., Tsien R. W., Catterall W. A. (2000) Nomenclature of voltage-gated calcium channels. Neuron 25, 533–535 [DOI] [PubMed] [Google Scholar]
- 30. Ellinor P. T., Zhang J. F., Randall A. D., Zhou M., Schwarz T. L., Tsien R. W., Horne W. A. (1993) Functional expression of a rapidly inactivating neuronal calcium channel. Nature 363, 455–458 [DOI] [PubMed] [Google Scholar]
- 31. Fox A. P., Nowycky M. C., Tsien R. W. (1987) Kinetic and pharmacological properties distinguishing three types of calcium currents in chick sensory neurones. J. Physiol. 394, 149–172 [DOI] [PMC free article] [PubMed] [Google Scholar]
- 32. Usowicz M. M., Sugimori M., Cherksey B., Llinás R. (1992) P-type calcium channels in the somata and dendrites of adult cerebellar Purkinje cells. Neuron 9, 1185–1199 [DOI] [PubMed] [Google Scholar]
- 33. Miller R. J. (1992) Voltage-sensitive Ca2+ channels. J. Biol. Chem. 267, 1403–1406 [PubMed] [Google Scholar]
- 34. Takimoto K., Li D., Nerbonne J. M., Levitan E. S. (1997) Distribution, splicing and glucocorticoid-induced expression of cardiac α1C and α1D voltage-gated Ca2+ channel mRNAs. J. Mol. Cell. Cardiol. 29, 3035–3042 [DOI] [PubMed] [Google Scholar]
- 35. Koschak A., Reimer D., Huber I., Grabner M., Glossmann H., Engel J., Striessnig J. (2001) α1D (Cav1.3) subunits can form L-type Ca2+ channels activating at negative voltages. J. Biol. Chem. 276, 22100–22106 [DOI] [PubMed] [Google Scholar]
- 36. Lipscombe D., Helton T. D., Xu W. (2004) L-type calcium channels: the low down. J. Neurophysiol. 92, 2633–2641 [DOI] [PubMed] [Google Scholar]
- 37. Olson P. A., Tkatch T., Hernandez-Lopez S., Ulrich S., Ilijic E., Mugnaini E., Zhang H., Bezprozvanny I., Surmeier D. J. (2005) G-protein-coupled receptor modulation of striatal CaV1.3 L-type Ca2+ channels is dependent on a Shank-binding domain. J. Neurosci. 25, 1050–1062 [DOI] [PMC free article] [PubMed] [Google Scholar]
- 38. Dolmetsch R. (2003) Excitation-transcription coupling: signaling by ion channels to the nucleus. Sci STKE 2003, PE4. [DOI] [PubMed] [Google Scholar]
- 39. Dolmetsch R. E., Pajvani U., Fife K., Spotts J. M., Greenberg M. E. (2001) Signaling to the nucleus by an L-type calcium channel-calmodulin complex through the MAP kinase pathway. Science 294, 333–339 [DOI] [PubMed] [Google Scholar]
- 40. West A. E., Chen W. G., Dalva M. B., Dolmetsch R. E., Kornhauser J. M., Shaywitz A. J., Takasu M. A., Tao X., Greenberg M. E. (2001) Calcium regulation of neuronal gene expression. Proc. Natl. Acad. Sci. U.S.A. 98, 11024–11031 [DOI] [PMC free article] [PubMed] [Google Scholar]
- 41. Graef I. A., Mermelstein P. G., Stankunas K., Neilson J. R., Deisseroth K., Tsien R. W., Crabtree G. R. (1999) L-type calcium channels and GSK-3 regulate the activity of NF-ATc4 in hippocampal neurons. Nature 401, 703–708 [DOI] [PubMed] [Google Scholar]
- 42. Mao Z., Bonni A., Xia F., Nadal-Vicens M., Greenberg M. E. (1999) Neuronal activity-dependent cell survival mediated by transcription factor MEF2. Science 286, 785–790 [DOI] [PubMed] [Google Scholar]
- 43. Sheng M., McFadden G., Greenberg M. E. (1990) Membrane depolarization and calcium induce c-fos transcription via phosphorylation of transcription factor CREB. Neuron 4, 571–582 [DOI] [PubMed] [Google Scholar]
- 44. Hardingham G. E., Arnold F. J., Bading H. (2001) Nuclear calcium signaling controls CREB-mediated gene expression triggered by synaptic activity. Nat. Neurosci. 4, 261–267 [DOI] [PubMed] [Google Scholar]
- 45. Schroder E., Byse M., Satin J. (2009) L-type calcium channel C terminus autoregulates transcription. Circ. Res. 104, 1373–1381 [DOI] [PMC free article] [PubMed] [Google Scholar]
- 46. Hulme J. T., Konoki K., Lin T. W., Gritsenko M. A., Camp D. G., 2nd, Bigelow D. J., Catterall W. A. (2005) Sites of proteolytic processing and noncovalent association of the distal C-terminal domain of CaV1.1 channels in skeletal muscle. Proc. Natl. Acad. Sci. U.S.A. 102, 5274–5279 [DOI] [PMC free article] [PubMed] [Google Scholar]
- 47. Hulme J. T., Yarov-Yarovoy V., Lin T. W., Scheuer T., Catterall W. A. (2006) Autoinhibitory control of the CaV1.2 channel by its proteolytically processed distal C-terminal domain. J. Physiol. 576, 87–102 [DOI] [PMC free article] [PubMed] [Google Scholar]
- 48. Hell J. W., Westenbroek R. E., Warner C., Ahlijanian M. K., Prystay W., Gilbert M. M., Snutch T. P., Catterall W. A. (1993) Identification and differential subcellular localization of the neuronal class C and class D L-type calcium channel α1 subunits. J. Cell Biol. 123, 949–962 [DOI] [PMC free article] [PubMed] [Google Scholar]
- 49. Kubodera T., Yokota T., Ohwada K., Ishikawa K., Miura H., Matsuoka T., Mizusawa H. (2003) Proteolytic cleavage and cellular toxicity of the human α1A calcium channel in spinocerebellar ataxia type 6. Neurosci. Lett. 341, 74–78 [DOI] [PubMed] [Google Scholar]
- 50. Westenbroek R. E., Hell J. W., Warner C., Dubel S. J., Snutch T. P., Catterall W. A. (1992) Biochemical properties and subcellular distribution of an N-type calcium channel α1 subunit. Neuron 9, 1099–1115 [DOI] [PubMed] [Google Scholar]
- 51. Kordasiewicz H. B., Thompson R. M., Clark H. B., Gomez C. M. (2006) C-termini of P/Q-type Ca2+ channel α1A subunits translocate to nuclei and promote polyglutamine-mediated toxicity. Hum. Mol. Genet. 15, 1587–1599 [DOI] [PubMed] [Google Scholar]
- 52. Köhler M., Hirschberg B., Bond C. T., Kinzie J. M., Marrion N. V., Maylie J., Adelman J. P. (1996) Small-conductance, calcium-activated potassium channels from mammalian brain. Science 273, 1709–1714 [DOI] [PubMed] [Google Scholar]
- 53. Shmukler B. E., Bond C. T., Wilhelm S., Bruening-Wright A., Maylie J., Adelman J. P., Alper S. L. (2001) Structure and complex transcription pattern of the mouse SK1 K(Ca) channel gene, KCNN1. Biochim. Biophys. Acta 1518, 36–46 [DOI] [PubMed] [Google Scholar]
- 54. Stocker M., Pedarzani P. (2000) Differential distribution of three Ca2+-activated K+ channel subunits, SK1, SK2, and SK3, in the adult rat central nervous system. Mol. Cell. Neurosci. 15, 476–493 [DOI] [PubMed] [Google Scholar]
- 55. Vergara C., Latorre R., Marrion N. V., Adelman J. P. (1998) Calcium-activated potassium channels. Curr. Opin. Neurobiol. 8, 321–329 [DOI] [PubMed] [Google Scholar]
- 56. Rimini R., Rimland J. M., Terstappen G. C. (2000) Quantitative expression analysis of the small conductance calcium-activated potassium channels, SK1, SK2 and SK3, in human brain. Brain Res. Mol. Brain Res. 85, 218–220 [DOI] [PubMed] [Google Scholar]
- 57. Ishii T. M., Maylie J., Adelman J. P. (1997) Determinants of apamin and d-tubocurarine block in SK potassium channels. J. Biol. Chem. 272, 23195–23200 [DOI] [PubMed] [Google Scholar]
- 58. Strøbaek D., Jørgensen T. D., Christophersen P., Ahring P. K., Olesen S. P. (2000) Pharmacological characterization of small-conductance Ca2+-activated K+ channels stably expressed in HEK 293 cells. Br. J. Pharmacol. 129, 991–999 [DOI] [PMC free article] [PubMed] [Google Scholar]