

Background: Cytochrome P450 reductase (CPR) is an electron donor for many proteins.
Results: The FMN binding domain (FBD) of CPR interacts with cytochrome c transiently and reduces cytochrome c at a higher rate than CPR.
Conclusion: A three-dimensional structural model of the FBD-cyt c complex is presented.
Significance: The findings give insights into the domain motions and the function of CPR.
Keywords: Cytochrome c, Cytochrome P450, Electron Transfer Complex, Enzyme Kinetics, Nuclear Magnetic Resonance (NMR), Protein Structure, Protein-Protein Interaction
Abstract
Cytochrome P450 reductase (CPR) is a diflavin enzyme that transfers electrons to many protein partners. Electron transfer from CPR to cyt c has been extensively used as a model reaction to assess the redox activity of CPR. CPR is composed of multiple domains, among which the FMN binding domain (FBD) is the direct electron donor to cyt c. Here, electron transfer and complex formation between FBD and cyt c are investigated. Electron transfer from FBD to cyt c occurs at distinct rates that are dependent on the redox states of FBD. When compared with full-length CPR, FBD reduces cyt c at a higher rate in both the semiquinone and hydroquinone states. The NMR titration experiments reveal the formation of dynamic complexes between FBD and cyt c on a fast exchange time scale. Chemical shift mapping identified residues of FBD involved in the binding interface with cyt c, most of which are located in proximity to the solvent-exposed edge of the FMN cofactor along with other residues distributed around the surface of FBD. The structural model of the FBD-cyt c complex indicates two possible orientations of complex formation. The major complex structure shows a salt bridge formation between Glu-213/Glu-214 of FBD and Lys-87 of cyt c, which may be essential for the formation of the complex, and a predicted electron transfer pathway mediated by Lys-13 of cyt c. The findings provide insights into the function of CPR and CPR-cyt c interaction on a structural basis.
Introduction
Cytochrome P450 reductase (CPR)2 is a diflavin protein that donates electrons to a variety of microsomal cytochromes P450 (1), heme oxygenase (2), cytochrome b5 (3), cytochrome c (4), as well as therapeutic prodrugs (5). It plays an indispensable role in the function of the cytochrome P450 monooxygenase system, which is responsible for the metabolism of a myriad of endogenous compounds, including vitamins, steroids and hormones, as well as exogenous compounds, including environmental toxins and drugs (6). CPR is an ∼78-kDa membrane-bound protein composed of four distinct domains as follows: the N-terminal transmembrane segment, the FMN binding domain (FBD), the connecting domain, and the FAD/NADPH binding domain (7). It shuttles electrons from its physiological reductant NADPH, via the FAD and FMN cofactors, to its acceptor proteins, such as cytochromes P450. Ultimately, electrons are donated by the FBD to the acceptor proteins.
CPR was first isolated and identified as an NADPH-dependent cytochrome c reductase in the 1950s (8). In later studies, the true physiological redox partner of CPR was revealed to be cytochrome P450 (cyt P450) after a successful achievement of hydroxylase activity from a reconstitution system composed of cytochrome P450, CPR, and phospholipids (9). Cyt c, an important mitochondrial protein in the electron transport chain, is unlikely to be a physiological redox partner of CPR, which was found to be localized to the endoplasmic reticulum (4). Nevertheless, the redox reaction between CPR and cyt c continued to be widely used as a standard model to characterize the redox properties and activities of CPR due to the simplicity to carry out the reaction (10–14). Interaction and complex formation between CPR and cyt c have been investigated by various methods, including cross-linking (15, 16) and site-directed mutagenesis studies (13, 14, 17). It has been proposed that charge-pairing between the negatively charged CPR and the positively charged cyt c contributes greatly to the formation of the complex. For example, methylamidation of the carboxyl groups on CPR leads to strong inhibition of cyt c reduction (18), and it decreases the maximum rate of the reaction (16). An increase in ionic strength also causes disruption in complex formation and electron transfer between CPR and cyt c due to the masking effect on the charged residues (13). In particular, a cluster of acidic residues Glu-213–Glu-214–Asp-215 on the N terminus of helix α7 of CPR is potentially located on the CPR-cyt c complex interface, as suggested by site-directed mutagenesis studies (14, 17). It has also been shown that Lys-13 of cyt c can be cross-linked to one of the carboxyl groups from the two acidic clusters on CPR, Asp-207–Asp-208–Asp-209 and Glu-213–Glu-214–Asp-215 (15). However, antibody binding studies revealed that the antibody designed to bind to the segment from Gly-204 to Gly-218 of CPR was not able to abrogate the CPR-cyt c interaction (19). Mutation of another acidic cluster, including Asp-113, Glu-115, and Glu-116 on the β2-α4 coil of CPR, improves its cyt c reducing activity, facilitating the formation of a more functional complex (13). With conflicting reports present in the literature, a high resolution mapping of the binding interface of CPR and cyt c is necessary to gain better insight into the interaction and electron transfer between the two proteins. Despite the recent success in obtaining the x-ray crystal structure of the putidaredoxin-cytochrome P450 camphor complex (20, 21), the nature of weak interactions between electron transfer proteins generally makes the complexes difficult to crystallize; meanwhile, the solution NMR techniques have been well developed to investigate such transient complexes, including cyt b5-cyt P450 (22), myoglobin-cyt b5 (23), cyt b5-cyt c (24), cyt c-cyt c peroxidase (25), and cyt P450cam-putidaredoxin (20). Therefore, in our study we utilize solution NMR techniques to probe the interaction between CPR and cyt c, which can allow us to identify residues on the binding interface and further predict electron transfer pathway between the two proteins.
CPR-mediated electron transfer from NADPH to cyt c is highly orchestrated between intraprotein electron transfer (from NADPH to FAD and from FAD to FMN) and interprotein electron transfer (from FMN to heme in cyt c). Internal electron transfer from NADPH to FAD is regulated through the side chain movement of Trp-676 in human CPR (26), and interflavin electron transfer has been suggested to be gated by interdomain movements between FBD and the rest of the reductase (7, 27). Interprotein electron transfer between FMN and heme in cyt c depends on the association and interaction between the FBD and cyt c. To simplify the electron transfer process and focus our study on the interprotein interaction, we decided to investigate the electron transfer and complex formation between the isolated FMN binding domain, which is the direct electron donor to cyt c.
In this study, we characterize the kinetics of electron transfer from FBD of CPR to cyt c and compare with that from the full-length CPR to cyt c, demonstrating the gating effect of conformational changes of CPR on interprotein electron transfer. Using solution NMR techniques in combination with molecular docking, we map the binding interface on FBD and propose a structural model of the FBD-cyt c complex. The NMR results imply the formation of a dynamic complex and reveal the primary binding site on FBD. The structural models generated by high ambiguity driven biomolecular docking (HADDOCK) based on NMR restraints suggest potential electron transfer pathways that provide strong electronic coupling between the redox centers.
EXPERIMENTAL PROCEDURES
Materials
Escherichia coli C41 cells for protein overexpression were purchased from Lucigen (Middleton, MI). Yeast extract, tryptone for unlabeled growth media were purchased from Sigma. [15N]Ammonium chloride for M9 medium and D2O were purchased from Cambridge Isotope Laboratories (Andover, MA). N-[4-(7-Diethylamino-4-methyl-3-coumarinyl)phenyl]maleimide (CPM) was purchased from Sigma. Dimethyl sulfoxide was purchased from Alfa Aesar. Horse heart cyt c, resins, buffer components, and all other chemicals were purchased from Sigma. The glycerol used in NMR experiments was purchased from Roche Applied Science.
Expression and Purification of Full-length and the FMN Binding Domain of Rat CPR
The 15N-labeled FMN binding domain (residues 1–239) (FBD) was expressed and purified from E. coli C41 cells. The E. coli C41 cells were transformed with a pSC-rat CPR plasmid (28) containing the FBD gene and adapted in 100 ml of Luria Bertani (LB) medium for 5 h before being transferred into M9 minimal medium (40 mm Na2HPO4, 20 mm KH2PO4, 8.5 mm NaCl, 18 mm 15NH4Cl, 1 mm MgSO4, 1 μm CaCl2, 16 nm riboflavin, 0.4% (w/v) glucose). Expression of FBD was induced during the log phase at an A600 = 0.7 by adding 0.4 mm isopropyl β-d-1-thiogalactopyranoside. Afterward, the cells were allowed to grow at a shaking speed of 140 rpm for 14 h at 30 °C and then harvested. The harvested cells were lysed via treatment with lysozyme (30 μg per ml of cell suspension) for 30 min and subsequent sonication by alternating 1-min pulses for a total of 8 min. The membrane fraction of the cells was recovered by ultracentrifugation (105,000 × g, 45 min), and the protein was solubilized from the membrane with 0.3% (v/v) Triton X-100 at 4 °C via stirring overnight. Solubilized protein was loaded onto a DEAE-Sepharose column equilibrated with loading buffer (50 mm Tris acetate, 0.1 mm EDTA, 0.2 mm DTT, 10% glycerol, 1 μm FMN, pH 6.7). The column was washed with 2 column volumes of loading buffer and 5 column volumes of washing buffer (loading buffer with additional 0.17 m NaCl and 0.3% (w/v) sodium cholate) and gradient-eluted with a total of 4 column volumes of washing buffer and eluting buffer (loading buffer with additional 0.5 m NaCl and 0.3% (w/v) sodium cholate). The eluted protein solution was subjected to a hydroxyapatite column to remove the detergents. The unlabeled FBD was expressed and purified following the same protocol described above, except that after adaptation in 100 ml of LB medium the E. coli cells were transferred into fresh LB medium instead of M9 minimal medium. Full-length rat CPR was overexpressed and purified according to a published protocol (28). Each purified protein exhibited a single band on the SDS-polyacrylamide gel. The concentration of the oxidized FBD and CPR was determined using extinction coefficients of 12.2 and 21.4 mm−1 cm−1, respectively, at 454 nm (29).
Titration of FBD by Dithionite under Anaerobic Conditions
FBD and CPR (11.3 μm) were titrated with a standardized sodium dithionite solution under anaerobic conditions while monitoring the UV-visible spectra. The stock solution of FBD and CPR was incubated overnight at 4 °C in an anaerobic Belle Technology glove box (Hi-Tech, Salisbury, UK) to remove oxygen. The titrant (sodium dithionite solution) was prepared in the glove box in oxygen-free buffer, and its concentration was calculated using an extinction coefficient of 8.04 mm−1 cm−1 at 315 nm (30). The solution of FBD or CPR contained 11.3 μm of the protein, 3 μm methyl viologen, 100 mm potassium phosphate buffer, 5% (w/v) glycerol, pH 7.4. The titration was carried out in a tonometer, a homemade anaerobic titration apparatus, to minimize contamination of oxygen, and was monitored by UV-visible spectrum.
Pre-steady-state Kinetics of Cyt c Reduction by FBD/CPR
All experiments were performed at 25 °C under anaerobic conditions using a Hi-Tech SF61DX2 stopped-flow spectrophotometer housed in an anaerobic Belle Technology glove box. The buffer was purged with nitrogen gas for 30 min for deoxygenation prior to being transferred to the glove box. The solution of cyt c was incubated overnight at 4 °C in the glove box to eliminate oxygen. For measuring the kinetics of cyt c reduction by FBD/CPR, FBD (11.3 μm) and full-length CPR (11.3 μm) were pre-reduced to the intended redox state anaerobically as described above, and then loaded in syringe 1 of the stopped flow, and syringe 2 was loaded with ferric cyt c (100 μm). The reaction was started by rapidly mixing an equal volume from both syringes and was monitored at 550 nm (cyt c reduction) and 630 nm (blue FMN semiquinone oxidation). Baseline was calculated by summing the absorbance of the two components before mixing and subtracted from the measured absorbance to get ΔA. The rate constants and amplitudes were obtained by fitting the absorbance change at 550 and 630 nm with a single exponential function (31) using the KinetAsyst2 software (Hi-Tech). The buffer contained 100 mm potassium phosphate, 5% (w/v) glycerol, pH 7.4. The kinetics of cyt c reduction by one electron-reduced FBD/CPR (11.3 μm) was monitored at varying concentrations of cyt c (5, 12.5, 20, 25, 37.5, 50, 100, and 125 μm). The initial rates of the reaction are plotted against the concentration of cyt c and fitted using Michaelis-Menten Equation 1 under steady-state approximation of the complex intermediate,
 |
where v0 is the initial rate of cyt c reduction; a and b are the total concentrations of the reductase and cyt c; k4 is the rate constant of electron transfer in the complex intermediate, and K is a constant, the meaning of which will be explained in detail under “Results.” The concentration of semiquinone FMN in FBD was calculated using an extinction coefficient of 3.5 mm−1 cm−1 at 630 nm. The amount of reduced cyt c was calculated using a differential extinction coefficient Δϵred-ox of 20.5 mm−1 cm−1 between the reduced and oxidized form of cyt c (32). The experiments were carried out at 298 K.
Kinetics of Autoxidation of Hydroquinone FBD
The kinetics of autoxidation of hydroquinone FBD were studied using the stopped-flow spectrophotometer apparatus as described above. FBD (11.3 μm) was pre-reduced to a two electron-reduced state and loaded in syringe 1 of the stopped flow, and syringe 2 was loaded with a buffer saturated with oxygen. The reaction was started by rapidly mixing an equal volume from both syringes and monitored at 585 and 454 nm. The traces were fitted using a standard single exponential equation using the KinetAsyst2 software (Hi-Tech). The experiment was carried out at 298 K.
Determination of Binding Affinity of Oxidized FBD/CPR with Cyt c by Fluorescence Quenching
Oxidized FBD/CPR was labeled with a fluorescence probe CPM according to published protocol (33). CPM was dissolved in dimethyl sulfoxide at a concentration of 20 mm. The labeling of FBD/CPR with CPM was performed by incubating 10 μm CPR/FBD with 100 μm CPM in the dark at 25 °C for over 5 h. The unbound CPM was removed by passing the mixture through a PD-10 desalting column after the incubation. The CPM-labeled FBD/CPR (FBDCPM/CPRCPM) was concentrated to 62.0 μm in the dark. The buffer contains 100 mm potassium phosphate and 5% (w/v) glycerol, pH 7.4.
The fluorescence quenching experiment was carried out by titrating cyt c into 10 μm FBDCPM/CPRCPM at the following cyt c concentrations: 5, 15, 25, 40, 60, 90, 120, 165, 255, and 345 μm. The fluorescence data were recorded on a Fluoromax-4 spectrofluorometer. Fluorescence emission spectra were collected in the range of 410–500 nm at the excitation wavelength of 385 nm. Fluorescence quenching was monitored by the emission intensity at 465 nm and fitted with Equation 2 for Kd value,
 |
where a and b are the total concentrations of FBDCPM/CPRCPM and cyt c, respectively. ΔQ is the percentage of fluorescence intensity quenched at the emission wavelength of 465 nm relative to free FBDCPM/CPRCPM, and ΔQ∞ is the percentage of fluorescence intensity change for b/a → ∞.
NMR Experiments
All NMR experiments were performed on a Bruker Avance 900 MHz NMR spectrometer equipped with an x,y,z axis PFG-5mm TCI cryoprobe at 298 K. Samples for two-dimensional NMR experiments contained 0.3 mm oxidized 15N-labeled FBD (residues 1–239) in 100 mm potassium phosphate buffer with 5% (w/v) glycerol at pH 7.4. Titration of an unlabeled oxidized cyt c into 15N-labeled FBD was carried out by the addition of a concentrated cyt c solution corresponding to 0.3, 0.6, 0.9, and 5 molar eq of FBD. Two-dimensional 1H/15N TROSY-HSQC spectra were collected at each titration point with 32 scans and 144 t1 increments. The weighted average amide chemical shift perturbation (Δδavg) was calculated using Equation 3,
 |
where ΔδN and ΔδH are changes in chemical shifts observed between the bound and unbound states, and SW1 and SW2 are the spectral widths of the first and second dimensions, respectively (34). All NMR spectra were processed using TopSpin 2.0 (Bruker). Resonance assignments and data analysis were performed using Sparky (35). Spectra were recorded at 298 K.
Structural Modeling of the FBD-Cyt c Complex
HADDOCK 2.1 (36) program was utilized to calculate the structures of the FBD-cyt c complex based on defined ambiguous restraints. HADDOCK docking algorithm includes three consecutive steps as follows: 1) rigid body docking in which the two molecules are rotated and translated randomly in turn to minimize intermolecular energy; 2) simulated annealing of structures in which annealing in torsion angle space is performed to refine the orientation of the proteins and the side chains and/or backbones of the interface residues; and 3) solvent refinement in which the structures are further refined in explicit solvent layers. In this docking, FBD taken from the crystal structure of CPR (PDB code 1AMO) and the solution NMR structure of the horse heart cyt c (PDB code 1AKK) were used as the starting structures. Ligand and topology files were generated from the PRODRG server (37). The docking was driven under defined intermolecular ambiguous restraints obtained from current NMR experiments and the literature, including active and passive residues with >40% solvent accessibility (calculated by NACCESS (38)) from both proteins. 1000 structures were generated in the rigid body docking step, followed by simulated annealing of the 200 lowest energy structures from the last step, and finally the best 50 structures were selected for solvent refinement in an 8.0-Å shell of TIP3P water molecules. The resulting 50 final structures were analyzed and grouped into clusters based on the backbone root mean square deviation values. Molecular structures of the complexes were viewed and graphed using PyMOL.
RESULTS
Characterization of the FMN Binding Domain
To study the interaction between the isolated FBD of CPR and cyt c, we first expressed, purified, and characterized the FBD by SDS-PAGE analysis and redox titration (Fig. 1, A and B). The spectral properties of FBD during anaerobic reduction with standardized sodium dithionite (Fig. 1B) are similar to those of FBD of human CPR (39). Reduction of FBD from the fully oxidized state to blue semiquinone (one electron-reduced) is demonstrated by a decrease in spectral intensity at 454 nm and an increase in intensity of the broad band centered at 585 nm and the shoulder at 630 nm, characteristic of the FMN blue semiquinone formation, with isosbestic points at 502 and 361 nm. Transition from semiquinone to hydroquinone (two electron-reduced) is characterized by a further decrease in intensity at 454 nm as well as at 585 nm with isosbestic points at 327, 386, and 432 nm (Fig. 1B). Autoxidation of the FBD hydroquinone is characterized by an intensity increase at 454 nm, which shows depletion of the hydroquinone form, and an intensity increase at 585 nm, which indicates the formation of the air-stable semiquinone (Fig. 1C), after rapid mixing of two electron-reduced FBD and the oxygen-saturated buffer. The kinetics of autoxidation was monitored at 454 and 585 nm. The observed rate of blue semiquinone formation at 585 nm (0.746 ± 0.006 s−1) (Fig. 1C, red) is slightly slower than that of hydroquinone oxidation at 454 nm (1.33 ± 0.08 s−1) (Fig. 1C, blue).
FIGURE 1.
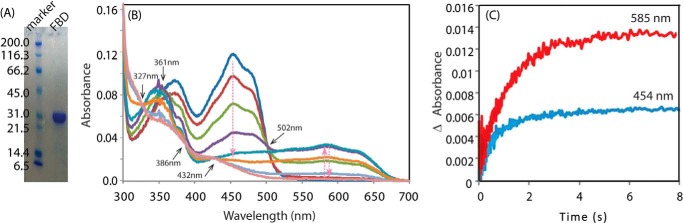
SDS-polyacrylamide gel, redox titration, and autoxidation of FBD. A, SDS-polyacrylamide gel of FBD. The single band reveals the purity of the protein. The unit of the molecular weight is kDa. B, spectral changes during a redox titration of FBD with sodium dithionite under anaerobic conditions. The titration was performed as described under “Experimental Procedures.” The isosbestic points at different titration stages are marked by black arrows. C, kinetic transients of autoxidation of two electron-reduced FBD. FBD was pre-reduced to the two electron-reduced state by stoichiometric titration with sodium dithionite. The reaction was initiated by rapid mixing of two electron-reduced FBD and the oxygen-saturated buffer, and it was monitored at 585 and 454 nm by UV-visible spectroscopy.
Kinetics of Electron Transfer between the FMN Binding Domain and Cytochrome c in Comparison with Full-length CPR
To gain insight into the interactions between cyt c and FBD, we investigated electron transfer from one and two electron-reduced FBD to oxidized cyt c under pseudo-first order conditions and compared those results with full-length CPR. In these experiments, full-length CPR and FBD were reduced to one electron- or two electron-reduced states, prior to mixing with cyt c. Because it lacks the FAD/NADPH binding domain, isolated FBD cannot be reduced by the physiological reductant of CPR-NADPH. Therefore, sodium dithionite was used to titrate FBD and full-length CPR to the intended redox states. Kinetic transients after rapid mixing of pre-reduced reductases and cyt c were measured at 550 nm to monitor cyt c reduction and at 630 nm to monitor oxidation of semiquinone.
The reaction is initiated by rapid mixing of the reduced reductase and a 10-fold molar excess of ferric cyt c. The rate constants are summarized in Table 1. Reduction of cyt c by two electron-reduced rat CPR shows biphasic kinetics (Fig. 2A, red); the fast phase has a k1 of 16.8 ± 0.2 s−1, which is comparable with that in human CPR (kobs = 12 ± 0.2 s−1) (29); the slow phase has a k2 of <0.005 s−1, which is consistent with the incompetence of one electron-reduced CPR for cyt c reduction (Fig. 2A, blue). In comparison, mixing one electron-reduced isolated FBD with cyt c leads to reduction of 1 molar eq of cyt c with a kobs of 0.0227 ± 0.0004 s−1 (t½ ∼35 s) (Fig. 2B, blue). As for the two electron-reduced FBD, a total of 2 molar eq of cyt c is reduced (Fig. 2B, red). The kinetic transient shows an initial increase at 550 nm (ΔA = 0.1) within the dead time of the instrument corresponding to 1 molar eq of cyt c reduction along with the formation of one electron-reduced FBD blue semiquinone, followed by a slow phase with a kobs of 0.0225 ± 0.0005 s−1. This implies a two-step reaction mechanism as in Fig. 3, in which step 1 occurs at a very high rate (>103 s−1), mostly completed within the dead time of the experiment, and step 2 occurs at a rate of ∼0.0225 s−1, which coincides with the rate of cyt c reduction by one electron-reduced FBD. The hypothesized mechanism is also verified by monitoring the kinetic transients at 630 nm, where FMN semiquinone contributes most to the absorbance, while the absorbance of cyt c as well as FMN hydroquinone is negligible. Mixing two electron-reduced FBD with cyt c instantaneously (within 1 ms) leads to an accumulation of FMN semiquinone indicated by the absorbance at 630 nm (Fig. 2C, red). This agrees with a rapid reduction of cyt c (within 1 ms) by the hydroquinone FMN, suggested in step 1 of the mechanism (Fig. 3). The following decay of absorbance at 630 nm at a rate of 0.0257 ± 0.0007 s−1 (Fig. 2C, red) implies the oxidation of semiquinone FMN by cyt c in step 2 (Fig. 3), which coincides with the rate of cyt c reduction by one electron-reduced FBD.
TABLE 1.
Kinetics of the reduction of cyt c by FBD and CPR
| Reductase | Wavelength | k1, obs | k2, obs |
|---|---|---|---|
| nm | s−1 | s−1 | |
| One electron-reduced CPR | 550 | <0.005 | |
| Two electron-reduced CPR | 550 | 16.8 ± 0.2a | < 0.005 |
| One electron-reduced FBD | 550 | 0.0227 ± 0.0004 | |
| 630 | 0.0239 ± 0.0006 | ||
| Two electron-reduced FBD | 550 | >103 | 0.0225 ± 0.0005 |
| 630 | >103 | 0.0257 ± 0.0007 |
a Standard deviations were calculated among three kinetic transients monitored at the same wavelength.
FIGURE 2.
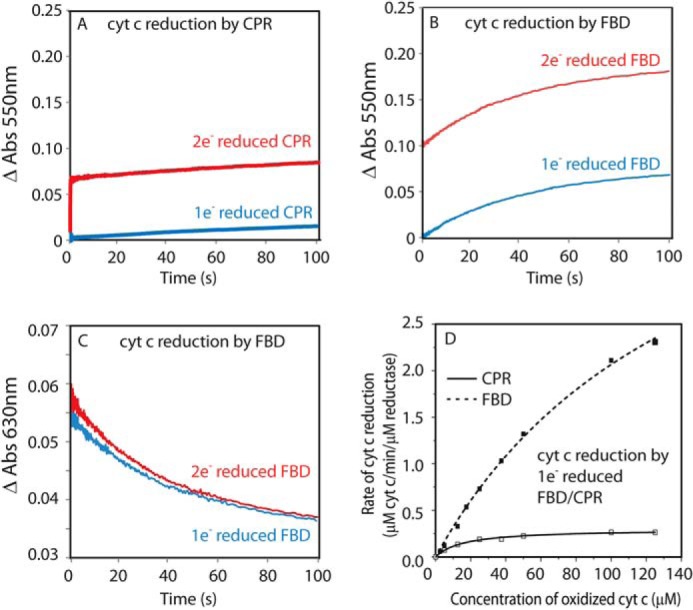
Electron transfer between FBD/full-length CPR and cyt c. FBD/CPR (11.3 μm) was reduced to one electron- and two electron-reduced states by stoichiometric titration with sodium dithionite and then rapidly mixed with cyt c in the stopped-flow spectrometer. A, reduction of cyt c (100 μm) by one electron-reduced (blue) and two electron-reduced (red) CPR was monitored at 550 nm. B and C, reduction of cyt c (100 μm) by one electron-reduced (blue) and two electron-reduced (red) FBD was monitored at 550 nm (B), and oxidation of semiquinone FMN was monitored at 630 nm (C). D, dependence of the initial rate of cyt c reduction by one electron-reduced FBD and CPR on varying concentrations of cyt c.
FIGURE 3.
Two-step mechanism of electron transfer from two electron-reduced FBD to cyt c.
The elevated activity of one electron-reduced FBD in reducing cyt c, as compared with CPR in the same redox state, is further demonstrated in Fig. 2D. The initial rate of cyt c reduction by one electron-reduced FBD is ∼10 times higher than that by one-electron reduced CPR at a saturated concentration of cyt c. Under the assumptions of steady-state approximation of the complex intermediate in the initial state of the reaction, the curves in Fig. 2D were fitted into Equation 1 to extract the values of k4 and K (= k − 3 + k4)/k3 as noted in Fig. 3. Interestingly, the k4 and K values determined for FBD (k4 = 27.7 ± 2.6 s−1; K = 152 ± 14 μm) are both significantly larger than those for CPR (k4 = 1.58 ± 0.05 s−1; K = 16 ± 2 μm), suggesting that the incompetence of one electron-reduced CPR in cyt c reduction might attribute to a slow rate of electron transfer after the complex intermediate is formed. Because the redox potentials of FBD are nearly identical to those of CPR (12, 39), it could be the poor accessibility of the cofactor FMN in one electron-reduced CPR that hinders the electron transfer after the complex formation.
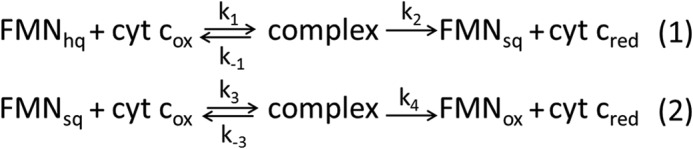
The distinct abilities of semiquinone FBD and CPR to reduce cyt c are also shown in Fig. 4. Mixing of one electron-reduced full-length CPR and cyt c does not lead to proportional reduction of cyt c after 30 min (Fig. 4A, red); merely 19% of reduction occurred due to the slow rate of electron transfer (40). We also did not observe significant oxidation of the blue FMN semiquinone, indicated by the shoulder at 630 nm (Fig. 4A, red). However, upon addition of NADPH to the mixture of one electron-reduced full-length CPR and cyt c, cyt c was instantly reduced as indicated by absorbance at 550 nm (Fig. 4A, dashed blue line). The shoulder at 630 nm in both traces shows that blue semiquinone FMN in CPR is not competent in reducing cyt c. In contrast, one electron-reduced FBD, after mixing with 10-fold molar excess of cyt c, leads to a reduction of 1 molar eq of cyt c (shown at 550 nm) accompanied by the oxidation of semiquinone (shown at 630 nm) (Fig. 4B).
FIGURE 4.
Cyt c reduction by pre-reduced full-length CPR and FBD. FBD/CPR (7 μm) was reduced to one electron-reduced state by dithionite and mixed with oxidized cyt c (14 μm) under anaerobic conditions. A, spectra of one electron-reduced CPR and cyt c were recorded before mixing (cyan) and 30 min after mixing (red). NADPH (20 μm) was added into the mixture anaerobically (dashed blue line) and resulted in total reduction of cyt c (arrow 1), whereas CPR remained in one electron-reduced state (arrow 2). B, spectra of one electron-reduced FBD and cyt c was recorded before mixing (cyan) and 30 min after mixing (red). The reduction of cyt c and oxidation of FMN semiquinone is indicated by arrows 1 and 2, respectively. The spectra before mixing were calculated by addition of the individual spectra of the two components.
Determination of the Binding Affinity between Oxidized FBD/CPR and Cyt c by Fluorescence Quenching
To assess the binding affinity between oxidized FBD/CPR and cyt c, we monitored the complex formation by fluorescence quenching experiments. Attachment of the fluorescent probe CPM has been shown not to affect the activity of the wild-type CPR (41). Formation of the complex between oxidized FBD/CPRCPM and cyt c leads to fluorescence quenching of the labeled probe CPM, as depicted in Fig. 5. Plotting the percentage of fluorescence quenching at 465 nm against the concentration of cyt c gives rise to binding curves shown in Fig. 5, B and D. By fitting the curve into the equation for binary complex formation (Equation 2), dissociation constants (Kd) are determined to be 63 ± 10 and 37 ± 3 μm for oxidized FBDCPM-cyt c and CPRCPM-cyt c, respectively.
FIGURE 5.

Determination of Kd value between oxidized FBD/CPR and cyt c by fluorescence quenching. Fluorescence quenching of oxidized CPRCPM (A and B) and FBDCPM (C and D) titrated by cyt c was determined at the following cyt c concentrations: 0, 5, 15, 25, 40, 60, 90, 120, 165, 255, and 345 μm. The concentrations of CPRCPM and FBDCPM are 10 μm. The emission spectra were collected at room temperature with an excitation at 385 nm. Fluorescence quenching at 465 nm is plotted (B and D) and fitted with Equation 2. All titrations were carried out in 100 mm potassium phosphate buffer containing 5% (w/v) glycerol at pH 7.4.
NMR Titrations of Cyt c into Oxidized FBD
Two-dimensional 15N/1H HSQC spectra were recorded to monitor the titration of unlabeled cyt c to 15N-labeled FBD (residues 1–239) in their oxidized forms. Fig. 6 shows the HSQC spectra of free FBD (green) and FBD in complex with cyt c (magenta) at a molar ratio of FBD/cyt c of 1:5. The backbone assignments of the soluble part of FBD (residues 64–239) of CPR have been previously reported (42) and are utilized in this study, although residues 1–63 were not assigned individually in the spectra. Throughout the titration, only one set of backbone resonances of FBD were observed, implying that the interaction between FBD and cyt c occurs on the fast-exchange NMR time scale. Chemical shift changes were observed for specific residues of FBD upon complex formation with cyt c, as shown in Fig. 6C. Most of the chemical shift perturbations occur in a saturable manner throughout the titration. Fig. 7 shows perturbations of the averaged 1H, 15N chemical shifts for selected backbone amides as a function of increasing molar ratios of cyt c to FBD.
FIGURE 6.

Two-dimensional 1H/15N HSQC spectra of FBD in its free form and in complex with cyt c. A, superposition of 1H/15N HSQC spectra of 15N-labeled FBD in the free form (green) and in complex with unlabeled cyt c (magenta). The FBD/cyt c molar ratio was 1:5 in 100 mm potassium phosphate buffer at pH 7.4 containing 5% (w/v) glycerol. B and C, expansions of crowded regions of the spectra given in A.
FIGURE 7.
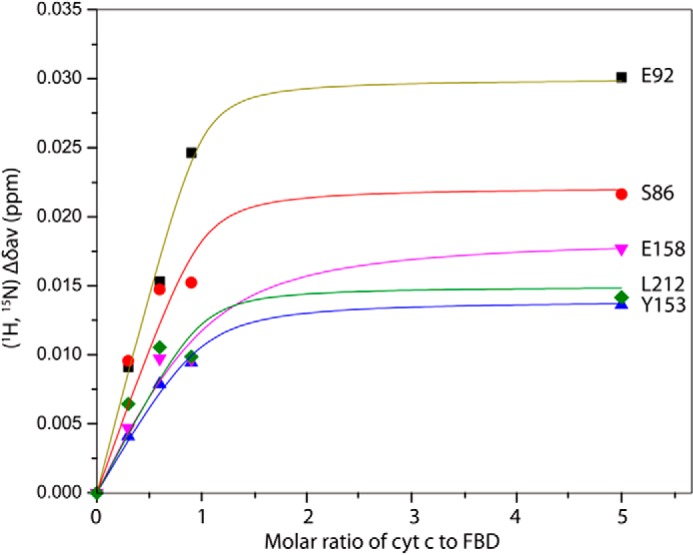
Titration of 15N-labeled FBD with unlabeled cyt c. Changes in weighted average of chemical shifts (Δδave) for the backbone amides of Ser-86, Glu-92, Tyr-153, Glu-158, and Leu-212 of 15N-labeled FBD (0.3 mm) upon titration of unlabeled cyt c.
Chemical Shift Mapping of Binding Interface on FBD
Chemical shift perturbation observed for the backbone amides of FBD (residues 64–239) upon complex formation with cyt c at a 1:1 molar ratio is depicted in Fig. 8. Upon interacting with a molar equivalent of cyt c, the residues of the catalytic domain of FBD (residues 64–239) have an average chemical shift change of 0.009 ppm. The unassigned N terminus of FBD (residues 1–63) has insignificant chemical shift perturbations upon the addition of cyt c with an average change of 0.004 ppm (data not shown). The overall relatively small magnitude of chemical shift perturbation may be attributed to the following reasons: 1) low binding affinity between FBD and cyt c; and 2) formation of “encounter complexes,” as have been previously reported for other electron transfer complexes, which are characterized by an ensemble of various orientations in complex formation leading to averaging effect of chemical shift perturbations (23, 24, 43, 44).
FIGURE 8.
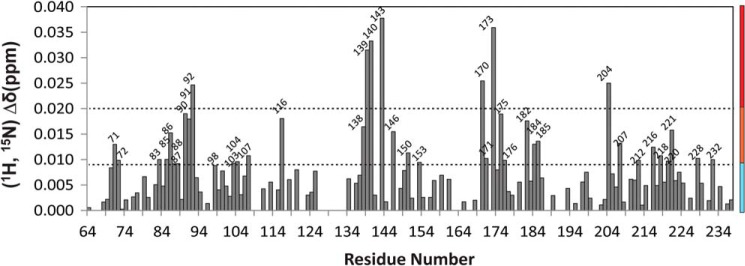
Chemical shift perturbation analysis. A histogram presenting the weighted average amide chemical shift of FBD upon complex formation with cyt c. The molar ratio of FBD to cyt c is 1:1. The chemical shift perturbation is categorized as high (red), medium (orange), and not significant (cyan), presented by the vertical color stripe, and is also mapped onto the structure of FBD in Fig. 9.
Distribution of chemical shift perturbations is mapped onto the structure of FBD (Fig. 9). The structure of FBD (PDB code 1AMO) is composed of five strands of parallel β-sheets flanked by six α-helices, a typical α-β-α folding pattern, as shown in Fig. 9A, with the FMN cofactor located between the loops at the C terminus of the β-sheets with its isoalloxazine ring flanked between Tyr-140 and Tyr-178. Most of the solvent-accessible residues, whose chemical shift perturbations are above the average value (Fig. 9, B and C, orange and red), are found to be located around the solvent-exposable region of the FMN cofactor, which is the putative binding interface on FBD for efficient electron transfer (7, 45). For these residues (Gln-87, Thr-88, Thr-90, Glu-92, Tyr-140, Asn-175, and Leu-212), their chemical shift perturbations associated with the addition of cyt c are likely due to hydrogen bonding and van der Waals interactions. There are additional solvent-exposed residues with modest chemical shift perturbations distributed around the surface of FBD distant from the cofactor, most of which are charged residues, including Lys-72, Glu-116, Arg-104, Lys-176, Asp-207, and Glu-221. The broad distribution of chemical shift mapping (Fig. 9) is another sign of the formation of dynamic complexes between the two proteins, which is attributed to the fact that FBD is rich in negatively charged residues that are not only localized in close proximity of the FMN cofactor but widely spread out on the surface of FBD. Long range electrostatic interactions between these negatively charged regions of FBD and the positively charged cyt c may direct intermolecular collisions on various regions of FBD, which is consistent with the NMR observation of small scale chemical shift changes over a large surface area. Despite the variety of orientations that the two proteins may sample during complex formation, electron transfer still occurs at a fast rate (>103 s−1) according to the kinetic results. We postulate that this occurs because the two proteins are both small in size, and their cofactors are both located close to the protein surface.
FIGURE 9.
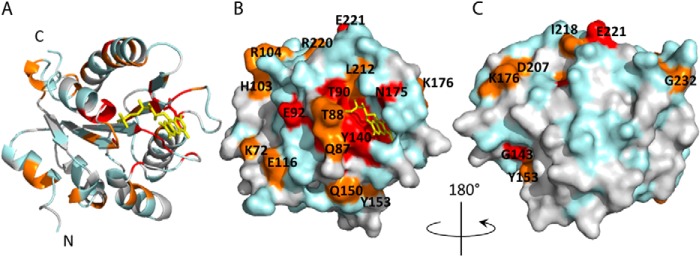
Chemical shift mapping of FBD upon complex formation with cyt c. A, schematic representation of FBD. Residues are colored according to the amplitudes of amide chemical shift changes upon binding cyt c, following the color codes in Fig. 8. Red, orange, and cyan represent residues with high, medium, and not significant chemical shift perturbations, respectively. Overlapped and unassigned residues are colored gray. B, surface representation of A. C, 180° rotation view of B.
Structural Model of the FBD-Cyt c Complex
To obtain further structural information on the FBD-cyt complex, a structural model of the complex was generated using a data-driven docking program HADDOCK (36). Solvent-accessible residues of FBD, which show medium and high chemical shift perturbations (Fig. 8 and 9, red and orange) upon complex formation, are selected as the active ambiguous restraints from FBD, including Lys-72, Gln-87, Thr-88, Thr-90, Glu-92, His-103, Arg-104, Glu-116, Tyr-140, Gly-143, Gln-150, Tyr-153, Asn-175, Lys-176, Asp-207, Leu-212, Thr-218, Arg-220, Glu-221, and Gly-232. Passive restraints were defined by the solvent-accessible residues flanking the active ones, including Gly-141, Pro-145, Asp-147, Thr-177, Tyr-178, Asp-208, Asp-209, Asp-215, and Ile-217. Active ambiguous restraints on cyt c were selected to be the common residues in the binding interfaces of several electron transfer complexes involving cyt c, including Gln-12, Lys-13, Gln-16, Cys-17, Ile-81, Ala-83, and Ile-85 (24, 25, 46). Asp-2, Lys-5, Lys-8, Val-11, Lys-79, Lys-86, Lys-87, Lys-88, and Thr-89; which are in proximity of the active residues on cyt c, are chosen as passive restraints. HADDOCK was performed as described under “Experimental Procedures.” The results of the docking reveal that certain active restraints of FBD, e.g. His-103, Arg-104, Glu-221, and Gly-232, were violated in more than 45 out of the 50 final structures. The violations probably resulted from the sparse distribution of the input restraints, including residues distant from the FMN cofactor (Fig. 9). Residues violated in more than 90% of the final structures are removed from the list of active restraints, giving rise to a refined list of restraints shown in Table 2. The refined restraints were applied in the docking program using the same protocol.
TABLE 2.
List of refined restraints used in HADDOCK
| FBD | cyt c | |
|---|---|---|
| Ambiguous restraints, active | Gln-87, Thr-88, Thr-90, Glu-92, Tyr-140, Asn-175, Leu-212, Arg-220 | Gln-12, Lys-13, Gln-16, Cys-17, Ile-81, Ala-83, Ile-85 |
| Ambiguous restraints, passive | Gly-141, Gly-143, Pro-145, Asp-147, Thr-177, Tyr-178, Asp-208, Asp-209, Asp-215, Ile-217 | Asp-2, Lys-5, Lys-8, Val-11, Lys-79, Lys-86, Lys-87, Lys-88, Thr-89 |
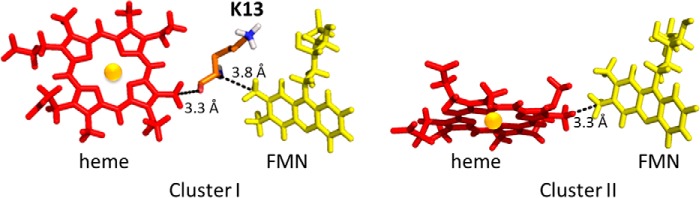
Two clusters of complex structures were identified from the 50 lowest-energy structures, titled cluster I (major) and cluster II (minor). The energy statistics of the clusters are summarized in Table 3. The average intermolecular energies of the two clusters are −514.7 and −342.4 kcal/mol, of which the major contribution arises from electrostatic energies. This major contribution from electrostatic interaction implies its significance in complex formation between FBD and cyt c. Two lowest energy structures from each cluster are shown in cartoon and surface representations (Fig. 10), which suggest two unique but overlapping interfaces on both FBD and cyt c. Residues involved in the potential binding interface are located near the heme of cyt c and the FMN cofactor of FBD, albeit specific residues on the interfaces vary between the two clusters. In cluster I, the interface is mainly composed of β1-α3 coil, N terminus of α3, N terminus of β4-α6 coil, β5-α7 coil, and the N terminus of α7 of FBD and α1 helix, α3-α4 coil, and α4-α5 coil of cyt c. In cluster II, interface residues are located on β1-α3 coil, β3-α5 coil, β4-α6 coil and N terminus of β5-α7 coil of FBD, and C terminus α1 helix, N terminus of α1-α2 coil and α4-α5 coil of cyt c. The interfacial residues common to the two clusters are Gln-87, Thr-88, Thr-90, Tyr-140, Asn-175, Thr-177, Tyr-178, and Asp-208 of FBD and Ile-9, Gln-12, Lys-13, Ile-81, Ala-83, Gly-84, Ile-85, and Lys-86 of cyt c, which are in close proximity to the redox centers of the two proteins. In the two clusters, the dihedral angles between the heme plane and the isoalloxazine ring of FMN are 60 and 110°. The shortest distances between the edges of heme and FMN are 6.1 and 1.9 Å in cluster I and cluster II, respectively, which is well within the 14.0 Å limit predicted for efficient electron transfer (47). The proposed structural model gives detailed information on the possible binding interface of the complex and provides a structural basis for predicting the electron transfer pathway between the two proteins.
TABLE 3.
Statistical analysis of the two lowest energy clusters of the FBD-cyt c complex generated from HADDOCK
| Parameters | Cluster I | Cluster II |
|---|---|---|
| Backbone r.m.s.d. (Å)a | 2.93 ± 1.98 | 1.46 ± 0.77 |
| Total intermolecular energy (kcal/mol) | −515 ± 64 | −342 ± 60 |
| van der Waals energy (kcal/mol) | −35.8 ± 7.6 | −48.8 ± 6.3 |
| Electrostatic energy (kcal/mol) | −479 ± 67 | −294 ± 65 |
| Buried surface area (×1000 Å2) | 1.30 ± 0.08 | 1.31 ± 0.05 |
a Average root mean square deviation (r.m.s.d.) and standard deviation were calculated by comparing with the lowest energy structure in the respective cluster.
FIGURE 10.

Structural models of the FBD-cyt c complex. A and B, representatives of the two clusters of the lowest energy complex structures generated from HADDOCK. PDB 1AMO and PDB 1AKK were used as the initial structures of FBD and cyt c in the docking. Heme and the FMN cofactor are presented by red and yellow sticks, respectively. C and D, surface representations of the two complexes (A and B). Interfacial residues involved in protein-protein contacts in the complex models are highlighted and color-coded based on the properties of the amino acids. Polar neutral, nonpolar, positive, and negative residues are given as cyan, magenta, orange, and green, respectively. Heme and the cofactor FMN are colored red and yellow, respectively. E and F (from C and D), FBD and cyt c are rotated around their vertical axes by 90° as indicated, to display the binding interfaces. Residues are identified with the single-letter amino acid code. G, mapping of interfacial information on FBD from previous mutagenesis studies. Mutations of residues colored in red and pink lead to reduced activity and no effect on the activity of human FBD in cyt c reduction, respectively (14). Mutation of the residue colored in sand does not affect the cyt c reducing activity of rat CPR (17), and for the residues colored in blue, mutations improve the catalytic efficiency for cyt c reduction (13).
DISCUSSION
Comparison of Cyt c Reduction by FBD and Full-length CPR
Our study reveals that the isolated FBD, both in its one electron- and two electron-reduced redox states, can reduce cyt c (Table 1). Electron transfer from hydroquinone FBD to cyt c (kobs > 103 s−1) occurs at a much higher rate than that from semiquinone FBD (kobs = 0.0227 s−1). Considering the large redox potential differences between the semiquinone FBD (−68 mV) (48) and oxidized cyt c (250 mV) (49), the slow electron transfer rate between the two proteins implies that the process may be gated. According to the crystal structure of rat CPR (7), a hydrogen bond could form between the protonated N5 (N5H) of the flavin, i.e. a neutral blue semiquinone and the carbonyl of the Gly-141 in the FMN-binding loop. We hypothesize that this hydrogen bond might effectively stabilize the blue semiquinone form of FBD, rendering a high activation energy for electron transfer. The importance of this conserved glycine residue on the redox potential of semiquinone FMN has been previously implicated. Studies have shown that mutation of the Gly-61 in Desulfovibrio vulgaris flavodoxin, which is homologous to Gly-141 in rat CPR, destabilizes the semiquinone state and causes shifts of the midpoint potentials (50). In cyt P450BM3, this conserved glycine residue is absent, leading to an unstable anionic FMN semiquinone form that has a higher reactivity as compared with the neutral FMN semiquinone in CPR (51).
A comparison of cyt c reduction by full-length CPR and the isolated FBD (Table 1) reveals that, in both one and two electron-reduced states, FBD reduces cyt c at a rate significantly faster than that of full-length CPR. Because the midpoint redox potentials of the isolated domain have been proved to be nearly identical to those of the intact CPR, and the binding affinity between oxidized CPRCPM and cyt c (Kd = 37 ± 3 μm) is slightly higher than that between oxidized FBDCPM and cyt c (Kd = 62 ± 10 μm) according to the fluorescence quenching measurement, the contrast in the reaction rates is most likely due to the accessibility of the FMN cofactor to cyt c. In the isolated FBD, the cofactor FMN is partially solvent-exposed (Fig. 9), whereas resting state CPR exists in a predominant “closed conformation” in which the FMN cofactor is in close proximity with FAD but buried in the interface between the FMN and FAD binding domains, making it inaccessible by cyt c (7, 52). A movement of the FMN binding domain relative to the rest of the CPR molecule is essential for electron transfer from CPR to its redox partners, the process of which may be regulated by nucleotide binding, redox states of the cofactors, and solvent condition (53–56). Electron transfer between one electron-reduced CPR and cyt c is most likely prohibited due to the “closed” conformation of CPR, whereas cyt c reduction by two electron-reduced CPR is likely to be gated by domain movement of the protein.
Complex Formation between FBD and Cyt c
It has been proposed that weak and transient complexes are commonly formed between electron transfer proteins to ensure high turnover rates (57). The relative orientation of the two proteins in the complex can range from well defined to highly dynamic (44). The latter is featured by an ensemble of various orientations interchanging among themselves on a fast exchange time scale. This can result in overall averaged intermolecular effects observed in NMR experiments upon complex formation (e.g. chemical shift perturbations, nuclear Overhauser effects, and paramagnetic enhancement effects), leading to identification of extensive binding sites. As shown in Figs. 8 and 9, the relative small scale of overall chemical shift perturbations and the presence of affected residues that are distant from the FMN cofactor suggest the existence of an ensemble of dynamic complexes. Similar complexes were observed in a number of electron transfer protein systems, including cyt b5-cyt P450 (22, 58), adrenodoxin-cyt c (44), myoglobin-cyt b5 (23), cyt c-cyt b5 (24, 43), and plastocyanin-cyt f complexes (59). Dynamic complexes are usually formed between two proteins rich in complementary charges and dominantly driven by long-range electrostatic interactions (57). Most of the orientations involved in dynamic complexes are not optimized to facilitate interprotein electron transfer. One or more specific complexes need to form, which are usually characterized with a higher affinity of the two proteins and sufficient proximity between the redox centers for efficient electron transfer. The structures of these complexes are proposed through the structural models obtained from HADDOCK (Fig. 10).
The structural model of the FBD-cyt c complex generated by HADDOCK suggests two possible orientations of complex formation between FBD and cyt c. The orientations of cyt c are nearly perpendicular between the two structures with respect to FBD, resulting in overlapping but not identical interfaces. A comparison of the interfaces between the two clusters reveals that there is a higher proportion of electrostatic interactions involved in the binding interface of cluster I, whereas hydrophobic interactions and/or van der Waals contacts are more predominant in the interface of cluster II (Fig. 10, E and F, and Tables 3 and 4). A closer look at the interfaces suggests several pairs of hydrogen bond and/or salt bridge formation (Table 4), which may contribute to the stability of the complex and aid in electron transfer. In previous studies, it was reported that mutations on the acidic cluster on the FMN binding domain composed of Glu-213, Glu-214, and Asp-215 (Fig. 10G) lead to a significant decrease in the catalytic activity of both full-length and the isolated FMN binding domain of human CPR on cyt c reduction (14, 17). In cluster I of our structural models, we observe salt bridge formation between Glu-213 Oϵ of FBD and Lys-87 N of cyt c as well as Glu-214 Oϵ of FBD and Lys-87 Nζ of cyt c, which could play a role in the binding and electron transfer between the two redox partners. Salt bridges can also form between Asp-208 Oδ of FBD and Lys-13 Nζ of cyt c as well as Asp-209 Oδ of FBD and Lys-72 Nζ of cyt c, consistent with previous chemical cross-linking studies (15) and prediction from putative docking (7). However, as reported, a single mutation of Asp-208 or Asp-209 in human CPR (Fig. 10G) does not significantly affect its activity in cyt c reduction (14, 17), implying that these salt bridges might not be as essential for the stability of the complex as those formed on Glu-213 and Glu-214. From the HADDOCK models (Fig. 10, E and F), Asp-208 is located in the binding interfaces of both clusters, whereas Asp-209 is only present in the interface of cluster I. Single mutations of other negatively charged residues on FBD of human CPR, including Asp-133, Glu-142, Asp-147, Asp-207, and Asp-215 also lead to insignificant effects on cyt c reduction (14), which may be due to the abundant electrostatic interactions between the two proteins. In cluster II, only two salt bridges are observed, between Glu-147 Oδ of FBD and Lys-13 Nζ of cyt c and between Glu-179 Oϵ of FBD and Lys-27 Nζ of cyt c, and a single mutation of Glu-147 of human CPR does not seem to affect the catalytic activity for cyt c reduction significantly (14).
TABLE 4.
Summary of residues involved in hydrogen bonds/salt bridges on the FBD-cyt c binding interface
| Cluster I |
Cluster II |
||
|---|---|---|---|
| FBD | cyt c | FBD | cyt c |
| Gln-87 | Gln-12 | Gln-87 | Ile-85 |
| Glu-92 | Lys-5 | Glu-142 | Gln-16 |
| Glu-93 | Lys-86 | Asp-147 | Lys-13 |
| Glu-93 | Thr-89 | Glu-179 | Lys-27 |
| Asp-208 | Lys-13 | His-180 | Gln-16 |
| Asp-209 | Lys-72 | ||
| Glu-213 | Lys-87 | ||
| Glu-214 | Lys-87 | ||
To gain insight into the residues that are crucial for electron transfer, we used HARLEM (Hamiltonians to research large molecules) (60) program to predict the shortest electron transfer pathways between the two proteins. In cluster I, the predicted coupling pathway initiates at the C8M atom of the FMN cofactor, and it continues via Cα, C(O), and O of Lys-13 of cyt c consecutively until the conjugated heme ring (Fig. 11A). The pathway suggests the importance of Lys-13 in mediating the electron transfer process. Lys-13 of cyt c locates in close proximity of the heme and forms a salt bridge with Asp-208 of FBD in the complex model (cluster I). This residue is mostly conserved in cyt c among animals and plants, and it has been observed to be involved in the binding interfaces between cyt c and other redox proteins, including l-galactono-1,4-lactone dehydrogenase in plant mitochondria (46), cytochrome b5 (24), and cytochrome c oxidase (61). In cluster II, due to the short edge-to-edge distance between FMN and heme (1.9 Å), electron transfer is predicted to occur directly from C7M atom of FMN to the heme (Fig. 11B).
FIGURE 11.
Electron transfer pathway predicted using HARLEM. Black dotted lines show the predicted electron transfer pathway for clusters I and II.
In summary, we have characterized the kinetics of electron transfer from FBD to cyt c by stopped-flow spectroscopy and investigated the complex formation between the two proteins using NMR spectroscopy in conjunction with HADDOCK. A comparison of cyt c reduction by FBD and full-length CPR supports the key role of conformational gating on electron transfer from CPR to its redox partners. Our NMR measurements not only reveal the formation of dynamic complexes between FBD and cyt c on a fast exchange time scale, but also identify specific residues of FBD involved in the binding interface with cyt c. A structural model of the FBD-cyt c complex developed using HADDOCK, unveiling two probable orientations of complex formation, is reported. The proposed model allows us to identify the interprotein interactions on the binding interface and to propose electron transfer pathway from FBD to cyt c. Combined kinetic and structural information presented in this study provides insights into the function of CPR and will facilitate further understanding of the mechanistic details on how electron transfer occurs from CPR to its redox partners.
This work was supported, in whole or in part, by National Institutes of Health Grants GM084018 and GM095640 (to A. R.) and GM094209. This work was also supported by a merit review grant from Veterans Affairs (to L. W.).
- CPR
- cytochrome P450 reductase
- cyt c
- cytochrome c
- FBD
- FMN binding domain
- cyt P450
- cytochrome P450
- HSQC
- heteronuclear single quantum coherence
- PDB
- Protein Data Bank
- CPM
- N-[4-(7-diethylamino-4-methyl-3-coumarinyl)phenyl]maleimide.
REFERENCES
- 1. Ortiz de Montellano P. R. (ed) (2005) Cytochrome P450: Structure, Mechanism, and Biochemistry, pp. 115–118, Kluwer Academic/Plenum Publishers, New York [Google Scholar]
- 2. Schacter B. A., Nelson E. B., Marver H. S., Masters B. S. (1972) Immunochemical evidence for an association of heme oxygenase with the microsomal electron transport system. J. Biol. Chem. 247, 3601–3607 [PubMed] [Google Scholar]
- 3. Oshino N., Imai Y., Sato R. (1971) A function of cytochrome b5 in fatty acid desaturation by rat liver microsomes. J. Biochem. 69, 155–167 [DOI] [PubMed] [Google Scholar]
- 4. Williams C. H., Jr., Kamin H. (1962) Microsomal triphosphopyridine nucleotide-cytochrome c reductase of liver. J. Biol. Chem. 237, 587–595 [PubMed] [Google Scholar]
- 5. Bachur N. R., Gordon S. L., Gee M. V., Kon H. (1979) NADPH cytochrome P-450 reductase activation of quinone anticancer agents to free radicals. Proc. Natl. Acad. Sci. U.S.A. 76, 954–957 [DOI] [PMC free article] [PubMed] [Google Scholar]
- 6. Nebert D. W., Russell D. W. (2002) Clinical importance of the cytochromes P450. Lancet 360, 1155–1162 [DOI] [PubMed] [Google Scholar]
- 7. Wang M., Roberts D. L., Paschke R., Shea T. M., Masters B. S., Kim J. J. (1997) Three-dimensional structure of NADPH-cytochrome P450 reductase: prototype for FMN- and FAD-containing enzymes. Proc. Natl. Acad. Sci. U.S.A. 94, 8411–8416 [DOI] [PMC free article] [PubMed] [Google Scholar]
- 8. Horecker B. L. (1950) Triphosphopyridine nucleotide-cytochrome-c reductase in liver. J. Biol. Chem. 183, 593–605 [Google Scholar]
- 9. Lu A. Y., Coon M. J. (1968) Role of hemoprotein P-450 in fatty acid ω-hydroxylation in a soluble enzyme system from liver microsomes. J. Biol. Chem. 243, 1331–1332 [PubMed] [Google Scholar]
- 10. Sem D. S., Kasper C. B. (1994) Kinetic mechanism for the model reaction of NADPH-cytochrome P450 oxidoreductase with cytochrome c. Biochemistry 33, 12012–12021 [DOI] [PubMed] [Google Scholar]
- 11. Xia C., Hamdane D., Shen A. L., Choi V., Kasper C. B., Pearl N. M., Zhang H., Im S. C., Waskell L., Kim J. J. (2011) Conformational changes of NADPH-cytochrome P450 oxidoreductase are essential for catalysis and cofactor binding. J. Biol. Chem. 286, 16246–16260 [DOI] [PMC free article] [PubMed] [Google Scholar]
- 12. Grunau A., Paine M. J., Ladbury J. E., Gutierrez A. (2006) Global effects of the energetics of coenzyme binding: NADPH controls the protein interaction properties of human cytochrome P450 reductase. Biochemistry 45, 1421–1434 [DOI] [PubMed] [Google Scholar]
- 13. Jang H. H., Jamakhandi A. P., Sullivan S. Z., Yun C. H., Hollenberg P. F., Miller G. P. (2010) β sheet 2-α helix c loop of cytochrome P450 reductase serves as a docking site for redox partners. Biochim. Biophys. Acta 1804, 1285–1293 [DOI] [PMC free article] [PubMed] [Google Scholar]
- 14. Zhao Q., Modi S., Smith G., Paine M., McDonagh P. D., Wolf C. R., Tew D., Lian L. Y., Roberts G. C., Driessen H. P. (1999) Crystal structure of the FMN-binding domain of human cytochrome P450 reductase at 1.93 A resolution. Protein Sci. 8, 298–306 [DOI] [PMC free article] [PubMed] [Google Scholar]
- 15. Nisimoto Y. (1986) Localization of cytochrome c-binding domain on NADPH-cytochrome P-450 reductase. J. Biol. Chem. 261, 14232–14239 [PubMed] [Google Scholar]
- 16. Nadler S. G., Strobel H. W. (1988) Role of electrostatic interactions in the reaction of NADPH-cytochrome P-450 reductase with cytochromes P-450. Arch. Biochem. Biophys. 261, 418–429 [DOI] [PubMed] [Google Scholar]
- 17. Shen A. L., Kasper C. B. (1995) Role of acidic residues in the interaction of NADPH-cytochrome P450 oxidoreductase with cytochrome P450 and cytochrome c. J. Biol. Chem. 270, 27475–27480 [DOI] [PubMed] [Google Scholar]
- 18. Tamburini P. P., Schenkman J. B. (1986) Differences in the mechanism of functional interaction between NADPH-cytochrome P-450 reductase and its redox partners. Mol. Pharmacol. 30, 178–185 [PubMed] [Google Scholar]
- 19. Shen S., Strobel H. W. (1994) Probing the putative cytochrome P450- and cytochrome c-binding sites on NADPH-cytochrome P450 reductase by anti-peptide antibodies. Biochemistry 33, 8807–8812 [DOI] [PubMed] [Google Scholar]
- 20. Hiruma Y., Hass M. A., Kikui Y., Liu W. M., Ölmez B., Skinner S. P., Blok A., Kloosterman A., Koteishi H., Löhr F., Schwalbe H., Nojiri M., Ubbink M. (2013) The structure of the cytochrome p450cam-putidaredoxin complex determined by paramagnetic NMR spectroscopy and crystallography. J. Mol. Biol. 425, 4353–4365 [DOI] [PubMed] [Google Scholar]
- 21. Tripathi S., Li H., Poulos T. L. (2013) Structural basis for effector control and redox partner recognition in cytochrome P450. Science 340, 1227–1230 [DOI] [PubMed] [Google Scholar]
- 22. Ahuja S., Jahr N., Im S. C., Vivekanandan S., Popovych N., Le Clair S. V., Huang R., Soong R., Xu J., Yamamoto K., Nanga R. P., Bridges A., Waskell L., Ramamoorthy A. (2013) A model of the membrane-bound cytochrome b5-cytochrome P450 complex from NMR and mutagenesis data. J. Biol. Chem. 288, 22080–22095 [DOI] [PMC free article] [PubMed] [Google Scholar]
- 23. Worrall J. A., Liu Y., Crowley P. B., Nocek J. M., Hoffman B. M., Ubbink M. (2002) Myoglobin and cytochrome b5: a nuclear magnetic resonance study of a highly dynamic protein complex. Biochemistry 41, 11721–11730 [DOI] [PubMed] [Google Scholar]
- 24. Deep S., Im S. C., Zuiderweg E. R., Waskell L. (2005) Characterization and calculation of a cytochrome c-cytochrome b5 complex using NMR data. Biochemistry 44, 10654–10668 [DOI] [PMC free article] [PubMed] [Google Scholar]
- 25. Volkov A. N., Worrall J. A., Holtzmann E., Ubbink M. (2006) Solution structure and dynamics of the complex between cytochrome c and cytochrome c peroxidase determined by paramagnetic NMR. Proc. Natl. Acad. Sci. U.S.A. 103, 18945–18950 [DOI] [PMC free article] [PubMed] [Google Scholar]
- 26. Gutierrez A., Doehr O., Paine M., Wolf C. R., Scrutton N. S., Roberts G. C. (2000) Trp-676 facilitates nicotinamide coenzyme exchange in the reductive half-reaction of human cytochrome P450 reductase: properties of the soluble W676H and W676A mutant reductases. Biochemistry 39, 15990–15999 [DOI] [PubMed] [Google Scholar]
- 27. Gutierrez A., Munro A. W., Grunau A., Wolf C. R., Scrutton N. S., Roberts G. C. (2003) Interflavin electron transfer in human cytochrome P450 reductase is enhanced by coenzyme binding. Relaxation kinetic studies with coenzyme analogues. Eur. J. Biochem. 270, 2612–2621 [DOI] [PubMed] [Google Scholar]
- 28. Bridges A., Gruenke L., Chang Y. T., Vakser I. A., Loew G., Waskell L. (1998) Identification of the binding site on cytochrome P450 2B4 for cytochrome b5 and cytochrome P450 reductase. J. Biol. Chem. 273, 17036–17049 [DOI] [PubMed] [Google Scholar]
- 29. Gutierrez A., Lian L. Y., Wolf C. R., Scrutton N. S., Roberts G. C. (2001) Stopped-flow kinetic studies of flavin reduction in human cytochrome P450 reductase and its component domains. Biochemistry 40, 1964–1975 [DOI] [PubMed] [Google Scholar]
- 30. Yousafzai F. K., Eady R. R. (2002) Dithionite reduction kinetics of the dissimilatory copper-containing nitrite reductase of Alcalegenes xylosoxidans. The SO2⨪ radical binds to the substrate binding type 2 copper site before the type 2 copper is reduced. J. Biol. Chem. 277, 34067–34073 [DOI] [PubMed] [Google Scholar]
- 31. Gutierrez A., Paine M., Wolf C. R., Scrutton N. S., Roberts G. C. (2002) Relaxation kinetics of cytochrome P450 reductase: internal electron transfer is limited by conformational change and regulated by coenzyme binding. Biochemistry 41, 4626–4637 [DOI] [PubMed] [Google Scholar]
- 32. Zabinski-Snopko R., Czerlinski G. (1981) Spectrophotometric titrations of ferricytochrome c with ferrohexacyanide in the pH range 5 to 7. J. Biol. Phys. 9, 155–167 [Google Scholar]
- 33. Wang J., de Montellano P. R. (2003) The binding sites on human heme oxygenase-1 for cytochrome p450 reductase and biliverdin reductase. J. Biol. Chem. 278, 20069–20076 [DOI] [PubMed] [Google Scholar]
- 34. Williamson M. P. (2013) Using chemical shift perturbation to characterise ligand binding. Prog. Nucl. Magn. Reson. Spectrosc. 73, 1–16 [DOI] [PubMed] [Google Scholar]
- 35. Goddard T. D., Kneller D. G. (2006) SPARKY 3, University of California, San Francisco [Google Scholar]
- 36. de Vries S. J., van Dijk A. D., Krzeminski M., van Dijk M., Thureau A., Hsu V., Wassenaar T., Bonvin A. M. (2007) HADDOCK versus HADDOCK: new features and performance of HADDOCK2.0 on the CAPRI targets. Proteins 69, 726–733 [DOI] [PubMed] [Google Scholar]
- 37. Schüttelkopf A. W., van Aalten D. M. (2004) PRODRG: a tool for high-throughput crystallography of protein-ligand complexes. Acta Crystallogr. D Biol. Crystallogr. 60, 1355–1363 [DOI] [PubMed] [Google Scholar]
- 38. Hubbard S. J., Thornton J. M. (1993) NACCESS, Version 2.1.1, University College London, UK [Google Scholar]
- 39. Munro A. W., Noble M. A., Robledo L., Daff S. N., Chapman S. K. (2001) Determination of the redox properties of human NADPH-cytochrome P450 reductase. Biochemistry 40, 1956–1963 [DOI] [PubMed] [Google Scholar]
- 40. Vorkink W. P., Cusanovich M. A. (1974) Photoreduction of horse heart cytochrome c. Photochem. Photobiol. 19, 205–215 [DOI] [PubMed] [Google Scholar]
- 41. Davydov D. R., Knyushko T. V., Kanaeva I. P., Koen Y. M., Samenkova N. F., Archakov A. I., Hui Bon Hoa G. (1996) Interactions of cytochrome P450 2B4 with NADPH-cytochrome P450 reductase studied by fluorescent probe. Biochimie 78, 734–743 [DOI] [PubMed] [Google Scholar]
- 42. Barsukov I., Modi S., Lian L. Y., Sze K. H., Paine M. J., Wolf C. R., Roberts G. C. (1997) 1H, 15N and 13C NMR resonance assignment, secondary structure and global fold of the FMN-binding domain of human cytochrome P450 reductase. J. Biomol. NMR 10, 63–75 [DOI] [PubMed] [Google Scholar]
- 43. Shao W., Im S. C., Zuiderweg E. R., Waskell L. (2003) Mapping the binding interface of the cytochrome b5-cytochrome c complex by nuclear magnetic resonance. Biochemistry 42, 14774–14784 [DOI] [PubMed] [Google Scholar]
- 44. Worrall J. A., Reinle W., Bernhardt R., Ubbink M. (2003) Transient protein interactions studied by NMR spectroscopy: the case of cytochrome c and adrenodoxin. Biochemistry 42, 7068–7076 [DOI] [PubMed] [Google Scholar]
- 45. Hamdane D., Xia C., Im S. C., Zhang H., Kim J. J., Waskell L. (2009) Structure and function of an NADPH-cytochrome P450 oxidoreductase in an open conformation capable of reducing cytochrome P450. J. Biol. Chem. 284, 11374–11384 [DOI] [PMC free article] [PubMed] [Google Scholar]
- 46. Hervás M., Bashir Q., Leferink N. G., Ferreira P., Moreno-Beltrán B., Westphal A. H., Díaz-Moreno I., Medina M., de la Rosa M. A., Ubbink M., Navarro J. A., van Berkel W. J. (2013) Communication between l-galactono-1,4-lactone dehydrogenase and cytochrome c. FEBS J. 280, 1830–1840 [DOI] [PubMed] [Google Scholar]
- 47. Page C. C., Moser C. C., Dutton P. L. (2003) Mechanism for electron transfer within and between proteins. Curr. Opin. Chem. Biol. 7, 551–556 [DOI] [PubMed] [Google Scholar]
- 48. Das A., Sligar S. G. (2009) Modulation of the cytochrome P450 reductase redox potential by the phospholipid bilayer. Biochemistry 48, 12104–12112 [DOI] [PMC free article] [PubMed] [Google Scholar]
- 49. Rodkey F. L., Ball E. G. (1947) Oxidation-reduction potentials of cytochrome c. Fed. Proc. 6, 286. [PubMed] [Google Scholar]
- 50. O'Farrell P. A., Walsh M. A., McCarthy A. A., Higgins T. M., Voordouw G., Mayhew S. G. (1998) Modulation of the redox potentials of FMN in Desulfovibrio vulgaris flavodoxin: thermodynamic properties and crystal structures of glycine-61 mutants. Biochemistry 37, 8405–8416 [DOI] [PubMed] [Google Scholar]
- 51. Sevrioukova I. F., Li H., Zhang H., Peterson J. A., Poulos T. L. (1999) Structure of a cytochrome P450-redox partner electron-transfer complex. Proc. Natl. Acad. Sci. U.S.A. 96, 1863–1868 [DOI] [PMC free article] [PubMed] [Google Scholar]
- 52. Vincent B., Morellet N., Fatemi F., Aigrain L., Truan G., Guittet E., Lescop E. (2012) The closed and compact domain organization of the 70-kDa human cytochrome P450 reductase in its oxidized state as revealed by NMR. J. Mol. Biol. 420, 296–309 [DOI] [PubMed] [Google Scholar]
- 53. Wadsäter M., Laursen T., Singha A., Hatzakis N. S., Stamou D., Barker R., Mortensen K., Feidenhans'l R., Møller B. L., Cárdenas M. (2012) Monitoring shifts in the conformation equilibrium of the membrane protein cytochrome P450 reductase (POR) in nanodiscs. J. Biol. Chem. 287, 34596–34603 [DOI] [PMC free article] [PubMed] [Google Scholar]
- 54. Hay S., Brenner S., Khara B., Quinn A. M., Rigby S. E., Scrutton N. S. (2010) Nature of the energy landscape for gated electron transfer in a dynamic redox protein. J. Am. Chem. Soc. 132, 9738–9745 [DOI] [PubMed] [Google Scholar]
- 55. Pudney C. R., Khara B., Johannissen L. O., Scrutton N. S. (2011) Coupled motions direct electrons along human microsomal P450 Chains. PLoS Biol. 9, e1001222. [DOI] [PMC free article] [PubMed] [Google Scholar]
- 56. Huang W. C., Ellis J., Moody P. C., Raven E. L., Roberts G. C. (2013) Redox-linked domain movements in the catalytic cycle of cytochrome P450 reductase. Structure 21, 1581–1589 [DOI] [PMC free article] [PubMed] [Google Scholar]
- 57. Ubbink M. (2012) Dynamics in transient complexes of redox proteins. Biochem. Soc. Trans. 40, 415–418 [DOI] [PubMed] [Google Scholar]
- 58. Estrada D. F., Laurence J. S., Scott E. E. (2013) Substrate-modulated cytochrome P450 17A1 and cytochrome b5 interactions revealed by NMR. J. Biol. Chem. 288, 17008–17018 [DOI] [PMC free article] [PubMed] [Google Scholar]
- 59. Scanu S., Förster J., Finiguerra M. G., Shabestari M. H., Huber M., Ubbink M. (2012) The complex of cytochrome f and plastocyanin from Nostoc sp. PCC 7119 is highly dynamic. ChemBioChem. 13, 1312–1318 [DOI] [PMC free article] [PubMed] [Google Scholar]
- 60. Kurnikov I. V. (2000) HARLEM Molecular Modeling Package, Version 1.0, University of Pittsburgh, Pittsburgh, PA [Google Scholar]
- 61. Sakamoto K., Kamiya M., Imai M., Shinzawa-Itoh K., Uchida T., Kawano K., Yoshikawa S., Ishimori K. (2011) NMR basis for interprotein electron transfer gating between cytochrome c and cytochrome c oxidase. Proc. Natl. Acad. Sci. U.S.A. 108, 12271–12276 [DOI] [PMC free article] [PubMed] [Google Scholar]