

Background: CYP2D6 genetic variation and drug-drug interactions can decrease drug safety and efficacy.
Results: A novel CYP2D6 crystal form facilitates characterization of CYP2D6 drug structural interactions.
Conclusion: Glu-216, Glu-222, and Asp-301 as well as conformational flexibility contribute to CYP2D6 drug binding.
Significance: The results and approach can aid structure-based design to reduce CYP2D6-related drug safety and efficacy issues.
Keywords: Crystal Structure, Cytochrome P450, Drug Metabolism, Enzyme Inhibitor, Protein Structure, Cytochrome P450 2D6 (CYP2D6), Ajmalicine, Quinidine, Quinine, Thioridazine
Abstract
P450 2D6 contributes significantly to the metabolism of >15% of the 200 most marketed drugs. Open and closed crystal structures of P450 2D6 thioridazine complexes were obtained using different crystallization conditions. The protonated piperidine moiety of thioridazine forms a charge-stabilized hydrogen bond with Asp-301 in the active sites of both complexes. The more open conformation exhibits a second molecule of thioridazine bound in an expanded substrate access channel antechamber with its piperidine moiety forming a charge-stabilized hydrogen bond with Glu-222. Incubation of the crystalline open thioridazine complex with alternative ligands, prinomastat, quinidine, quinine, or ajmalicine, displaced both thioridazines. Quinine and ajmalicine formed charge-stabilized hydrogen bonds with Glu-216, whereas the protonated nitrogen of quinidine is equidistant from Asp-301 and Glu-216 with protonated nitrogen H-bonded to a water molecule in the access channel. Prinomastat is not ionized. Adaptations of active site side-chain rotamers and polypeptide conformations were evident between the complexes, with the binding of ajmalicine eliciting a closure of the open structure reflecting in part the inward movement of Glu-216 to form a hydrogen bond with ajmalicine as well as sparse lattice restraints that would hinder adaptations. These results indicate that P450 2D6 exhibits sufficient elasticity within the crystal lattice to allow the passage of compounds between the active site and bulk solvent and to adopt a more closed form that adapts for binding alternative ligands with different degrees of closure. These crystals provide a means to characterize substrate and inhibitor binding to the enzyme after replacement of thioridazine with alternative compounds.
Introduction
Many therapeutic drugs that are positively charged at physiologic pH undergo metabolic clearance by liver P4502 2D6. These cationic drugs include thioridazine and other therapeutics that target the central nervous or cardiovascular systems (1). The prominence of P450 2D6 in the metabolism of cationic drugs is thought to reflect interactions of cationic substrates with the active site anionic amino acid side chains of Glu-216 and Asp-301, which are likely to orient substrates for metabolism. Thioridazine is a phenothiazine, antipsychotic drug that was widely used for treatment of schizophrenia and psychosis. P450 2D6 catalyzes the sulfoxidation of thioridazine (2, 3) to form the antipsychotic mesoridazine that is also a substrate of P450 2D6 for further sulfoxidation to form sulforidazine, another antipsychotic. It has been reported that these metabolites are more potent than thioridazine and may contribute to thioridazine's therapeutic effects (4). Hydroxylation of thioridazine by P450 2D6 at C7 has also been reported and can lead reactive products trapped as glutathione adducts (5). Thioridazine is used as a racemate, and P450 2D6 contributes extensively to the clearance of both enantiomers (6). Administration of thioridazine to patients that are genetically deficient in P450 2D6 expression can lead to over sedation (7). This P450 2D6 “poor metabolizer” phenotype is evident in 5∼10% of the Caucasian population (8), and the United States Food and Drug Administration issued a warning recommendation that thioridazine should not be used with patients receiving other drugs that inhibit P450 2D6 or with patients having reduced levels of the enzyme due to genetic variation because of a risk for increased cardiotoxicity. These considerations illustrate the need to better understand the binding of substrates and inhibitors to P450 2D6 in order to reduce the potential risks that arise from metabolic drug-drug interactions and individual variation in the contributions of P450 2D6 in the metabolism of new chemical entities.
X-ray crystal structures have been reported for P450 2D6 crystallized with prinomastat (9), a neutral molecule, bound in the active site (PDB3 code 3QM4) or for the V374M variant of P450 2D6 (10) crystallized in the absence of a ligand (PDB code 2F9Q). The two structures display significant conformational differences for helix F-G, helix A, helix B-C, and β-sheet 1 regions of the protein that form the distal surfaces of the active site cavity (9). As substrates and inhibitors vary greatly in size and in molecular properties, we determined structures of thioridazine complexed with P450 2D6 by x-ray crystallography to better understand the role of conformational changes and the role of ionic interactions in substrate binding to P450 2D6. Two crystal forms were obtained that reflect different conformations of the protein. The protein was crystallized in the C121 space group with one molecule of thioridazine bound in a closed active site and in a second crystalline form exhibiting the P212121 space group where P450 2D6 crystallized with two molecules of thioridazine bound in an expanded, more open active site cavity. In both structures the protonated nitrogen of the thioridazine methyl piperidine ring forms a charge-stabilized hydrogen bond with Asp-301 on helix I in the active site. The second thioridazine, which is bound in the entry channel, forms a charge-stabilized hydrogen bond with Glu-222, which may serve as the initial site for binding cationic substrates in the entrance channel to facilitate their entry into the active site.
The sparse crystal lattice interactions near the portal to the active site in the P212121 crystal form suggested that P450 2D6 might be able to undergo elastic deformations to further open the entrance channel for ligand exchange between the buried active site and the bulk solvent followed by adaptive changes to accommodate alternative ligands. To test this hypothesis, alternative ligands were added to the mother liquor before harvesting crystals for data collection. The structures determined after this procedure indicated that a single molecule of each ligand occupied the active site and prevented the binding of thioridazine or a second molecule of the competitive ligand in the entrance channel. The ability of the enzyme to undergo adaptations for inhibitor binding in this crystal lattice was further demonstrated by comparisons of the structures obtained by competitive replacement of thioridazine with the 2D6 inhibitors prinomastat (9), quinidine (11), quinine (11), and ajmalicine (Refs. 12 and 13 and Fig. 1). These structures identify binding interactions for the bound inhibitors as well as changes in the polypeptide backbone and side-chain rotamer torsion angles to accommodate substrate binding. Ajmalicine elicited the largest changes, which converted the open structure to one that was more similar to the closed 3QM4 structure.
FIGURE 1.

Two-dimensional structures of P450 2D6 substrates and inhibitors used in this study. The asterisk indicates the chiral carbon of thioridazine.
EXPERIMENTAL PROCEDURES
Expression and Purification of Human P450 2D6
A modified form of human P450 2D6 used previously for determination of the structure of the prinomastat complex (PDB code 3QM4) was employed for the current studies. The expression of the protein in Escherichia coli and partial purification of the protein by affinity chromatography using nickel-nitrilotriacetic acid-agarose (Qiagen, Valencia, CA) was essentially as described previously (9). Thioridazine (0.1 mm) was used instead of prinomastat as the stabilizing ligand during the purification procedure, and the protein was eluted from nickel-nitrilotriacetic acid-agarose in a 120 mm KPi buffer, pH 7.4, containing 30 mm histidine, 20% glycerol, 0.1 mm thioridazine (Sigma), 10 mm β-mercaptoethanol, and 14 mm CHAPS detergent (Anatrace, Maumee, OH). After concentration of the protein to ∼200 μm by centrifugal filtration, the protein was purified further by size exclusion chromatography with Sephacryl 200 HR using the 120 mm KPi buffer without histidine. The concentration of the protein was estimated by UV-visible difference spectroscopy for the CO complex of the dithionite-reduced enzyme versus the reduced enzyme (14). The eluted thioridazine complex was concentrated and used directly for crystallization under conditions similar to that used for the prinomastat complex.
For crystallization of the thioridazine complex in the presence of zinc chloride, the phosphate concentration was lowered to 25 mm, and the detergent CHAPS was replaced by a new facial amphiphile FA-3 (15), which is now commercially available as Facade™-EM (Avanti Polar Lipids), by using 5 rounds of 5∼10-fold dilution with 25 mm KPi buffer, pH 7.4, containing 20% glycerol, 0.1 mm thioridazine, 10 mm β-mercaptoethanol, and 0.4 mm Façade-EM and followed by concentration using an Amicon centrifugal filtration unit (Millipore).
Protein Crystallization, Data Collection, and Structure Determination
Preparations of the modified CYP2D6 protein were crystallized by hanging drop vapor diffusion. For crystallization of 2D6 in the C121 space group, a drop containing 1 μl of the concentrated P450 2D6 thioridazine complex (0.35 mm) in 120 mm KPi, pH 7.4, 0.4 mm NaCl, 20% glycerol, 10 mm β-mercaptoethanol, 0.1 mm thioridazine, 0.25 μl of 70 mm HEGA-10 (Anatrace), and 0.625 μl of precipitant solution (20% PEG-3350, 0.2 m sodium acetate, pH 7.0, 0.1 m sodium cacodylate, pH 7.0) was set to equilibrate against 0.5 ml of reservoir solution composed of the same precipitant solution with 0.2 m NaCl at 296 K. Data were collected from a single crystal at 100 K that diffracted to >3.2 Å at Stanford Synchrotron Radiation Lightsource beamline 7-1, and data integrated, scaled, and merged to 3.3 Å were used for refinement. As the space group and unit cell dimensions were highly similar to those of the crystal used to determine the 3QM4 structure of 2D6 complexed with prinomastat, initial phases were obtained by molecular replacement (R = 0.301) by rigid body refinement of the 2 polypeptide chains and hemes of the asymmetric unit of the 3QM4 structure and bulk solvent flattening with a resolution range of 39.4-3.3 Å using PHENIX (16). The structure was adjusted against 2|Fo| − |Fc| and |Fo| − |Fc| electron density maps using COOT (17). The model was refined to a limiting resolution of 3.3 Å using PHENIX with a final R = 0.242. To prevent over-refinement, torsion angle restraints based on a reference model were used (18). Initially, the 3QM4 structure and subsequently the input model served as reference models for restrained minimization. Additionally, weighting factors in the refinements were optimized to prevent over-refinement as judged by the divergence of R from Rfree (5% of the reflections). With the exception of residues 230–237 of chain B, the initial model contained residues 33 to the C-terminal residue 497 of the native protein. As electron density for the loop between helices C and D of both chains was not well defined, residues 143–146 and 143–147 were not included in chains A and B, respectively, of the final model. This model and the structure factors were deposited in the PDB with the accession code 4WNW.
The conditions for crystallization of the protein in the presence of zinc ions were modified as follows. The drop was composed of 1.5 μl of protein solution, 0.25 μl of 70 mm HEGA-10 (Anatrace), and 0.3 μl of precipitant solution (16% PEG-3350, 0.2 m sodium acetate, pH 7.0, 0.1 m sodium cacodylate, pH 7.0, and 2 mm zinc chloride). The dataset used for structure determination was collected from a single crystal at 100 K on Stanford Synchrotron Radiation Lightsource beamline 7-1. A dataset indexed in the P212121 space group with a limiting resolution of 2.1 Å was used for structure solution and refinement. Four molecules were identified in the asymmetric unit with a log likelihood gain of 26,558 by a molecular replacement search using PHASER (19) with chain B of the 3QM4 2D6 structure and a resolution range of 54.8–2.04 Å. The initial model (R = 0.351) was subjected to repeated rounds of adjustment and torsion angle dynamics with simulated annealing, conjugate gradient minimization, and individual isotropic B-factor refinement using CNS (20) with a final R = 0.222. This model and structure factors were deposited in the PDB with the accession code 3TBG.
Crystals produced in this manner with thioridazine as the 2D6 ligand were used in subsequent experiments to test whether competitive ligands could replace thioridazine after addition to the mother liquor. For prinomastat, 0.125 μl of 200 mm prinomastat in DMSO was added to a drop containing crystals grown in the presence of thioridazine as described in the previous paragraph. Crystals were harvested after a 24-h incubation. The mother liquor was supplemented with glycerol (15% v/v) before harvest to protect crystals before freezing them in liquid nitrogen. The structure of the resulting prinomastat complex with 2D6 was determined using a data set collected from a single crystal at 100 K on Stanford Synchrotron Radiation Lightsource beamline 11-1 with a limiting resolution of 2.67 Å. As the unit cell dimensions and space group were highly similar to that of the crystal used for determination of the 3TBG structure, molecular replacement by rigid body refinement of the four chains of 3TBG structure representative of the starting crystals and bulk solvent correction for the resolution range 42.1–2.8 Å were used for initial phasing (R = 0.340). Adjustments to the model and further refinement were performed as described for the 3TBG structure. The final model (R = 0.217) was deposited in the PDB with the accession code 3TDA.
Structures of P450 2D6 with quinidine (PDB code 4WNU) or quinine (PDB code 4WNV) bound in the active site were obtained after exposures of crystals to 0.125 μl of 100 mm quinidine in DMSO or 0.2 μl of 70 mm quinine sulfate in methanol added directly to the mother liquor. The datasets used for determination of the quinidine and quinine complexes were collected from single crystals at 100 K on Stanford Synchrotron Radiation Lightsource beamline 7-1. Molecular replacement by rigid body refinement of four chains of the 3TBG structure and bulk solvent correction was used for the quinidine complex (R = 0.304) with a resolution range of 53.5–2.26 Å and for the quinine complex (R = 0.289) with a resolution range of 57.0–2.35 Å. The models were adjusted and refined to limiting resolutions of 2.26 and 2.35 Å with R = 0.190 and R = 0.202, respectively, for the quinidine and quinine complexes using CNS initially and PHENIX for the final rounds of refinement.
Similarly, a 0.2-μl aliquot of 12 mm ajmalicine (MP Biomedicals) in methanol was added to the mother liquor containing crystals of the 2D6 thioridazine complex. Data were collected from a single crystal at 100 K on Stanford Synchrotron Radiation Lightsource beamline 7-1. This crystal exhibited the P21212 space group with the length of one axis reduced by half relative to the P212121 crystals. Two molecules were identified in the asymmetric unit with a log likelihood gain of 6469 by a molecular replacement search using PHASER (19) and 3TDA chain A as the search model and a resolution range of 54.9–2.55 Å. The initial model (R = 0.368) was adjusted and refined to a limiting resolution of 2.6 Å using CNS initially and followed by PHENIX for the final stages of model building and refinement (R = 0.192). This model and the structure factors were deposited in the Protein Data Bank with the accession code 4WNT. Data integration and merging statistics as well as model refinement statistics are provided in supplemental Table 1 and in the headers of the deposited PDB entries.
Generation of Ligand Structures and Stereochemical Restraints
Structures of the S and R enantiomers of thioridazine determined by x-ray crystallography (21, 22) were used as initial models for generation of geometric restraints for CNS using PRODRG2 (23). Idealized coordinates and restraint files in PDB and CIF formats, respectively, for use in Phenix and COOT were generated using the GRADE (24) web server. An initial structure of ajmalicine (8-methyl-5,6,7a,8,11a,12,12a,13-octahydro-7H-9-oxa-6a,13-diaza-indeno[2,1-a]anthracene-11-carboxylic acid methyl ester) was generated using OPEN BABEL (25) from an isomeric smile string downloaded from the NCBI PubChem database, entry CID_441975 for generation of CNS restraint files. Idealized initial structures and restraint files in PDB and CIF formats, respectively, for use in Phenix and COOT were generated using the GRADE web server. Initial geometries and restraint files for quinine ((R)-[(2S,4S,5R)-5-ethenyl-1-azabicyclo[2.2.2]octan-2-yl]-(6-methoxyquinolin-4-yl)methanol) and quinidine ((S)-[(2R,4S,5R)-5-ethenyl-1-azabicyclo[2.2.2]octan-2-yl]-(6-methoxyquinolin-4-yl)methanol) were generated similarly from isomeric smile representations from the NCBI PubChem database, entries CID_3034034 and CID_441074, respectively, using the GRADE server.
Molecular graphics were rendered using PyMOL. Cavity surface maps were defined using Voidoo (26) with a 1.4 Å probe. Channels between cavities and between a cavity and the surface of the protein were analyzed using MOLE 2 (27), and tunnel surfaces were exported for visualization in PyMOL. Simple omit maps were calculated using Phenix with bulk solvent correction and anisotropic scaling by omitting the substrate or inhibitor from the calculation of Fc. Unless otherwise noted, superposition of molecules was performed using COOT by minimization of the square of the residual difference in the position of Cα atoms for residues 312–460. This comprises the structural core, which is spatially conserved in P450 structures. Where indicated, all Cα atoms were used for global alignment of multiple structures using ProSMART (28) as implemented in iCCP4 and rendered using PyMOL.
RESULTS AND DISCUSSION
Closed Structure of P450 2D6 with One Thioridazine Molecule Bound in the Active Site
To better understand the role of 2D6 conformational flexibility in substrate binding, 2D6 was isolated and crystallized in the presence of thioridazine under conditions used for determination of the 3QM4 structure of the prinomastat-2D6 complex. As illustrated in Fig. 2A, the tricyclic phenothiazine moiety of thioridazine is oriented almost perpendicular to the plane of the heme with the side chain of the protonated N-methylpiperidine group projecting outward parallel with helix I and above Phe-120 toward the helix B-C loop. Electron density for the tricyclic phenothiazine ring conforms to its overall shape, but for omit maps the density is weak at the end of the thiophenazine ring closest to the heme. This is likely to reflect the conformational heterogeneity of thioridazine and relatively relaxed steric restraints near the heme when compared with the upper portion of the cavity. As the location of the methylsulfide group is ambiguous, the phenothiazine ring was modeled for two alternative conformations of the phenothiazine moiety. One orientation places the S-methyl group in close proximity to the heme. Although the model indicates that the S-methyl rotamer could approach within 4.8 Å of the heme iron, its position is not defined by electron density. P450 2D6 converts thioridazine to the methyl sulfone, which is likely to reflect direct oxidation of the sulfur. This would require a closer approach of the sulfur to the heme iron as would also be required for hydroxylation at C7 for the alternative orientation of the phenothiazine group. Both sites of metabolism are about 7 Å from the heme iron. Modeling the substrate in close proximity to the reactive oxene suggests that changes in torsion angles for the side chain and a small translation of the phenothiazine ring would facilitate the reaction with the iron bound oxene. These small changes are likely to be commensurate with thermal motion in the active site at normal temperatures.
FIGURE 2.

Structural features of the closed P450 2D6 thioridazine complex crystallized in the C121 space group. Oxygen, nitrogen, sulfur, iron, and nickel atoms are colored red, blue, yellow, orange, and green, respectively. A, a stereo view (cross-eyed) of the active site with carbons colored blue for the thioridazine complex and white for the 3QM4 structure of the P450 2D6 prinomastat complex for comparison of changes in side chains and backbone atoms (Cα). The heme is depicted as a stick figure with carbons colored brown. The green mesh depicts a 2m|Fo| − D|Fc| ligand omit map contoured at 1 σ around thioridazine. The distance of the thioridazine atom that most closely approaches the heme iron is depicted as a dashed line with the length indicated in Å. C7 of thioridazine is indicated by the arrowhead. B, an overlay of the two chains in the asymmetric unit colored to reflect variation of root mean square deviation for Cα atoms from low (yellow) to high (red). The alignment and color map were generated by ProSMART. The heme (brown carbons), thioridazine (gray carbons), and a nickel (green) are rendered as spheres. The antechamber adjacent to the active site is rendered as a transparent light orange surface. The arrow indicates the entrance to channel 2b. Helices are denoted by letters and sheets by numerals as customary for P450s. C, a view of the nickel ion binding site in chain B (cyan carbons) and the interaction of Glu-287 in a neighboring copy of chain B (yellow carbons) with the nickel ion. Distances between oxygen and nitrogen atoms forming the nickel binding site are indicated in Å.
Thioridazine is used clinically as a racemic mixture, and 2D6 is thought to oxidize both enantiomers (6). Although racemic thioridazine was used for crystallization, thioridazine was only modeled as the R enantiomer (RTZ). The asymmetric carbon is located at the site of attachment of the N-methyl piperidine ring to the 3-carbon chain connecting it to the phenothiazine ring. The S enantiomer is also consistent with the diffuse density for the methylpiperidine, but we did not attempt to model the two conformations of the methyl piperidine and the two conformations of the phenothiazine moieties simultaneously. These alternative conformations are likely to contribute to the diffuse density.
The protonated lone pair of the RTZ piperidine nitrogen is directed toward the negatively charged oxygen of Asp-301 at a distance of 3.0 Å. Glu-216 is positioned more than 5.5 Å away from the piperidine nitrogen, and there are no intervening atoms that would shield the nitrogen from the negative charge of Glu-216. A sodium ion was modeled into electron density based on B values and its close proximity to the side chain oxygens of Glu-216. Additionally, the side-chain nitrogen of Gln-242 is positioned for hydrogen bonding to an carboxyl oxygen of Glu-216 as seen in the 3QM4 structure. Terminal nitrogens of the Arg-221 side chain are positioned roughly equidistant from Glu-216 and Glu-222 (not shown), which resides in the entrance channel antechamber depicted in Fig. 2B. The remaining polar residues in the substrate binding site, Ser-304 and Thr-309, are hydrogen-bonded to the backbone carbonyls of Ala-300 and Ala-305, respectively.
With the exception of residues in the vicinity of the N-methylpiperidine group, most of the active site residues did not exhibit significant Cα shifts or changes in side-chain torsion angles when compared with the 3QM4 structure of the co-crystallized prinomastat complex. The largest Cα movement was observed for Phe-112 and adjacent residues on helix B-C loop, which moves out from the active site to accommodate the binding of the methylpiperidine ring near Asp-301. Changes in the dihedral angles for Phe-120 and Leu121 are also evident, which opens a channel between the active site cavity and an adjacent antechamber under helix F′ (Fig. 2B) with a minimum radius of 1.7 Å. In general, the antechamber increases the potential range of motion for side chains that border both cavities to adapt to ligand binding. In this structure there is a channel between the antechamber and the exterior solvent with a minimum radius of 1.5 Å between Trp-75, Thr-76, and Thr-394 on β-sheet 1 and Pro-104 on the helix B-B′ loop. This channel is evident in other P450s and is designated as 2b in the nomenclature of Wade and co-workers (29).
A superposition of chains A and B is also shown in Fig. 2B. Overall, the Cα traces of the chains A and B are very similar with a 0.68 Å root mean square deviation. The regions of greatest divergence are tinted red. These deviations reflect lattice packing interactions. The region preceding helix A′ and the helix F′ to G″ region are involved in an asymmetric interaction between chains A and B. The portion of chain A colored white could not be modeled for chain B due to conformational disorder. The presence of the antechamber is likely to contribute to the malleability of this region of the structure. The green sphere represents a nickel ion bound in the turn between helices G and H of chain B. The nickel ion is bound by the side chains of His-253, Asp-270, and Glu-273, Fig. 2C, as seen in the 3QM4 structure of the co-crystallized prinomastat complex. This region also participates in a lattice-packing interaction with the loop between helices H and I of a crystallographic symmetry-related copy of chain B where Glu-287 of the neighboring molecule binds to the nickel ion (Fig. 2C). This lattice interaction produces only localized deformations of the protein structure with little deviation evident for adjacent portions of the structural back bone (Fig. 2B).
Open Structure of P450 2D6 with a Molecule of Thioridazine in the Active Site and Another Thioridazine Bound in the Antechamber of the Entrance Channel
The presence of nickel ions bound to one of the two chains of the asymmetric unit in the C121 crystal form suggested that providing additional nickel ions or other divalent metal ions at sufficient concentrations to saturate the metal ion binding site would increase the yield of crystals and potentially improve x-ray diffraction. When the concentration of phosphate was lowered to prevent formation of insoluble phosphates, a screen of several metal ions indicated that zinc ions produced crystals most consistently. Additionally, exchange of CHAPS used during purification with a facial amphiphile developed by Qinghai Zhang and co-workers (15) at The Scripps Research Institute increased the size of the crystals. In the presence of thioridazine, Façade-EM, and zinc ions, P450 2D6 crystallized in a new lattice exhibiting the P212121 space group with four molecules in the asymmetric unit.
The structure of the complex was refined to a limiting resolution of 2.1 Å and exhibits two molecules of thioridazine. One is located in the active site, and the other resides in the entrance channel antechamber (Fig. 3A, green carbons). The RTZ molecule proximal to the heme forms an ionic hydrogen bond with Asp-301 as seen in the C121 crystal form, but the phenothiazine group is rotated away from the heme iron and out toward the antechamber, where it contacts the second molecule of thioridazine in the antechamber. This difference relative to the orientation seen in the C121 crystal is associated with a regularization of the central portion of helix I near the heme iron, which is bowed out of the active site in the C121 crystal form (Fig. 3A, gray carbons) when compared with the P212121 structure and the 2F9Q structure of substrate-free P450 2D6 (not shown).
FIGURE 3.

Structural features of chain A of the open P450 thioridazine complex with two molecules of thioridazine (pale green carbons) bound. Heteroatoms are colored as described for Fig. 2. A, a 2m|Fo| − D|Fc| thioridazine omit map is rendered as a mesh surface contoured at 1 σ around the two molecules. The schematic depicts portions of the surrounding structure (blue carbons) together with a corresponding structure of chain A of the closed P450 thioridazine structure (gray carbons). Ionic interactions are depicted by dashed lines labeled with the corresponding distances in Å. B, ProSmart overlay of the chains A and D indicating that the major differences occur around the site where the second molecule of thioridazine is bound. Chains C and B are highly similar to chains A and D, respectively, and are not shown. The binding pose of the thioridazine in the active site does not differ between the chains. In contrast, the presence of the ligand and lattice interactions between the helix A of chains A and D and C and B contribute to differences in conformation of the protein and the binding pose for the molecule of thioridazine bound in the entrance channel antechamber. Zinc ions (dark gray) are bound in the turn between helices G and H of each chain (Zn1), and there is a second zinc ion (Zn2) bound to chain A, which also binds to the same residues of chain C to stabilize a lattice contact between the two chains. C, tunnel surfaces generated by MOLE are open in chain A as a result of the binding thioridazine in the antechamber and conformational changes of the protein relative to the closed structure. The tunnels are calculated with the thioridazine and solvent molecules omitted. The tunnel surfaces are not intended to encompass the active site and antechamber, which are larger and irregularly shaped. The minimum clearance radius for the entrance to channel (Ch2B) is enlarged to 2.5 Å from the 1.7 Å observed for the closed structure, and a new channel (Ch2F) with a similar minimum clearance is open between the pre-helix A region, the turn in the C-terminal loop, and the helix F − F′ region. D, a different tunnel opens in chain D when compared chain A. The 2B and 2F channels are constricted in chain D, but an alternative channel (ChS) has opened between helix I, helix F. and the turn in the C-terminal loop due in part to changes in the Phe-483 and Phe-51 rotamers and the different positioning of the pre helix A region. These differences are associated with a different binding pose for thioridazine in the antechambers of the two chains A and D, as evident by comparing panels C and D.
The thioridazine molecule bound in the entrance channel antechamber forms a charge-stabilized hydrogen bond with Glu-222, suggesting that this acidic residue can stabilize initial substrate binding in the entrance channel (Fig. 3A). The presence of thioridazine in the entrance channel displaces helix F′ and the pre-helix A region away from each other, increasing the opening of the entrance channel and expanding the volume of the antechamber (Fig. 3A). This displacement of helix F′ and pre-helix A region is accompanied by changes in adjacent structural components that include helices F and G and the helix B-C loop containing helix B′, helix A, and the turn in β-sheet 1 as well as significant amino acid side-chain changes in the active site when compared with C121 crystal form.
The four chains in the asymmetric unit differ in the portion of the 2D6 structure that surrounds the entrance channel antechamber as illustrated in Fig. 3B for chains A and D. This reflects the flexibility of the cavity entrance and an asymmetric interaction of the helix A region of each chain in the crystal lattice that leads to differences in the positioning of pre helix A region. This asymmetric interaction is replicated between chains C and B. Chains A and C and chains B and D are highly similar to each other, 0.16 Å and 0.22 Å root mean square deviation, respectively, whereas differences between the chains in one group from the chains in the other group are larger, 0.67 Å root mean square deviation. All four chains have divalent zinc ions (Zn1 in Fig. 3B) in the site occupied by the nickel ion in chain B of the C121 crystal form as evidenced by anomalous difference maps. Another anomalous difference peak identified a second binding site for a divalent zinc ion that is formed by His-426 and Asp-422 in the finger loop of the meander region of chain A (Zn2 in Fig. 3B) and the corresponding residues of chain C (not shown). These interactions with Zn2 stabilize a lattice interaction between the two chains. The finger loop exhibits an altered conformation for residues 422–426 in the contact between chains B and D that does not form a similar zinc ion binding site.
As shown in Fig. 3B, almost all of the differences between the chains are in the regions around the flexible entrance to the active site channel. These differences are associated with an opening of different access channels in the two chains and binding poses for the thioridazine in the antechamber (Fig. 3, B–D). MOLE was used to analyze tunnels from the heme to surface. Thioridazine molecules and solvent molecules were ignored for this purpose. In chain A (Fig. 3C), two channels 2B and 2F were observed to open from the antechamber to solvent with minimal radii for clearance of > 2.4 Å. In contrast, the passage from the active site to the antechamber remained constricted by residues Phe-483, Phe-120, and Glu-216. In the absence of thioridazine, Glu-216 would likely adopt alternative orientations that would increase the size of the channel and allow the 2B and 2F channels to merge with each other. In contrast, chain D (Fig. 3D) exhibits a single open S channel from the heme to solvent passing between helix I, helix F-F′ loop, and the turn in the C-terminal loop where Phe-483 resides. This reflects differences in the pre-helix A region and the turn in the C-terminal loop (Fig. 3B) that are also associated with differences in the pose of the thioridazine bound in the antechamber as evidenced by the orientation of the phenothiazine moiety in the two chains (compare Fig. 3, C and D). In contrast, the interior active site cavity near the heme does not display significant differences between the chains, indicating that the effects of the lattice interactions and effects of the presence of thioridazine in the antechamber are localized near the cavity entrance.
Ligand Exchange in the Zinc Ion-stabilized P212121 Crystal Lattice
Attempts to co-crystallize P450 2D6 complexed with alternative ligands under similar conditions were not very successful, although a dataset with a high resolution limit of <3 Å was obtained for the prinomastat complex. As the helix F-G region exhibited a single interaction between hydrophobic side chains on helix G′ with the corresponding surface of helix G′ of the neighboring molecule in the P212121 lattice, it seemed likely that the entrance channel of the more open conformation of P450 2D6 could undergo elastic deformations of the polypeptide backbone and side-chain torsion angles to open further for the transit of substrates and inhibitors between the active site cavity and an adjacent solvent channel in the crystal lattice and allow for subsequent closure without disrupting the crystalline order necessary for x-ray diffraction. To test this possibility, high affinity ligands that could potentially compete for binding with thioridazine were added directly to the mother liquor 24 h before harvesting the crystals for data collection.
Competitive exchange was evident for the potent P450 2D6 inhibitors prinomastat, quinidine, quinine, and ajmalicine, and the diffraction quality of the crystals after the ligand exchange was similar to that of unsoaked crystals. As illustrated in Fig. 4, ligand omit electron density maps indicated that these high affinity ligands replaced thioridazine in the active site. Additionally, there was no evidence indicating that a second molecule of these compounds or thioridazine was bound in the entrance channel. These results indicate that ligand exchange occurs between the active site of the protein in the crystal lattice and the exterior solvent. Additionally, the protein structure exhibits a high degree of elasticity, as the structure must open wider to increase the minimum clearance estimated by Mole to be 4–5 Å in diameter to allow the passage of thioridazine and studied compounds between the buried active site and bulk solvent and return to a more closed conformation. In general, crystalline order for x-ray diffraction was largely retained with exception of the region between the N-terminal proline-rich motif and helix A containing the A′ helix, which was no longer stabilized by the presence of the thioridazine molecule in the entrance channel and often exhibited conformational heterogeneity.
FIGURE 4.

Binding of quinidine (A), quinine (B), ajmalicine (C), and prinomastat (D) in the active site of P450 2D6 after competitive displacement of thioridazine in crystals of the co-crystallized P450 2D6 ternary thioridazine complex. The gold mesh depicts 2m|Fo| − D|Fc| ligand omit maps contoured at 1 σ around the ligand. Distances between protonated nitrogens and Asp-301 and/or Glu-216 as well as hydrogen bonds and the coordinate covalent bond of the pyridine moiety of prinomastat or water to the heme iron are depicted by dashed lines with the distances shown in Å. P450 carbons are colored cyan, and ligand carbons are colored amber. Other atoms are colored as described in the legend to Fig. 2.
The exchange of ligands enabled a more detailed examination of binding interactions of the ligands with the protein including electrostatic interactions. Quinidine and quinine are diastereomers with different configurations of the hydroxylated, chiral carbon that connects the protonated and positively charged bicyclic quinuclidine rings and the aromatic quinolone moieties of the two compounds. A second configurational difference occurs for the chiral carbon of the bicyclic quinuclidine ring that is attached to the connector (Figs. 1 and 4, A and B. Other than the dihedral angles defining the quinuclidine and quinolone rings relative to the methanol linker, the only degrees of freedom are for the vinyl and methoxy rotamers attached to each ring, respectively. As a result of the configurational differences, the quinolone rings of the two compounds bind to different portions of the active site cavity when the positively charged bicyclic quinuclidine ring is positioned for favorable electrostatic interactions with the enzyme, as shown in Fig. 4. The quinolone ring is located in the distal portion of the active site under helices B′, G, and I for quinidine, whereas the quinolone ring of quinine is closer to the heme. The protonated nitrogen of the quinuclidine ring of quinidine is positioned roughly equidistant between the negatively charged Glu-216 and Asp-301 side chains with no intervening atoms and is hydrogen-bonded to a water molecule in the entrance channel (Fig. 4A). Additionally, the hydroxyl group on the linker is oriented for hydrogen bonding to the keto oxygen of the Glu-216 carboxylate group. This pose for quinidine is consistent with a report indicating that the binding affinities of quaternary amine analogs of quinidine with the alkyl substituents of varied sizes are similar to that of quinidine, whereas ester derivatives of the hydroxyl group reduced binding affinity significantly (30). The N-alkyl groups of the quinidine analogs can be easily accommodated in the entrance channel antechamber without altering electrostatic interactions of quinuclidine nitrogen with the protein, but modification of the hydroxyl group would disrupt hydrogen bonding with Glu-216 and clash with neighboring amino acids.
In contrast, the binding affinity of quinine was disrupted by an alkyl substituent on the quinuclidine nitrogen and more tolerant of esterification of the alcohol moiety (30). The quinuclidine bicyclic ring of quinine occupies a similar portion of the cavity as seen for quinidine, but the quinuclidine nitrogen is oriented with the protonated lone pair in close proximity to Glu-216 (Fig. 4B). This interaction would be disrupted by the alkyl moieties of the quaternary amine analogs. Additionally, the hydroxyl moiety of quinine linker is not positioned to form a hydrogen bond with any polar residues, and the ester derivatives can be more easily accommodated in the structure. These differences in location of the quinolone ring and polar interactions with the enzyme are likely to contribute to the reported second order of magnitude greater inhibitory potency of quinidine relative to quinine (11). The quinolone ring is located at the base of the S channel (Fig. 4B), and when quinine binds to chains A and C, Phe-483 and the turn in the C-terminal loop move outward to open the S channel and to more closely correspond to that of chain B and chain D in the open structure with thioridazine bound in the antechamber (Fig. 3D).
Prinomastat was included in these experiments so that the structure obtained after the prinomastat exchange could be compared with the 3QM4 structure of the co-crystallized prinomastat complex in the C121 crystal form (9). Coordination of the pyridyl nitrogen to the heme iron and hydrogen-bonding interactions of the hydroxamic acid group and the sulfonyl oxygen observed for the complex after soaking prinomastat into the crystal (Fig. 4D) are also evident in the 3QM4 co-crystallized complex. In contrast to the thioridazine and other three inhibitors, prinomastat is neutral at pH 7.4. As shown in Fig. 5, many of the amino acid side chains in the prinomastat complex were obtained by soaking (orange carbons), and in some regions, the positions of α carbons have moved from their positions in the 3TBG structure of the ternary thioridazine complex (gray carbons) representative of the crystals used in the soaking experiment to correspond more closely to their positions in the 3QM4 co-crystallized structure of the prinomastat complex (cyan carbons). In the soaking experiment the binding of prinomastat displaces a portion of helix I near the pyridyl group coordinated to the heme iron. This change is similar to the structure of this region seen in the 3QM4 complex, as seen in Fig. 5B for the Cα-carbons of residues Ser-304, Ala-305, Val-308, and Thr-309. This change in helix I is also seen for the ajmalicine complex but not for complexes with quinidine and quinine. Additionally, Phe-483 moves in to form non-bonded contacts with prinomastat (Fig. 5A). In contrast, the Cα carbons of the amino acid side chains attached to helices F and G of the structure, Leu-213, Glu-216, Gln-244, and Phe-247, and the helix B′ region, Leu-110 and Phe-112, remain in the more open position of these regions seen for the 3TBG structure of ternary thioridazine complex. Prinomastat compensates by adopting a slightly more extended conformation that maintains interactions with the active site contacts seen in the co-crystallized 3QM4 structure.
FIGURE 5.
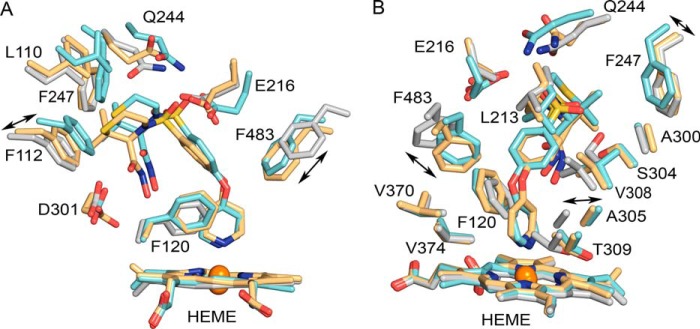
Superpositions of chains A of the 3TBG structure representative of the crystals before incubation (gray carbons), the 3TDA structure of prinomastat complex obtained after incubation of the crystals with prinomastat (amber carbons), and the 3QM4 structure obtained earlier for crystals of P450 2D6 co-crystallized with prinomastat (cyan carbons) are depicted in two views of the active site region. Other atoms are colored as described in the legend for Fig. 2.
The binding of ajmalicine elicited even larger changes in the structure of the protein when compared with the 3TBG structure of the ternary thioridazine complex that is representative of the starting crystals, and the ajmalicine soaked crystals exhibited the P21212 space group with a unit cell having the original c axis dimension reduced by half with a reduction of the number of molecules in the asymmetric unit from four to two (Fig. 6). The change in unit cell and space group reflect small changes in the packing of the four chains in the P212121 asymmetric unit that convert the original diad screw axis b to a diad axis that by convention is now the c axis of P21212 space group with the original c axis renamed the b axis in the new space group. The diad c-axis is oriented vertically in the plane of Fig. 6A and passes through the Zn2, which is in a special position. As a result, chains A and C and chains B and D of P212121 lattice are related by the 2-fold rotation about the c axis in the P21212 lattice. In both lattices the molecules display dense edge-to-edge contacts in vertical planes normal to the figure that are stabilized in part by zinc ions bound in the turn between helix G and H and the C-terminal end helix H of a symmetry-related copy of the same chain for each of the chains in the two asymmetric units (Fig. 2C). The different chains in each plane interact asymmetrically via a lattice interaction between helices A of the two chains. The meander finger projects outward from the triangular face of the protein proximal to the heme to form a contact between the dense layers that is stabilized by the zinc ion (Zn2) for two copies of chain A (Fig. 6, cyan) in the P21212 lattice and for chains A and C (Fig. 6B, magenta) in the P212121 lattice. These interactions impart stability to the crystal during ligand exchange and after changes in the conformation of the F-G region that result from ligand binding. As shown in Fig. 6, the lattice interactions between helix G′, which projects out from the distal triangular face and the meander contact between chain B proximal surfaces (Fig. 6A, gold) and between chains B and D (Fig. 6B, gray) differ between the two lattices. Although it is possible that the crystals formed differently before they were exposed to ajmalicine, this is unlikely because this lattice has not been observed for other crystals obtained under these crystallization conditions including those in replicate wells adjacent to the crystals that were soaked with ajmalicine. Nevertheless, the data set obtained for co-crystallization of P450 2D6 with prinomastat under similar conditions exhibited the same unit cell. Alternatively, these changes may have arisen from the effects of ajmalicine on the conformation of the helix F-G region of the protein, which reduces lattice interactions for helix G′ of chain A, which is offset in part by increased lattice interactions for the finger loop on the proximal surface of chain B.
FIGURE 6.
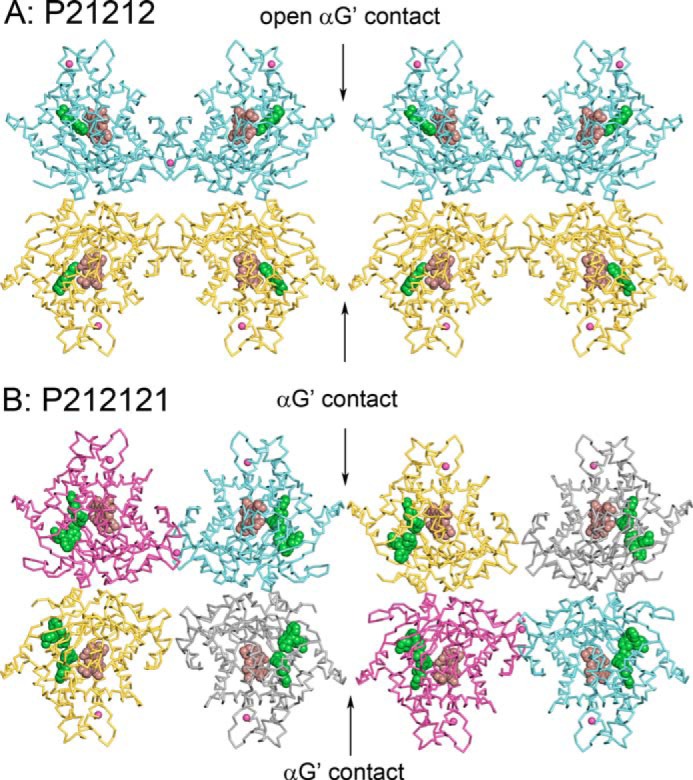
Comparison of the P21212 crystal lattice of the ajmalicine complex obtained after displacement of thioridazine and the P212121 crystal lattice of the P450 2D6 co-crystallized with two molecules of thioridazine bound in the active site. Carbons of chains A (cyan), B (amber), C (magenta), and D (dark gray) are colored differently. Hemes are rendered as spheres with carbons colored brown, and ajmalicine or thioridazine are rendered with green spheres. Zinc ions in molecular interfaces are rendered as magenta spheres. The two molecules in the asymmetric unit of the P21212 lattice correspond roughly to the A-D and C-B pairs in the larger unit cell of the P212121 space group but are shifted slightly. The contacts between helices G′ of neighboring molecules are associated with changes in the conformation of the helix F′-G″ region seen in Fig. 7.
As shown in Fig. 7, both the helix B′ and helix F-G regions adapt to the binding of ajmalicine (yellow-orange carbons) and more closely resemble the 3QM4 structure (cyan carbons) of the co-crystallized prinomastat complex than the 3TBG structure of the ternary thioridazine complex (gray carbons) representative of the starting crystals for the soaking experiment. Ajmalicine potently inhibits P450 2D6 with Ki values of roughly 10 nm (12, 13). Ajmalicine is a more rigid molecule than prinomastat, quinine, and quinidine with only two rotatable bonds for the carboxymethyl group. Ajmalicine binds to P450 2D6 with the plane of the aromatic indole moiety stacked above Phe-120 and under helix F and with the amide hydrogen of the indole ring aligned to form a hydrogen bond with the Ser-304 on helix I (Fig. 4C). The positively charged, protonated nitrogen is located roughly equidistant from the Glu-216 and Asp-301 carboxyl oxygens, but these distances are shorter than seen for quinidine, reflecting a closer approach, 3.7 Å, of ajmalicine to Asp-301 due to the positioning of the indole ring. The hydrogen of the protonated amino group is oriented toward Glu-216, which together with the shorter distance of 2.9 Å indicates that a charge-stabilized hydrogen bond is formed with the carboxyl group of Glu-216 (Fig. 4C). Formation of the ionized hydrogen bond with the protonated amine of ajmalicine is associated with movement of Glu-216 and helix F toward the turn in the C-terminal loop to position Glu-216 to form an ionized hydrogen bond with protonated amine of ajmalicine (Fig. 7A). As a result of this change, helix F′ and helix G′ move away from the contact formed with the neighboring chain, and the ajmalicine structure more closely approximates the closed 3QM4 structure of the co-crystallized prinomastat complex (Fig. 7B). Helix B-C loop moves in concert with helix F′ in the three structures shown in Fig. 7A. The width of ajmalicine indole group forces helix I to bulge outward from the active site (Fig. 7A) as seen in the prinomastat complexes and for the C121 structure of the binary thioridazine complex. Additionally, the turn in the C-terminal loop and the turn preceding helix A move into the active site even though helix A remains in position seen for the 3TBG structure representative of the starting crystals. Thus, in contrast to the more flexible structure of prinomastat that adapts to the structure of the protein in the crystals, the protein and protein lattice adjust to maximize strong interactions with the more rigid ajmalicine.
FIGURE 7.
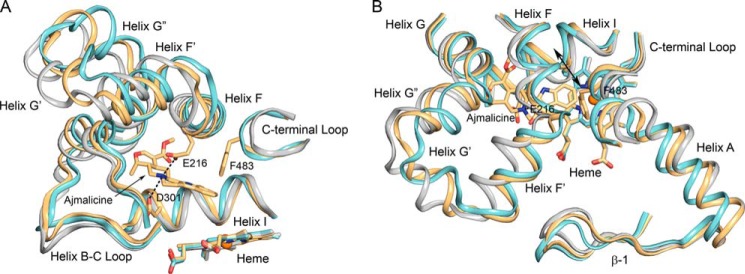
Aligned chains A of the 3TBG structure representative of the crystals before incubation with ajmalicine (gray carbons), the 4WNV structure of the ajmalicine complex obtained after incubation of the crystals with ajmalicine (amber carbons), and the 3QM4 structure obtained earlier for crystals of P450 2D6 cocrystallized with prinomastat (cyan carbons) are depicted in two views of the active site region. Other atoms are colored as described in the legend for Fig. 2. The schematic representation of the polypeptide chains illustrates the differences exhibited by the 4WNV structure of the ajmalicine complex relative to the representative structure of the starting crystals and the closed 3QM4 structure of the P450 2D6. The double-headed arrow identifies the region of helix I that moves in and out of the active site near the heme iron.
Summary
This study characterized a more open conformation of P450 2D6 than the conformation exhibited by the closed thioridizine and prinomastat complexes crystallized in the C121 lattice. Most structures for P450 complexes are relatively closed in that open channels to the surface have minimum clearances that preclude the passage of ligands or even of water molecules between the active site and outside of the protein. These channels form between the loop-like structures, sheet β1, the N-terminal region through helix A, the C-terminal loop, and the helix F-G region that enclose the buried active site cavity (31, 32). Each of these channels has the potential to expand and coalesce to form passages sufficiently large for ligand movement into and out of P450 active sites in open P450 structures or in molecular dynamics simulations of ligand passage enabled by steered or randomly applied acceleration of the ligands to overcome barriers to egress (29).
The more open structure reflects the binding of two molecules in the active site and an expanded entry channel antechamber. Although uncommon, structures of microsomal P450s 2A13 (33), 2B4, and 2B6 (34) as well as cytochrome 21A2 (35) have been reported with two molecules present in the active site and an access channel, respectively. Entry of the outer molecule before closure of the entrance channel is likely to account for the presence of the two thioridazine molecules in the structure and is likely to reflect the high concentrations of thioridazine and protein in the crystallization solution, which increase the rate of binding. Moreover, incorporation and stabilization of the thioridazine binding in the entry channel in the crystal lattice further enhances the formation of the ternary complex. In contrast, co-crystallization of thioridazine with P450 2D6 using very similar concentrations of thioridazine and protein but different crystallization conditions produce a closed binary thioridazine complex consistent with the roll of the lattice in stabilization of the ternary complex.
The thioridazine molecule bound in the antechamber could represent an encounter complex that is stabilized by the ionized hydrogen bond between the protonated nitrogen of thioridazine and Glu-222. Consistent with the proposed role of Glu-222 in formation of the encounter complex, mutation of Glu-222 to an alanine was reported to reduce Vmax for bufuralol 1′-hydroxylation without altering Km or enantiomer selectivity (36). Although the encounter complex is a transient interaction before passage into the active, a second encounter complex forms a stable ternary complex with the enzyme in the crystal lattice.
Stable binding of a second molecule of thioridazine in the entrance channel is associated with localized changes in the loop-like structures that border the antechamber in the ternary complex when compared with the binary complex with thioridazine. These changes in the polypeptide backbone are associated with open channels from the antechamber to bulk solvent that have almost coalesced to form an open cleft to the active site, but constrictions remain that separate the antechamber from the active site and separate the 2b, 2f, and S channels that exit the protein. Open clefts have been identified for structures of mammalian P450s 2B4 (37, 38) and 24A1 (39). Moreover, the 2F9Q structure of ligand-free P450 2D6 (10) exhibits a more open S channel between helix F − F′ region and the turn in the C-terminal loop providing further evidence for the flexibility of this region.
Ligand exchange in the crystals indicates that ligand occupancy is in equilibrium with the mother liquor. In the four examples documented here, the ligands were added in higher concentrations than thioridazine, and with the exception of quinine they exhibited much higher binding affinities. As a result, the replacement of thioridazine by each ligand in the active site was evident as judged by the strong electron density defining the structurally distinct replacement ligand. None of the complexes exhibited a second ligand in the antechamber, suggesting that the ability of the two molecules of thioridazine to form a ternary complex, albeit at very high concentrations of ligand and protein, might reflect a complementary fit in the cavity that was not duplicated by homologous pairs of the other ligands. Ternary and quaternary complexes are thought to underlie complex kinetics exhibited by P450s. The concentrations used for protein crystallization are ∼1000-fold greater than the Km for mesoridazine formation from thioridazine determined by Obach and Reed-Hagen (40). These authors noted that thioridazine exhibited a small tendency to exhibit biphasic character suggestive of two binding sites with the population of the second binding site occurring at the highest concentration of thioridazine examined, 40 μm. The authors concluded that this effect was unlikely to be significant for in vivo exposure to thioridazine.
Multiple binding sites can also underlie substrate-specific differences for inhibition for P450s, which necessitates screening new drugs for potential drug-drug interactions using several substrates. A study by Vandenbrink et al. (41) examined the potential for 2D6 to exhibit substrate specific Ki values using 20 inhibitors with 5 substrates that included thioridazine. They noted that a multisite model better fit the data for inhibition of mesoridazine formation from thioridazine than single site models for inhibition by metoprolol and by tramadol. Interestingly, inhibition by quinidine but not quinine was observed to be better fit by the two-site inhibition model for the other four substrates examined. Additionally, a relatively high Ki value was observed for inhibition of metoprolol demethylation by quinidine that was consistent with in vivo pharmacokinetic data. These observations could reflect the occupancy of the distal portion of the active site by quinidine (Fig. 4A), whereas quinine occupies the portion of the active proximal to the heme iron (Fig. 4B). In the case of quinidine, some substrates could bind in the remaining portion of the active site near the heme and exhibit residual activity when quinidine occupies the distal portion of the cavity (Fig. 4A). Taken together, these observations suggest that homotropic and heterotropic binary complexes of small molecules with P450 2D6 may be more prevalent than previously thought.
Consistent with the absence of a second ligand in the entrance channel for the binary complexes observed after the soaks, the C-terminal loop, which had been pushed outward by the thioridazine bound in the antechamber of the crystallized protein, moved inward to establish hydrophobic interactions with ajmalicine, prinomastat, and quinidine. Quinine is an exception because the quinoline moiety occupies this portion of the active site cavity and forces Phe-483 on the turn of the C-terminal loop outward (Fig. 4).
Differential effects of ligands on the structure of the protein are indicative of adjustments to accommodate the structurally distinct ligands in different ways. Both ajmalicine and prinomastat alter helix I near the heme iron to correspond more closely to the outward bow seen for the closed structures of the binary complexes of prinomastat and thioridazine co-crystallized with P450 2D6. In contrast, the conformation of this portion of helix I more closely matches that of the 3TBG structure of the ternary thioridazine complex representative of the starting crystals and of the substrate free 2F9Q structure. Significant differences in the dihedral angles of the Phe-120 side chain were seen also to contribute to stabilization of ligand binding. Moreover, a relatively large change in the helix F-G loop was associated with the binding of ajmalicine that effectively closed the opening between helix F and the pre-helix A region and the β1 sheet.
Many cationic drugs are cleared predominantly by hepatic P450 2D6-mediated oxidative metabolism (1). Early observations indicated that sites of metabolism for these compounds were often located 5–10 Å and most typically 7 Å from the cationic atom (42), suggesting that a complementary anionic amino acid provided an orienting restraint on the binding of substrates in the P450 2D6 active site and contributed to binding affinity. Mutagenesis experiments implicated both Glu-216 and Asp-301 as anionic residues that might influence substrate orientation. Of these, Glu-216 is unique to 2D6 among human family 2 P450s, which typically exhibit neutral residues in this region of the active site, whereas Asp-301 is conserved in other enzymes including P450s 2C8, 2C9, 2C19, and 2E1, which also contribute to hepatic drug clearance but are not associated generally with the clearance of cationic compounds. With the exception of prinomastat, all of the ligands used in this study exhibited positively charged, protonated nitrogens that were positioned between Asp-301 and Glu-216 in the active site and positioned 10–12 Å from the heme iron. The inhibitors ajmalicine, quinidine, and quinine have not been reported to be metabolized by the enzyme, and these compounds are not positioned well for oxygenation by the reactive heme iron bound oxene intermediate. Thioridazine in the C121 structure is located roughly 1 Å farther from the heme iron than would be expected for oxygenation of the sulfur, the predominant reaction.
Additionally, Asp-301 and Glu-216 can serve as H-bond acceptors for the protonated nitrogens as seen for Asp-301 with thioridazine and for Glu-216 with ajmalicine and quinine. Of the two acidic residues, Glu-216 can more freely adopt different configurations and flexibility of the protein backbone, which allows the helix F-F′ loop to move as seen in ajmalicine complex, which provides versatility for ligand binding interactions with structurally distinct compounds. In contrast, quinidine did not form a hydrogen bond with either Asp-301 or Glu-216. Rather, the quinuclidine nitrogen was positioned roughly equidistant between the two acidic side chains. As noted earlier, alkylation of this nitrogen to form the positively charged quaternary amine, which is not an H-bond donor, did not significantly alter the high affinity binding seen for the parent compound (30). Thus, the protonated nitrogen does not need to form the ionized hydrogen bond for high affinity binding.
The role of Asp-301 in ligand binding is somewhat surprising as this residue is conserved in other family 2 P450s where it plays a structural role in stabilizing the turn in the helix B′-C loop that places Phe-120 in the P450 2D6 active site. Asp-301 exhibits similar hydrogen bonding with the polypeptide backbone of the helix B′-C loop to that seen for the other enzymes. These interactions also limit the range of movement for Asp-301. P450 2D6 displays greater accessibility to Asp-301 for compounds as seen in the thioridazine complexes. This reflects a longer helix B′-C loop arising from the insertion of four additional amino acids in this loop for P450 2D6 when compared with P450s 2E1, 2C8, 2C9, and 2C19. This difference in accessibility to Asp-301 together with the presence of the ionic residues Glu-222, Arg-221, and Glu-216 in the antechamber and active site contribute the unique role of P450 2D6 in human drug metabolism. Additionally, the crystal form used to obtain this information can be readily employed to characterize the binding of chemically diverse substrates and inhibitors to P450 2D6.
Acknowledgments
Portions of this research were carried out at the Stanford Synchrotron Radiation Lightsource, a national user facility operated by Stanford University on behalf of the United States Department of Energy, Office of Basic Energy Sciences. The Stanford Synchrotron Radiation Lightsource Structural Molecular Biology Program is supported by the United States Department of Energy, Office of Biological and Environmental Research and by the National Center for Research Resources, Biomedical Technology Program, and NIGMS of the National Institutes of Health.
This work was supported, in whole or in part, by National Institutes of Health Grants R01GM031001 (to E. F. J.) and R01GM098538 (to Q. Z.).

This article contains supplemental Table 1.
The atomic coordinates and structure factors (codes 3TBG, 3TDA, 4WNT, 4WNU, 4WNV, and 4WNW) have been deposited in the Protein Data Bank (http://wwpdb.org/).
Cytochrome (or P450) is a generic term for a cytochrome P450 enzyme; individual P450s are identified using a number-letter-number format based on amino acid sequence relatedness.
- PDB
- Protein Data Bank
- Fo
- observed structure factor
- Fc
- calculated structure factor
- RTZ
- R enantiomer of thioridazine.
REFERENCES
- 1. Wang B., Yang L. P., Zhang X. Z., Huang S. Q., Bartlam M., Zhou S. F. (2009) New insights into the structural characteristics and functional relevance of the human cytochrome P450 2D6 enzyme. Drug Metab. Rev. 41, 573–643 [DOI] [PubMed] [Google Scholar]
- 2. von Bahr C., Movin G., Nordin C., Lidén A., Hammarlund-Udenaes M., Hedberg A., Ring H., Sjöqvist F. (1991) Plasma levels of thioridazine and metabolites are influenced by the debrisoquine hydroxylation phenotype. Clin. Pharmacol. Ther. 49, 234–240 [DOI] [PubMed] [Google Scholar]
- 3. Wójcikowski J., Maurel P., Daniel W. A. (2006) Characterization of human cytochrome p450 enzymes involved in the metabolism of the piperidine-type phenothiazine neuroleptic thioridazine. Drug Metab. Dispos. 34, 471–476 [DOI] [PubMed] [Google Scholar]
- 4. Niedzwiecki D. M., Mailman R. B., Cubeddu L. X. (1984) Greater potency of mesoridazine and sulforidazine compared with the parent compound, thioridazine, on striatal dopamine autoreceptors. J. Pharmacol. Exp. Ther. 228, 636–639 [PubMed] [Google Scholar]
- 5. Wen B., Zhou M. (2009) Metabolic activation of the phenothiazine antipsychotics chlorpromazine and thioridazine to electrophilic iminoquinone species in human liver microsomes and recombinant P450s. Chem. Biol. Interact. 181, 220–226 [DOI] [PubMed] [Google Scholar]
- 6. Eap C. B., Guentert T. W., Schãublin-Loidl M., Stabl M., Koeb L., Powell K., Baumann P. (1996) Plasma levels of the enantiomers of thioridazine, thioridazine 2-sulfoxide, thioridazine 2-sulfone, and thioridazine 5-sulfoxide in poor and extensive metabolizers of dextromethorphan and mephenytoin. Clin. Pharmacol. Ther. 59, 322–331 [DOI] [PubMed] [Google Scholar]
- 7. Meyer J. W., Woggon B., Baumann P., Meyer U. A. (1990) Clinical implications of slow sulphoxidation of thioridazine in a poor metabolizer of the debrisoquine type. Eur. J. Clin. Pharmacol. 39, 613–614 [DOI] [PubMed] [Google Scholar]
- 8. Kroemer H. K., Eichelbaum M. (1995) “It's the genes, stupid”: molecular bases and clinical consequences of genetic cytochrome P450 2D6 polymorphism. Life Sci. 56, 2285–2298 [DOI] [PubMed] [Google Scholar]
- 9. Wang A., Savas U., Hsu M. H., Stout C. D., Johnson E. F. (2012) Crystal structure of human cytochrome P450 2D6 with prinomastat bound. J. Biol. Chem. 287, 10834–10843 [DOI] [PMC free article] [PubMed] [Google Scholar]
- 10. Rowland P., Blaney F. E., Smyth M. G., Jones J. J., Leydon V. R., Oxbrow A. K., Lewis C. J., Tennant M. G., Modi S., Eggleston D. S., Chenery R. J., Bridges A. M. (2006) Crystal structure of human cytochrome P450 2D6. J. Biol. Chem. 281, 7614–7622 [DOI] [PubMed] [Google Scholar]
- 11. Otton S. V., Inaba T., Kalow W. (1984) Competitive inhibition of sparteine oxidation in human liver by β-adrenoceptor antagonists and other cardiovascular drugs. Life Sci. 34, 73–80 [DOI] [PubMed] [Google Scholar]
- 12. Fonne-Pfister R., Meyer U. A. (1988) Xenobiotic and endobiotic inhibitors of cytochrome P-450dbl function, the target of the debrisoquine/sparteine-type polymorphism. Biochem. Pharmacol. 37, 3829–3835 [DOI] [PubMed] [Google Scholar]
- 13. Strobl G. R., von Kruedener S., Stöckigt J., Guengerich F. P., Wolff T. (1993) Development of a pharmacophore for inhibition of human liver cytochrome P-450 2D6: molecular modeling and inhibition studies. J. Med. Chem. 36, 1136–1145 [DOI] [PubMed] [Google Scholar]
- 14. Omura T., Sato R. (1964) The carbon monoxide-binding pigment of liver microsomes. II. Solubilization, purification, and properties. J. Biol. Chem. 239, 2379–2385 [PubMed] [Google Scholar]
- 15. Lee S. C., Bennett B. C., Hong W. X., Fu Y., Baker K. A., Marcoux J., Robinson C. V., Ward A. B., Halpert J. R., Stevens R. C., Stout C. D., Yeager M. J., Zhang Q. (2013) Steroid-based facial amphiphiles for stabilization and crystallization of membrane proteins. Proc. Natl. Acad. Sci. U.S.A. 110, E1203–E1211 [DOI] [PMC free article] [PubMed] [Google Scholar]
- 16. Adams P. D., Afonine P. V., Bunkóczi G., Chen V. B., Davis I. W., Echols N., Headd J. J., Hung L. W., Kapral G. J., Grosse-Kunstleve R. W., McCoy A. J., Moriarty N. W., Oeffner R., Read R. J., Richardson D. C., Richardson J. S., Terwilliger T. C., Zwart P. H. (2010) PHENIX: a comprehensive Python-based system for macromolecular structure solution. Acta Crystallogr. D Biol. Crystallogr. 66, 213–221 [DOI] [PMC free article] [PubMed] [Google Scholar]
- 17. Emsley P., Lohkamp B., Scott W. G., Cowtan K. (2010) Features and development of Coot. Acta Crystallogr. D Biol. Crystallogr. 66, 486–501 [DOI] [PMC free article] [PubMed] [Google Scholar]
- 18. Headd J. J., Echols N., Afonine P. V., Grosse-Kunstleve R. W., Chen V. B., Moriarty N. W., Richardson D. C., Richardson J. S., Adams P. D. (2012) Use of knowledge-based restraints in phenix. refine to improve macromolecular refinement at low resolution. Acta Crystallogr. D Biol. Crystallogr. 68, 381–390 [DOI] [PMC free article] [PubMed] [Google Scholar]
- 19. McCoy A. J., Grosse-Kunstleve R. W., Storoni L. C., Read R. J. (2005) Likelihood-enhanced fast translation functions. Acta Crystallogr. D. Biol. Crystallogr. 61, 458–464 [DOI] [PubMed] [Google Scholar]
- 20. Brunger A. T. (2007) Version 1.2 of the crystallography and NMR system. Nat. Protoc. 2, 2728–2733 [DOI] [PubMed] [Google Scholar]
- 21. Froimowitz M., Cody V. (1993) Biologically active conformers of phenothiazines and thioxanthenes. Further evidence for a ligand model of dopamine D2 receptor antagonists. J. Med. Chem. 36, 2219–2227 [DOI] [PubMed] [Google Scholar]
- 22. McDowell J. J. H. (1975) The crystal and molecular structure of thioridazine, a derivative of phenothiazine. Acta Crystallogr. B 31, 2256–2264 [Google Scholar]
- 23. Schüttelkopf A. W., van Aalten D. M. (2004) PRODRG: a tool for high-throughput crystallography of protein-ligand complexes. Acta Crystallogr. D. Biol. Crystallogr. 60, 1355–1363 [DOI] [PubMed] [Google Scholar]
- 24. Smart O. S., Womack T. O., Sharff A., Flensburg C., Keller P., Paciorek C., Vonrhein C., Bricogne G. (2011) Grade, version 1.101, Global Phasing Ltd., Cambridge, UK [Google Scholar]
- 25. O'Boyle N. M., Banck M., James C. A., Morley C., Vandermeersch T., Hutchison G. R. (2011) Open babel: an open chemical toolbox. J. Cheminform. 3, 33. [DOI] [PMC free article] [PubMed] [Google Scholar]
- 26. Kleywegt G. J., Jones T. A. (1994) Detection, delineation, measurement, and display of cavities in macromolecular structures. Acta Crystallogr. D. Biol. Crystallogr. 50, 178–185 [DOI] [PubMed] [Google Scholar]
- 27. Sehnal D., Svobodová Váeková R., Berka K., Pravda L., Navrátilová V., Banáš P., Ionescu C. M., Otyepka M., Koča J. (2013) MOLE 2.0: advanced approach for analysis of biomacromolecular channels. J. Cheminform. 5, 39. [DOI] [PMC free article] [PubMed] [Google Scholar]
- 28. Nicholls R. A., Fischer M., McNicholas S., Murshudov G. N. (2014) Conformation-independent structural comparison of macromolecules with ProSMART. Acta Crystallogr. D Biol. Crystallogr. 70, 2487–2499 [DOI] [PMC free article] [PubMed] [Google Scholar]
- 29. Cojocaru V., Winn P. J., Wade R. C. (2007) The ins and outs of cytochrome P450s. Biochim. Biophys. Acta 1770, 390–401 [DOI] [PubMed] [Google Scholar]
- 30. Hutzler J. M., Walker G. S., Wienkers L. C. (2003) Inhibition of cytochrome P450 2D6: structure-activity studies using a series of quinidine and quinine analogues. Chem. Res. Toxicol. 16, 450–459 [DOI] [PubMed] [Google Scholar]
- 31. Johnson E. F., Stout C. D. (2013) Structural diversity of eukaryotic membrane cytochrome p450s. J. Biol. Chem. 288, 17082–17090 [DOI] [PMC free article] [PubMed] [Google Scholar]
- 32. Johnson E. F., Connick J. P., Reed J. R., Backes W. L., Desai M. C., Xu L., Estrada D. F., Laurence J. S., Scott E. E. (2014) Correlating structure and function of drug-metabolizing enzymes: progress and ongoing challenges. Drug Metab. Dispos. 42, 9–22 [DOI] [PMC free article] [PubMed] [Google Scholar]
- 33. DeVore N. M., Scott E. E. (2012) Nicotine and 4-(methylnitrosamino)-1-(3-pyridyl)-1-butanone binding and access channel in human cytochrome P450 2A6 and 2A13 enzymes. J. Biol. Chem. 287, 26576–26585 [DOI] [PMC free article] [PubMed] [Google Scholar]
- 34. Shah M. B., Wilderman P. R., Pascual J., Zhang Q., Stout C. D., Halpert J. R. (2012) Conformational adaptation of human cytochrome P450 2B6 and rabbit cytochrome P450 2B4 revealed upon binding multiple amlodipine molecules. Biochemistry 51, 7225–7238 [DOI] [PMC free article] [PubMed] [Google Scholar]
- 35. Zhao B., Lei L., Kagawa N., Sundaramoorthy M., Banerjee S., Nagy L. D., Guengerich F. P., Waterman M. R. (2012) Three-dimensional structure of steroid 21-hydroxylase (cytochrome P450 21A2) with two substrates reveals locations of disease-associated variants. J. Biol. Chem. 287, 10613–10622 [DOI] [PMC free article] [PubMed] [Google Scholar]
- 36. Masuda K., Tamagake K., Okuda Y., Torigoe F., Tsuzuki D., Isobe T., Hichiya H., Hanioka N., Yamamoto S., Narimatsu S. (2005) Change in enantioselectivity in bufuralol 1″-hydroxylation by the substitution of phenylalanine 120 by alanine in cytochrome P450 2D6. Chirality 17, 37–43 [DOI] [PubMed] [Google Scholar]
- 37. Scott E. E., He Y. A., Wester M. R., White M. A., Chin C. C., Halpert J. R., Johnson E. F., Stout C. D. (2003) An open conformation of mammalian cytochrome P450 2B4 at 1.6 Å resolution. Proc. Natl. Acad. Sci. U.S.A. 100, 13196–13201 [DOI] [PMC free article] [PubMed] [Google Scholar]
- 38. Zhao Y., White M. A., Muralidhara B. K., Sun L., Halpert J. R., Stout C. D. (2006) Structure of microsomal cytochrome P450 2B4 complexed with the antifungal drug bifonazole: insight into P450 conformational plasticity and membrane interaction. J. Biol. Chem. 281, 5973–5981 [DOI] [PubMed] [Google Scholar]
- 39. Annalora A. J., Goodin D. B., Hong W. X., Zhang Q., Johnson E. F., Stout C. D. (2010) Crystal structure of CYP24A1, a mitochondrial cytochrome P450 involved in vitamin D metabolism. J. Mol. Biol. 396, 441–451 [DOI] [PMC free article] [PubMed] [Google Scholar]
- 40. Obach R. S., Reed-Hagen A. E. (2002) Measurement of Michaelis constants for cytochrome P450-mediated biotransformation reactions using a substrate depletion approach. Drug Metab. Dispos. 30, 831–837 [DOI] [PubMed] [Google Scholar]
- 41. VandenBrink B. M., Foti R. S., Rock D. A., Wienkers L. C., Wahlstrom J. L. (2012) Prediction of CYP2D6 drug interactions from in vitro data: evidence for substrate-dependent inhibition. Drug Metab. Dispos. 40, 47–53 [DOI] [PubMed] [Google Scholar]
- 42. de Groot M. J., Ackland M. J., Horne V. A., Alex A. A., Jones B. C. (1999) Novel approach to Predicting P450-mediated drug metabolism: development of a combined protein and pharmacophore model for CYP2D6. J. Med. Chem. 42, 1515–1524 [DOI] [PubMed] [Google Scholar]